

Abstract
Donor T cells that respond to host alloantigens following allogeneic bone marrow transplantation (BMT) induce graft-versus-host (GVH) responses, but their molecular landscape is not well understood. MicroRNAs (miRNAs) regulate gene (mRNA) expression and fine-tune the molecular responses of T cells. We stimulated naive T cells with either allogeneic or nonspecific stimuli and used argonaute cross-linked immunoprecipitation (CLIP) with subsequent ChIP microarray analyses to profile miR responses and their direct mRNA targets. We identified a unique expression pattern of miRs and mRNAs following the allostimulation of T cells and a high correlation between the expression of the identified miRs and a reduction of their mRNA targets. miRs and mRNAs that were predicted to be differentially regulated in allogeneic T cells compared with nonspecifically stimulated T cells were validated in vitro. These analyses identified wings apart-like homolog (Wapal) and synaptojanin 1 (Synj1) as potential regulators of allogeneic T cell responses. The expression of these molecular targets in vivo was confirmed in MHC-mismatched experimental BMT. Targeted silencing of either Wapal or Synj1 prevented the development of GVH response, confirming a role for these regulators in allogeneic T cell responses. Thus, this genome-wide analysis of miRNA-mRNA interactions identifies previously unrecognized molecular regulators of T cell responses.
Introduction
The molecular landscape of T cell responses to specific antigens is not well understood. The functional responses of cells rely upon the genes that are expressed and the fine-tuning of these genes by micro-RNAs (miRNAs), which have emerged as critical regulators of the mammalian immune system (1). Expression patterns and levels of miRNAs are regulated in concert with protein-coding genes (mRNAs) during immune responses (2). The mRNA and/or miR expression profiles in different T cell subsets, such as naive, effector, and memory CD8 T cells (3), CD8 T cells after nonspecific CD3/CD28 (CD3/28) activation (4), and tolerant CD8 T cells (5), as well as T cell activation responses to nonphysiological nominal antigen and OVA (6), have been recently reported. However, all of these analyses were performed using mRNA and miRNA profiling microarrays. Furthermore, there are no data on the mRNA-miR interactome in response to biologically and clinically relevant antigens such as alloantigens.
Predicting the target mRNAs of an miR is a major challenge. miRs regulate the expression of genes by hybridizing the target sites with complementary sequences, resulting in translational repression, mRNA cleavage, or destabilization through effector RNA–mediated silencing complexes (RISCs) and argonaute-containing (AGO-containing) micro-ribonucleoprotein (miRNP) effector complexes (7, 8). Although bioinformatic analyses have greatly improved the ability to predict bona fide miRNA binding sites, the computational algorithms used are imperfect and disparate. In addition, these algorithms may have a high false-positive rate of target prediction (4, 9, 10) because of the inability to definitively distinguish direct and indirect miRNA target interactions, even when the miRNAs are coimmunoprecipitated with AGO proteins (11, 12). Recently, AGO-CLIP has been demonstrated to provide a robust platform for the exploration of the specificity and range of miR actions and the identification of precise sequences of clinically relevant miRNA-mRNA interactions (11, 13–15).
Allogeneic hematopoietic cell transplantation (HCT) is an important therapy for many hematopoietic and epithelial malignancies as well as a spectrum of nonmalignant diseases (16, 17). During HCT, the donor T cells from allografts are critical for the success and effectiveness of this therapy. The donor T cells that respond to alloantigens cause GVH responses (16, 17), whereas those that respond to nonalloantigens are critical for immune reconstitution (16). The miRNA-mRNA interactome of the T cells that respond to alloantigens has not been elucidated.
We hypothesized that the specific changes in the expression of miRNAs and/or mRNAs in allogeneically activated T cells that occur during HCT would be distinct from those in T cells that respond to nonspecific stimulation. To test this hypothesis and to mitigate the potential false-positive and negative results, we used a modified version of the novel high-throughput sequencing of RNA isolated by cross-linking immunoprecipitation (HITS-CLIP technology). We used the CLIP procedure and standard microarray platforms to screen for miRNA and mRNA transcripts instead of HITS to avoid establishing libraries based on the restricted amount of the copurified RNA and the two required RNA ligation reactions, which may cause a reduction or overexpression of some signals (12, 18, 19). The microarray profiling was based on stringently purified ternary AGO/miRNA/mRNA complexes that were obtained from the CLIP procedure (AGO-CLIP-ChIP). We detected 44 miRs that were differentially enriched and 48 mRNAs that were uniquely enriched in T cells stimulated with allogeneic DCs compared with T cells that were subjected to syngeneic or CD3/28 stimulation. Among them, Wapal and Synj1 were found to be the most differentially expressed. These two molecules and other highly differentially expressed miRs and mRNAs were validated by PCR and protein analyses, both in vitro and in vivo. The functional relevance of these novel molecules, Wapal and Synj1, in the regulation of allostimulated T cell proliferative and cytokine responses was confirmed. Thus, we elucidate here the miRNA-mRNA landscape and identify what we believe to be novel molecular regulators of allogeneic T cell responses.
Results
AGO-CLIP analyses of allostimulated T cells.
CD3/28 costimulation was used to model nonspecific T cell activation. However, the factors involved in allogeneic T cell activation, e.g., mismatched MHC molecules, alloantigens, and the panoply of costimulatory molecules in addition to CD28, suggest that alloantigen-stimulated T cell responses are likely to be qualitatively different from those induced by nonspecific CD3/28 stimulation (Supplemental Table 1). To evaluate the distinct molecular landscape of allostimulated T cells from that of nonspecifically activated cells and to distinguish this landscape from the mere engagement of costimulatory molecules and TCR triggering in the absence of an alloantigen stimulus, we compared the differential patterns of miR-mRNA expression in T cells stimulated by CD3/28-activated T cells, allogeneic DCs, and syngeneic DCs. Following stimulation, the T cells were processed for CLIP-ChIP analysis (Figure 1), as described in Methods.
Figure 1. AGO-CLIP-ChIP procedures and mRNA CLIP-ChIP profiles of Allo T versus CD3/28 T cells.

(A) Schematic illustration of the enrichment profiles of miRNAs and their targets using AGO-CLIP-ChIP. After CLIP, the miRNPs were coimmunoprecipitated with anti-AGO2 antibodies and then bound to the bridge antibody [anti-rabbit IgG F(c)], which links to the protein A agarose beads. The miRNAs and the target mRNAs that associated with the AGO protein were processed using Exiqon miRNA and Affymetrix Gene 430.2 microarrays. This high-throughput assay can screen direct and legitimate miRNA targets in a genome-wide manner and can be used to identify an miRNA-mediated gene regulation network. (B) mRNA CLIP-ChIP profiles of Allo and CD3/28 T cells. Transcript enrichments after CLIP were screened using Affymetrix 430.2 GeneChips. Enrichment values were calculated for each gene using a robust multiarray average. This modeling strategy converts the PM probe values into an enrichment value (log2 transformed) for each gene. The probe sets with a fold change of 2 or greater were selected (an enrichment value of 26 or greater was used for one of the two samples to prevent the selection of large fold changes based on two small numbers).
The AGO proteins were purified while bound to mouse T cell RNAs (mRNAs and miRNAs) by immunoprecipitation with anti-AGO antibodies after ultraviolet irradiation under stringent conditions (11). The bound mRNAs and miRNAs were isolated from split samples and used in miRNA (Exiqon) and gene expression (Affymetrix) microarrays. The Pearson’s correlation coefficient R of biological triplicates of the mRNA microarrays of the syngeneically stimulated T cells (Syn T cells), the allogeneically stimulated T cells (Allo T cells), and the CD3/28-stimulated T cells was greater than 0.8 (Supplemental Figure 1A; supplemental material available online with this article; doi: 10.1172/JCI70013DS1). In addition, the Pearson’s correlation coefficient of biological duplicates of the miRNA microarrays of the Syn T, Allo T, and CD3/28 T cells was greater than 0.91 (Supplemental Figure 1C). We also analyzed the Pearson’s correlation coefficient of the miRNA and mRNA enrichment data for different T cell groups. In experiments 1, 2, and 3, for mRNA microarrays of Syn T versus Allo T cells, the Pearson’s correlation coefficient R = 0.76, 0.78, and 0.78, respectively; for Syn T versus CD3/28 T cells, R = 0.67, 0.65, and 0.67, respectively; for Allo T versus CD3/28 T cells, R = 0.71, 0.77, and 0.74, respectively (Supplemental Figure 1B). In experiments 1 and 2, for miRNA microarrays of Syn T versus Allo T cells, R = 0.75 and 0.77, respectively; for Syn T versus CD3/28 T cells, R = 0.7 and 0.75, respectively; for Allo T versus CD3/28 T cells, R = 0.82 and 0.8, respectively (Supplemental Figure 1D).
To analyze the transcripts that were enriched in the gene expression microarrays of the stringently purified samples after CLIP, the enrichment values were calculated for each gene using a robust multiarray average (RMA) (20, 21). The probe sets with a fold change of 2 or greater were selected (the probe sets were subjected to the additional constraint that one of the two samples had an enrichment value of 26 or greater to prevent the selection of genes with large fold changes based on two small numbers); approximately 10,000 transcripts were selected from the 45,000 candidates on the Affymetrix mouse genome 430 2.0 array platform. The number of probe sets that were unique and common in the comparisons of the Allo T and CD3/28 T cells with the Syn T cells were analyzed to ensure a fold change of 2 or greater. The analysis of the three sets of experiments revealed that 1,226 transcripts were commonly enriched in both Allo T and CD3/28 T cells, 200 transcripts were uniquely enriched in the Allo T cells, and 288 transcripts were uniquely enriched in the CD3/28 T cells (Table 1, Figure 1B, Supplemental Tables 2–4, and Supplemental Table 11).
Table 1.
Enrichment of 48 transcripts reduced in alloactivated T cells after CLIP

From these, a total of 44 miRNAs were found to be enriched in the stringently purified samples after AGO-CLIP. The results imply that only active miRNAs that are bound to RISCs are selectively detected after the stringent CLIP protocol. These were identified from an miRNA microarray platform that included probes specific for 1,032 mouse miRNAs and have been annotated by miRBase, version 16.0. These data thus suggest that the number of miRNAs involved in active RISC-mediated gene expression in T cells represents only 5% of the 1,032 mouse miRNAs (Table 2). This number of enriched miRNAs is lower than, but comparable to, a previous study based on cloning frequency, which found that the total number of individual miRNAs that were cloned from mouse naive, effector, and memory T cells was 69, 51, and 54, respectively; in addition, 50% of the top 15 identified miRNAs overlapped with our results (3).
Table 2.
Profile of miRNAs enriched in miRNPs after CLIP, ranked by signal strength

The enriched miRNAs were then classified into four groups based on their enrichment in comparison with Syn T cells and were composed of 11, 7, 18 and 5 miRNAs, respectively (Table 2 and Figure 2). Specifically, compared with the enrichment values in the Syn T cells, group 1 showed significantly increased enrichment in both Allo T and CD3/28 T cells, group 2 displayed increased enrichment only in Allo T cells and reduced or unchanged enrichment in CD3/28 T cells, group 3 exhibited reduced enrichment in Allo T cells and increased or unchanged enrichment in CD3/28 T cells, and group 4 displayed reduced enrichment in both Allo T and CD3/28 T cells. Of the remaining three miRNAs that were found to be enriched, miR-541 and miR-875-3p exhibited increased or reduced enrichment in CD3/28 T cells only, whereas miR-3100-3p did not show changes in any of the three T cell groups that were studied (Figure 2).
Figure 2. miRNA CLIP-ChIP profile.

A total of 44 miRNAs that are annotated in miRBase, version 16.0, were detected after CLIP using the sixth-generation miRCURY LNA Chip. These miRNAs were classified into four groups according to the differential enrichment profiles that were observed in Syn, Allo, and CD3/28 T cells.
Computational analyses of differentially expressed miRNAs and mRNAs.
We next determined whether the mRNA landscape of the T cells that respond to alloantigens, syngeneic stimulus, or CD3/28 stimulation is different and linked those to the changes in miRNA enrichment after CLIP, because miRNAs functionally guide miRNPs to target mRNAs (13). T cell activation is dominated by widespread differential gene upregulation (22), which is due at least in part to the alleviation of the miRNA-associated repression of genes. We focused on the group 3 miRNAs, which was the group in which they were decreased in the Allo T cells but increased or unchanged in the CD3/28 T cells when compared with Syn T cells (see above and Supplemental Figure 2). Thus, the potential targets in the distinct gene set that is differentially regulated in response to activation signals might be the 68 enriched transcripts that were uniquely downregulated by at least 2-fold only in Allo T cells (Table 1). The 68 uniquely downregulated transcripts in this group represent 66 genes, 64 of which have been annotated with Gene Ontology (GO) Biological Process domain terms ( http://www.geneontology.org/), and many of which have been suggested to be associated with immune response, cell division, and spindle assembly (Table 3).
Table 3.
Genes with reduced enrichments after CLIP in allogeneic activated T cells were associated with GO Biological Process domain terms

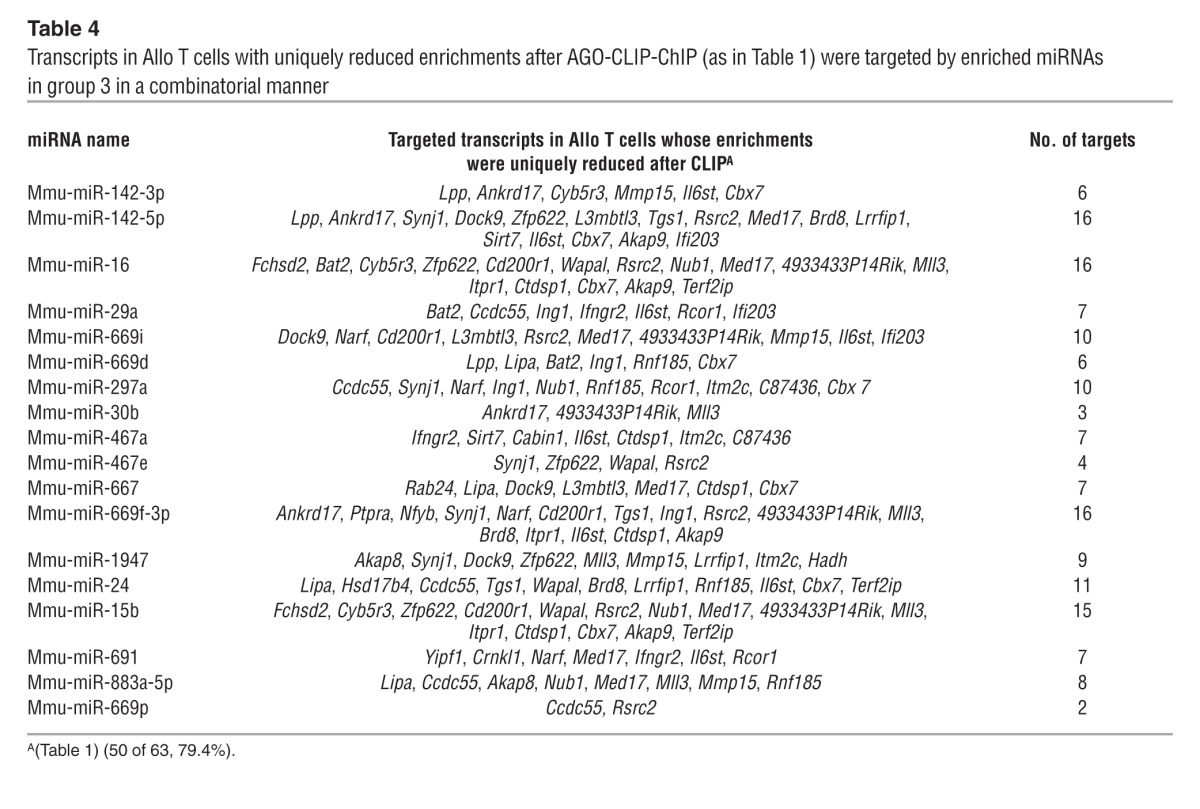
The formation of miRNA/AGO/mRNA ternary complexes (11) after CLIP preserves the coexistence of miRNAs and their target transcripts in RISCs and thus permits the identification of more stringent and direct miRNA-mRNA interactions and enhances the true target prediction rate (11, 22, 23). We therefore used TargetScan (version 6) and miRanda to determine the target frequencies of the group 3 miRNAs (decreased in Allo T cells but increased or unchanged in the CD3/28 T cells when compared with Syn T cells) and their potential targets (Table 1). The 68 uniquely downregulated transcripts represent 66 genes, 63 of which were recognized by TargetScan and miRanda. A total of 18 miRNAs from group 3 targeted 50 of these 63 gene transcripts (mRNAs) (79.4%; Table 4). Importantly, most transcripts were targeted by multiple miRNAs; in fact, 56% of the transcripts were targeted by at least 4 miRNAs (Supplemental Table 5). This finding indicates that the stringent CLIP protocol that was used allowed the miRNAs to interact with their bona fide target transcripts, thus significantly increasing the targeting frequency.
Table 4.
Transcripts in Allo T cells with uniquely reduced enrichments after AGO-CLIP-ChIP (as in Table 1) were targeted by enriched miRNAs in group 3 in a combinatorial manner
To further determine whether the high targeting rate in the samples processed after AGO-CLIP commonly reflected the coexistence of miRNAs and their target transcripts in RISC, the differences between the average targeting frequencies of the enriched or unenriched miRNAs for the same transcripts were calculated. We reasoned that the transcripts that were uniquely reduced in the Allo T cells (Table 1) are potential targets of the group 3 miRNAs (Figure 2 and Supplemental Figure 2) and conversely, the transcripts that were uniquely enriched in the Allo T cells (Supplemental Table 2) are potential targets of the group 2 miRNAs (Figure 2). We randomly selected a set of miRNAs that were not enriched after AGO-CLIP (this set included the same number of miRNAs as that in groups 2 and 3; Supplemental Tables 6–8) and assumed that the transcripts listed in Table 1 and Supplemental Table 2 are their potential targets. Using the prediction programs TargetScan and miRanda, the average targeting frequencies of the transcripts of the enriched miRNAs were 5–7 times higher than those of the targeting frequencies of the unenriched miRNAs (Supplemental Figure 3); this was true for the transcripts that are both uniquely increased (Supplemental Tables 2, 7, and 8) and reduced in Allo T cells after CLIP (Tables 1 and 4, and Supplemental Table 6). Because a reduced enrichment of transcripts in RISC may also reflect the release of transcripts due to the reduction in the amounts of the targeting miRNAs, the targeted genes are in turn “freely” expressed, allowing Allo T cells to uniquely respond to allostimulation. We used gene set enrichment analysis (GSEA) to identify the most predominant genes that uniquely respond to allostimulation, (24) and to identify the miRNA-targeted transcripts in this category that are most substantially overrepresented. The Syn T and Allo T cell data were analyzed under the assumption that the enriched transcripts in Syn T cells will be enriched to a greater extent than those in Allo T cells. We identified 8 transcripts that were most significantly enriched (with an enrichment score [ES] of 0.973, a normalized enrichment score [NES] of 1.098, and a false discovery rate [FDR] q value of 0.136), and 48 of 50 transcripts obtained a positive enrichment score (Figure 3, Supplemental Figure 4, Supplemental Table 9, and data not shown).
Figure 3. GSEA.

To identify the most predominant genes that uniquely respond to allostimulation and exhibit reduced enrichment after CLIP (Table 2), we used GSEA to identify the transcripts that were most significantly overrepresented. The Syn and Allo data were analyzed with the assumption that the number of enriched transcripts in the Syn T cells would be higher than that in Allo T cells. Of the 50 transcripts that exhibited reduced enrichment (Table 1) and were predicted by TargetScan and miRanda to be targets of the group 3 miRNAs (Figure 2 and Supplemental Figure 2), 48 were positively confirmed by GSEA analysis. Of these, 8 transcripts were most significantly enriched, including Wapal, Synj1, and Lpp.
These results collectively suggest that the active miRNAs and their targeted transcripts coexist in RISCs because of the similar changes in their molecular quantities and provided for more accurate miRNA target predictions.
Validation of the differentially regulated miRNAs in alloactivated T cells.
Using quantitative PCR (qPCR), we next analyzed and verified the enriched patterns of some of the group 3 miRNAs, including miR-142-3p, -142-5p, -16, -29a, and -669d, which are hematopoietic specific and were previously reported to be immunomodulating miRNAs (3, 25–27). These miRNAs were selected based on the average signals obtained in the miRNA microarray, which were at least 100 times greater in one experimental set of Syn T–, Allo T–, or CD3/28 T cell–stimulated cells (Figure 2 and Supplemental Figure 2) and were predicted to target all eight of the transcripts that were found to be substantially enriched in this group (group 3) by GSEA analysis (Figure 3 and Supplemental Table 9). We validated the RNAs that were isolated from Syn T, Allo T, or CD3/28 T cells following the stringent AGO-CLIP protocol, as discussed above and as described in Methods. The miRNA expression profile was determined by TaqMan probes specific for the selected mature miRNAs. Compared with Syn T cells, the expression levels of the 5 miRNAs tested were significantly reduced in Allo T cells. In addition, miR-16, 142-3p, and 142-5p, but not miR-669D and -29a, were increased in CD3/28 T cells (Figure 4A). This pattern was thus identical to that obtained from the miRNA microarrays (Supplemental Figure 2).
Figure 4. Validation of the selected miRNAs that were enriched in group 3 after AGO-CLIP-ChIP.

Expression patterns of the selected miRNAs in T cells were assessed by TaqMan qPCR. (A) Enrichment of selected group 3 miRNAs in Syn, Allo, and CD3/28 T cells after AGO-CLIP. Data shown are the combined results of three independent experiments (mean ± SEM). (B) Relative miRNA expression levels in whole-cell lysates of Syn, Allo, and CD3/28 T cells. Data shown are the combined results of three independent experiments (mean ± SEM).
We next analyzed whether there was any potential artifact in the expression levels of miRNA from subjecting the samples to CLIP analyses. Therefore, to determine the relationship between miRNA levels in the AGO-CLIP–enriched T cells and whole-cell lysates, we isolated the total cellular RNA, which contains small RNA, from Syn T, Allo T, and CD3/28 T cells that had not been subjected to CLIP. Compared with Syn T cells, the expression levels of miR-16, 142-3p, 142-5p, 669D, and 29a were significantly reduced in Allo T cells, similar to the results obtained after CLIP (Figure 4, A and B). In addition, the expression of miR-142-3p and -142-5p was significantly increased in CD3/28 T cells, and a nonsignificant increase in miR-16, miR-669D, and 29a expression was observed in CD3/28 T cells (Figure 4B). Another miRNA, miR-351, which was assigned to group 4 because of its reduced enrichment in both Allo T and CD3/28 T cells compared with Syn T cells, was also chosen as an additional validation control (Figure 4, A and B). These findings indicate that the miRNA profiles before and after CLIP are similar and that the levels of enriched active miRNAs in RISCs are indeed determined by whole-cell levels of the miRNAs, i.e., by the transcriptional regulation of the miRNA target genes. Collectively, all of these validation results mirrored the results of the miRNA microarrays (Figure 2 and Supplemental Figure 2). Although the purity of T cells harvested for analyses after culture was consistently greater than 90%, these data cannot rule out a potentially small contamination by DCs. Such a contamination is nonetheless likely to have an effect on all the culture groups except for the anti-CD3/28 Ab–stimulated group.
Validation of the expression of the mRNA and protein targets of miRNAs in alloactivated T cells.
To verify the enriched transcript expression pattern identified by gene expression microarray following the AGO-CLIP protocol and to avoid the positive selection of a single transcript by the analysis algorithm, the six genes that were targeted by multiple miRNAs and involved in different GO biological processes (Table 3) were selected: Wapal, Lpp, Synj1, Fchsd2, Cyb5r3, and Med17. We extracted all of the transcripts in the Affymetrix datasets that were detected by multiple perfect-match (PM) probe sets for a single gene. Compared with Syn T cells, the average transcript signals of the six genes were significantly reduced in Allo T cells but, with the exception of Lpp, were not significantly different in CD3/28 T cells (Supplemental Figure 5). These results are consistent with the global analysis (Figure 1B and Table 1).
Next, we further validated three of these six candidate genes, Wapal, Synj1, and Lpp (Figure 5 and Table 3), and also Fchsd2. Synj1 and Lpp have been implicated in developmental abnormalities (28–31), Wapal has been implicated in the regulation of cell proliferation through the promotion of sister chromatid resolution during the mitotic prophase (refs. 32–34 and Table 3), and the function of Fchsd2 (FCH and double SH3 domains protein 2) has not yet been identified. The enrichment of the transcripts of these four selected genes was examined by qPCR with specific primers from the RNA isolated from Syn T, Allo T, or CD3/28 T cells following the AGO-CLIP protocol. Compared with Syn T cells, we detected significantly reduced signals in Allo T cells for all four genes; however, with the exception of Lpp, no remarkable differences in the enrichment of any of the genes were observed in CD3/28 T cells (Figure 5A).
Figure 5. Validation of the expression patterns of selected genes targeted by group 3 miRNAs.

(A) mRNA enrichment of selected genes targeted by group 3 miRNAs after AGO-CLIP. Data shown are the combined results of three independent experiments (mean ± SEM). (B) Whole-cell mRNA expression patterns of selected genes targeted by group 3 miRNAs. Data shown are the combined results of three independent experiments (mean ± SEM). (C) Whole-cell protein expression patterns of selected genes (Wapal, Synj1, and Lpp) targeted by group 3 miRNAs. Protein expression was assessed by Western blot. Data shown are representative of three independent experiments. Full, uncut gels are shown in the Supplemental Figure 8.
We next further validated these four genes and their proteins in the whole cells (without subjecting them to AGO-CLIP enrichment) from Syn T, Allo T, and CD3/28 T cells to rule out any potential artifact from the AGO-CLIP protocol. We analyzed the mRNA and protein expression levels by qPCR and immunoblotting. Consistent with the above findings, compared with Syn T cells, the mRNA and protein expression levels of Wapal, Synj1, Lpp, and Fchsd2 were significantly increased in Allo T cells but not in CD3/28 T cells (Figure 5, B and C; no FCHSD2 antibody was available for immunoblotting). These data collectively suggest that Wapal, Synj1, and Lpp expression is regulated through the combinatorial targeting of multiple miRNAs (Table 4), and these genes are uniquely expressed only in T cells following allostimulation.
Confirmation of the differentially expressed miRNA-mRNAs during in vivo GVH reaction.
Because the donor T cells that respond to alloantigens cause GVH disease (GVHD), these data imply that the genes might be uniquely regulated and expressed in vivo in the donor T cells following MHC-mismatched allogeneic bone marrow transplantation (BMT) (16, 17). Therefore, we next performed allogeneic BMT across MHC disparity, as described previously and here in Methods (35, 36). Donor T cells were then purified from the spleens of either allogeneic or syngeneic recipients (n = 6 mice per group) on day 14 (as donor T cell expansion is maximal at this time point) after B6→BALB/c BMT (35, 36). We performed qPCR analysis to isolate total cellular RNA from the purified donor T cells (using congenic CD45.1,H2b) from either syngeneic or allogeneic recipients and also from naive B6 mice. Compared with naive and Syn T cells, three of the miRNAs evaluated (miR-16,-142-5p, and -669D as representative of those that were unique to Allo T cells from the in vitro group 3 miRNAs) were significantly downregulated in the T cells from allogeneic recipients (Figure 6A). To avoid misleading fold changes based on extremely low levels of miRNA expression, we examined the expression levels of the selected miRNAs in naive T cells and found that miR-16, miR-142-5p, and miRNA-669D exhibited Ct values of 17 (highest), and 20 and 28 (lowest); in addition, snoRNA135, which is a stably expressed small nucleolar RNA used as a loading control, had a Ct value of 20 (Supplemental Figure 6). These results are consistent with a previous report that miR-16 and miR-142-5p, but not miRNA-669D, are hematopoietic miRNAs and mirror the expression rank that was observed in the miRNA microarray experiments after CLIP (Table 2), indicating that the enriched miRNA signals in RISCs are closely related to the in vivo expression levels within cells.
Figure 6. Use of in vivo BMT to validate selected group 3 miRNAs and the mRNA expression patterns of their predicted targets (Wapal, Synj1, and Lpp).

(A) Expression patterns of selected group 3 miRNAs in isolated naive T cells and donor T cells (Syn T and Allo T cells) on day 14 after BMT. Data shown are the combined results of two independent experiments (mean ± SEM). (B) mRNA expression patterns of selected genes that are predicted targets of group 3 miRNAs. These patterns were determined using isolated naive T cells and donor T cells (Syn T and Allo T cells) 14 days after BMT. Data shown are the combined results of two independent experiments (mean ± SEM).
Correspondingly, the expression levels of the Wapal, Lpp, and Synj1 mRNAs were also significantly increased in Allo T cells (Figure 6B), consistent with the results obtained in vitro (Figure 5, B and C). Importantly, Wapal, Lpp, and Synj1 were most substantially overrepresented in GSEA analysis and are the combinatorial targets of group 3 miRNAs, including miR-16, -142-5p, and -669D. Wapal is a combinatorial target of miR-16, -24, 142-5p, -467e, and -15b; Lpp is targeted by miR-142-3p, -142-5p, and -669D; and Synj1 is the target of miR-142-5p, -297a, -467e, -669f-3p, and -1947 (Table 4). These in vitro and in vivo findings collectively demonstrate the important roles of specific miRNAs in the regulation of specific mRNAs and suggest that Wapal, Lpp, and Synj1 might be novel regulators of in vivo allogeneic T cell responses following BMT.
Wapal and Synj1 regulate allogeneic T cell responses.
We next determined whether the miRNA-regulated unique expression of Wapal, Synj1, and Lpp in T cells actually has a functional role in regulating T cell response to alloantigens. Previous studies have implicated Wapal in the promotion of sister chromatid resolution during the mitotic prophase (32–34) and have implicated Synj1 in multiple biological processes, including phosphatidylinositol-mediated signaling (31, 37, 38) and the positive regulation of receptor-mediated endocytosis (38). However, to date, there have been no reports on the role of Wapal and Synj1 in T cell function or in immunity. We therefore used shRNA lentiviral particles to silence Wapal and Synj1 in T cells by first testing the silencing efficiency. After Allo T cells were infected with WAPAL and SYNJ1 shRNA lentiviral particles or control shRNA lentiviral particles for 3 days, the T cells were isolated by negative selection, and RNA was isolated for qPCR analysis. The results showed that Wapal and Synj1 were successfully knocked down by approximately 70%–80% compared with their levels in Allo T cells infected with control shRNA lentiviral particles; however, the lentiviral particles did not affect the expression level of P300/CBP-associated factor (PCAF), which was used as a control (Supplemental Figure 7). We then used the shRNA lentiviral–infected T cells in mixed lymphocyte reaction (MLR) experiments. When the T cells were infected with control shRNA lentiviral particles, a significantly higher degree of proliferation was observed for Allo T cells, but not Syn T cells. However, the proliferation of Allo T cells infected with WAPAL or SYNJ1 shRNA lentiviral particles but not with scrambled control was significantly reduced compared with that of Allo T cells infected with control lentiviral particles (Figure 7A). Interestingly, the double-infected T cells (infected with both WAPAL and SYNJ1 shRNA lentiviral particles) exhibited even greater inhibition of proliferation than Allo T cells infected with only WAPAL or SYNJ1 shRNA lentiviral particles (Figure 7A). These results imply that both Wapal and Synj1 specifically affect T cell proliferation during allostimulation. We also evaluated the effect of Wapal and Synj1 in the ability of the allostimulated T cells to produce cytokines under the conditions illustrated in Figure 7A. Silencing of Wapal and/or Synj1, but not the scrambled lentiviral control, reduced the secretion of IFN-γ, IL-17, and IL-6 (Figure 7, B–D). However, the secretion of IL-2 (Figure 7E) and TGF-β (data not shown) was not affected, while knockdown of Lpp did not affect T cell proliferation (data not shown).
Figure 7. Effects of Wapal and Synj1 knockdown on allogeneic T cell responses.

Effects of Wapal and/or Synj1 knockdown on the production of (A) Allo T cells, (B) IFN-γ, (C) IL-17, (D) IL-6, and (E) IL-2. (F) Proliferation of T cells stimulated with CD3+CD28+ antibodies. Data shown are the combined results of three independent experiments (mean ± SEM). (G) Relative mRNA expression of Synj1 and Wapal was significantly increased in OVA-specific OT-II TCR transgenic T cells cocultured with OVA323-339–pulsed DCs. (H) Increased expression of Synj1 and Wapal in OVA-specific TCR transgenic T cells after transplantation. OT-II T cells were purified 7 days after transplantation. mRNA expression of Synj1 and Wapal was assessed by qPCR. The expression of Synj1 and Wapal was significantly higher in OT-II T cells than in naive T cells, but was significantly lower than in B6 T cells following B6→BALB/c BMT. Data shown are the combined results of three independent experiments (mean ± SEM). *P < 0.01; **P < 0.001. KD, knockdown; Scra, scrambled; S, Synj1; W, Wapal.
Next, we determined whether Wapal and Synj1 were uniquely critical for the regulation of T cell responses following allogeneic stimulation. The knockdown of Wapal and/or Synj1 did not alter the proliferation of T cells when stimulated by anti-CD3/28 (Figure 7F), consistent with the lack of change in expression levels (Figure 5, B and C). These data suggest that Wapal and Synj1 regulate T cell responses following alloantigen stimulation, but not when stimulated by anti-CD3/28 Abs.
However, allostimulation in an MLR is a composite effect of multiple Allo-Ag stimulation in the context of many available costimulatory molecules, whereas CD3/28 activation mimics polyclonal activation using only one costimulatory pathway. Therefore, we next determined whether T cells respond to a defined nominal antigen (OVA) in the context of many of the potentially available costimulatory molecules. We therefore tested the response of OT-II–specific CD4+ T cells when stimulated by DCs pulsed with OVA and compared the expression of Wapal and Synj1 to that following allogeneic stimulation. Compared with unstimulated OT-II T cells, the expression of both Wapal and Synj1 was significantly increased in OT-II–specific T cells that were stimulated by OVA-pulsed DCs (Figure 7G). However, the expression of Wapal and Synj1 was significantly less than was observed following alloantigen stimulation of WT naive T cells (Figure 7G).
We further analyzed whether the differences in the increases in Wapl and Synj1 expression following stimulation with nominal antigen OVA and alloantigen in vitro are also relevant in vivo. To this end, we tested the expression of Wapal and Synj1 on day 7 following in vivo stimulation of B6 OT-II T cells and compared it with their expression in B6 donor T cells following allogeneic B6→BALB/c BMT. Consistent with the in vitro expression, stimulation of T cells with OVA in vivo caused an increase in the expression of Wapl and Synj1 when compared with unstimulated naive OT-II cells (Figure 7H). However, the increase in Wapal and Synj1 expression was significantly lower than that in B6 T cells following allogeneic BMT (Figure 7H). It is, however, important to note that in contrast to the T cells harvested following OVA stimulation (in which 100% of them are OVA-specific OT-II cells), the T cells harvested following allogeneic BMT are mixed and not just specific for MHC-disparate alloantigen. Nonetheless, despite containing a much smaller percentage of antigen-specific (MHC-specific) T cells, Wapal and Synj1 expression was significantly greater in the T cells harvested from Allo BMT recipients than in OT-II T cells responding to OVA (Figure 7H). These data thus collectively suggest that the expression of Wapal and Synj1 is enhanced when stimulated by any antigens (nominal OVA or MHC-disparate alloantigen) in the presence of multiple costimulatory molecules, but the increase in expression is significantly greater in the T cells responding to alloantigen (Figure 7H).
Wapal and Synj1 regulate GVHD.
We next determined the functional relevance for the increased in vivo expression of Wapal and Synj1 in donor T cells following MHC-disparate experimental BMT. We performed allogeneic BMT using a clinically relevant B6 (H2b)→BALB/c (H2d) MHC-disparate model as discussed in Methods (35, 36). All of the recipient animals were conditioned lethally and transplanted with T cell–depleted (TCD) BM along with B6 donor T cells that were infected with either control shRNA lentiviral particles or WAPAL- and SYNJ1-specific shRNA lentiviral particles to knock down both Wapal and Synj1. As shown in Figure 8, all of the syngeneic animals survived without signs of clinical GVHD, ruling out nonspecific toxicity from the lentiviral transduction of T cells. The allogeneic animals that received control lentiviral–transfected T cells showed signs of severe clinical GVHD (Figure 8A) and demonstrated 100% mortality (Figure 8B) by day 45. By contrast, allogeneic animals that were transplanted with WAPL/SYNJ1-specific shRNA showed a significant reduction in the severity of clinical GVHD and demonstrated significantly greater survival (Figure 8, A and B). We believe that these data collectively suggest a heretofore unreported novel and functional role for Wapl and Synj1 as regulators of in vivo allogeneic T cell responses.
Figure 8. Knockdown of Synj1 and Wapal in T cells attenuates acute GVHD severity and mortality.

BALB/c mice received 800 cGy of total body irradiation (split dose) and were transplanted with 5 × 10⁶ TCD BM. They also received 0.75 × 10⁶ T cells from allogeneic B6 donors that were transduced prior to infusion with lentiviral particles containing WAPAL- and SYNJ1-specific shRNAs or scramble control ex vivo. Syngeneic B6 mice were given 1,000 cGy of total body irradiation and transplants of 5 × 10⁶ BM and 2 × 10⁶ T cells from B6 Ly 5.2 donors that were transduced with scramble control particles ex vivo. Knockdown of Synj1 and Wapal reduced (A) GVHD clinical severity after allogeneic BMT and (B) increased survival. Data shown are the combined results of two independent experiments (mean ± SEM). **P < 0.03.
Discussion
The molecular landscape of mRNAs and miRs during T cell responses to nonspecific stimuli has been reported (3, 6), but to date, the miR-mRNA interactome of T cells to biologically relevant antigenic stimuli such as alloantigens has not been reported. It is unknown whether the responses to biologically relevant allostimulation would be germane to those to nonspecific nominal antigens. We therefore compared the miR-mRNA interactions between allostimulation and nonspecific stimulation of T cells and found several specific alterations in the T cell molecular landscape. miRNAs regulate gene (mRNA) expression and fine-tune the molecular responses of T cells. However, two major challenges in the study of the posttranscriptional regulation of gene expression by miRNAs are the definition of their targets and the profiling of miRNA expression across different tissues and/or cells under various experimental conditions. Using a novel CLIP method and subsequent ChIP microarray analyses, we profiled the miR responses and the direct mRNA targets of the responding miRs in T cells following allostimulation and compared them with nonspecific and syngeneic stimulation. We identified and validated, both in vitro and in vivo, a unique expression pattern of miRs and mRNAs following the allostimulation of T cells. This genome-wide analysis of miRNA-mRNA interactions identified the previously unrecognized molecules Wapl and Synj1 as potentially novel regulators of allogeneic T cell responses.
Specific miRNA-mRNA interactions and high-throughput analyses of the downstream effects of miRNAs on mRNAs and proteins have been the focus of many research studies and were first experimentally studied through the use of RNA-binding protein immunoprecipitation microarray and ChIP (RIP-ChIP), which provided valuable insights on miRNA networks and the regulation of gene expression (15). However, RIP-ChIP cannot distinguish direct and indirect miRNA target interactions. HITS-CLIP was developed to directly identify AGO-miRNA-mRNA interactions in living cells in a genome-wide manner (11–13, 39). In this study, we used a modified version of this novel technology, i.e., we used ChIP microarrays instead of HITS to avoid establishing libraries based on the restricted amount of copurified RNA and the two required RNA ligation reactions (19, 39). Similar to AGO-HITS-CLIP, AGO-CLIP-ChIP is capable of identifying direct miRNA-mRNA target interactions in living cells.
Previous CLIP or HITS-CLIP experiments that analyzed either binary protein-RNA interactions or ternary protein-small RNA-RNA interactions were performed in neuronal and other tissues (13, 18, 39–44), but not in primary immune cells. In brain tissue, AGO-HITS-CLIP had much greater predictive value (true positive rate of 73%), and false-positive rates were improved by 10- to 12-fold; for example, the 3′UTR of the Itgb1 mRNA has approximately 50 predicted miRNA target sites, but only 5 AGO-mRNA ternary clusters (11). In the current study, AGO-CLIP-ChIP yielded a 79.4% prediction rate and average targeting frequencies that were increased by 5- to 7-fold in T cells (Table 4 and Supplemental Figure 3). Compared with other reports, the CLIP-ChIP experiments detected only 5% of the miRNAs that were enriched in the stringently purified CLIP samples from the 1,032 candidates on the platform. This value is lower than that detected by either the cloning frequency, which yielded values of the total number of individual miRNAs that were cloned from mouse naive, effector, and memory T cells of 69, 51, and 54, respectively (50% of the top 15 identified miRNAs overlapped with our results; ref. 3), or than that detected by qPCR, which revealed that 71 miRNAs were differentially expressed in human T cells (4). These observations imply that only active miRNAs that are bound to RISCs are selectively enriched by the CLIP-ChIP technology, which has a lower detection rate. However, compared with previous CLIP-sequencing or HITS-CLIP experiments, AGO-CLIP-ChIP detected approximately 30-fold more enriched transcripts than CLIP sequencing (10,000 transcripts versus 343 CLIP tags) (18) as well as 50% of the HITS-CLIP tag clusters (10,000 transcripts versus 19,158 HITS-CLIP tag clusters) (12, 13), indicating that the detection capability of CLIP-ChIP is much higher than that of CLIP sequencing, but lower than that of HITS-CLIP. In the CLIP-ChIP experiments, the obtained Pearson’s correlation coefficient was greater than 0.8 between duplicates of mRNA/AGO complexes and greater than 0.91 between duplicates of miRNA/AGO complexes; these coefficients are close to those obtained in previous HITS-CLIP studies (11) and demonstrate sufficient quality control. All 63 transcripts in Table 2, which were obtained by AGO-CLIP, could be targeted by group 3 miRNAs. However, we only obtained a 79.4% prediction by TargetScan and miRanda. It is likely that the remaining 20.6% of the transcripts (genes) are targeted by miRNAs outside of their 3′ untranslated region (UTR), such as a 5′UTR with no biological activity (11, 45), a functional 3′UTR located within 10 kb downstream of the annotated transcript and exons, and intron or noncoding locations with unknown function, all of which are not included or considered in the current computational algorithms for target prediction (11, 46, 47). This observation partially explains why the number of HITS-CLIP tag clusters (19,158) is higher than the number of CLIP-ChIP detected transcripts (10,000) (12, 46, 48). Thus, our results show that CLIP-ChIP technology outperforms bioinformatics approaches for the screening of direct, legitimate miRNA targets in a genome-wide manner and could be used to identify a miRNA-mediated gene regulation network.
Previous studies have reported the comparison of miRNA profiles in naive, effector, and memory T cells based on cloning frequency (3) and an integrated profile of the miRNAs, mRNAs, and proteins in activated T cells based on a PCR-miRNA array, but were done without CLIP (4, 6). Furthermore, to date, the miRNA-mRNA interactome of T cells responding to allostimulation has not been mapped. By contrast, our study used CLIP-ChIP to profile the ternary AGO-enriched genome-wide miRNA-mRNA interactions in T cells and determined that the profiles in Allo T cells are distinct from those in Syn T and nonspecific CD3/28–stimulated T cells.
Because the most immune-responsive genes exhibited marked regulatory expression 12–24 hours after stimulation (4, 25, 49), we used this time point to harvest the T cells for all of our analyses. Compared with syngeneic stimulation (self-antigen stimulated with engagement of all costimulatory molecules), the alloantigen-stimulated (MHC disparate and engagement of all costimulatory molecules) and the CD3/28-stimulated (non-MHC–mediated activation with engagement of only CD28 costimulatory molecule) T cells displayed different gene expression patterns. Although 72% of the pattern was shared between the alloantigen- and CD3/28-activated T cells, a significant number of these (11.5% and 16.5% of the genes) were uniquely regulated in either Allo T or CD3/28 T cells, respectively, which implies that the activation of T cells by mismatched MHC and alloantigens, as well as costimulatory molecules, may contribute to the specific and distinct miRNA and the corresponding mRNA/protein profiles rather than to the nonspecific and non-MHC–activated (stimulated by CD3/28) T cells. This finding is in agreement with the 2-signal model for the ligation of the TCR with the CD3 complex, which states that T cell activation involves the formation of an MHC/antigen/peptide complex and the engagement of the CD28/CTLA4/B7 family (50, 51). The fact that different T cell responses were observed in response to alloantigen and CD3/28 stimulation also suggests the existence of different molecular landscapes in T cells that respond to alloantigens and those that respond to nominal or non-alloantigens.
We hypothesized that the downregulated miRNAs do not repress the expression of their target genes as part of the immune response program and that the released gene will thus produce proteins at functional levels and regulate cell activity. We observed that miRNAs are differentially regulated in Allo T and CD3/28 T cells and that their target gene profiles were different. As shown in the CLIP miRNA microarray, the enriched miRNAs were categorized into four groups depending on their differential regulatory patterns. Groups 1 and 4 were similarly regulated in both Allo T and CD3/28 T cells (either increased or reduced in both cell types). Groups 2 and 3 were differentially regulated in Allo T and CD3/28 T cells: the group 2 miRNAs were uniquely increased, and the group 3 miRNAs were uniquely reduced in Allo T cells. The changes in miRNA enrichment after CLIP were related to miRNA expression levels in the whole cells, suggesting that the enriched miRNAs in RISCs depend on their cellular levels, which are regulated by the cellular response to different stimulations. We also observed that many of the transcripts of the genes that were uniquely reduced (Table 1) or increased (Supplemental Table 2) in Allo T cells were targeted by multiple miRNAs and that a single miRNA targets multiple transcripts (Table 4 and Supplemental Table 5). In addition, the targeted transcripts were classified by GO analyses as participating in several biological processes, including immune response, the cell division cycle, and spindle assembly (Table 3). This finding suggests that an miRNA-mediated network functions in the specific regulation of Allo T cell activation. Of the 50 predicted transcripts that were obtained by the AGO CLIP-ChIP protocol, 48 were confirmed by GSEA analysis. Of these, eight transcripts were most significantly enriched, including Wapal, Synj1, and Lpp (Figure 3). More importantly, the specific expression patterns of these three genes in Allo T cells were confirmed by in vivo allogeneic BMT experiments.
Our analyses uncovered a previously unknown role for two proteins, WAPAL and SYNJ1, in the regulation of T cell responses. WAPAL regulates sister chromatid resolution by controlling the association of cohesin and chromatin (34). It is associated with cohesin throughout the cell cycle and has been implicated in heterochromatin formation. However, the effects of WAPAL on T cell responses have not heretofore been recognized. Synaptojanin 1 (SYNJ1) is critical for development (30, 31). Its role in immune responses has neither been anticipated nor reported. The transcripts of these proteins are combinatorially targeted by group 3 miRNAs. The CLIP-ChIP and GSEA analyses revealed that the transcripts of these proteins were significantly reduced in Allo T cells. In addition, the mRNA and protein levels of WAPAL and SYNJ1 in the whole-cell lysates were higher in Allo T cells than in CD3/28 T cells, as determined by in vitro experiments and in vivo allogeneic BMT experiments. These data clearly demonstrate that the increased expression of the Wapal and Synj1 targets is due to the release of their repression by the miRNAs. The specific miRNA targeting these novel regulators will need to be determined in future studies. Nonetheless, knockdown studies confirmed the functional relevance of Wapal and Synj1 in modulating the Allo T cell proliferative and cytokine responses. Our observations were made in MHC-disparate alloantigen stimulation in polyclonal mixed T cells that were responding in the presence of potentially multiple costimulatory and coinhibitory molecular engagements. Wapal and Synj1 expression was also enhanced when T cells responded to a specific nominal antigen (OVA) in the presence of multiple costimulatory and coinhibitory molecules, but to a markedly lesser extent. These data suggest that the differential expression of Wapal and Synj1 is likely independent of the engagement of various costimulatory molecules. However, our data are limited by the lack of analyses in single alloantigen–specific T cells and do not address the questions of antigen density and avidity. A detailed analysis of the reasons for the differential expression and functional effects of Wapal and Synj1 in single alloantigen–specific responses will be performed in future studies. In addition, it is also possible that several of the other differentially expressed miRs and their putative targets are relevant as well, a question that will have to be addressed in later studies.
In vivo Synj1 regulates clathrin-mediated endocytosis and modulates neuronal and renal functions (31, 52). It has been associated with the development of neuronal diseases in mice and humans (30, 53). Its role and expression in T cells has heretofore not been reported. Nonetheless, Synj1 is activated by calcium influx and calcineurin, leading to its binding with endophili and thus facilitating clathrin-mediated endocytosis (30, 31, 52, 54). Furthermore, although Synj1 expression in T cells has not been analyzed, the calcineurin pathway is critical for T cell responses, while clathrin-mediated endocytosis also plays an important role in TCR and CTLA-4 endocytosis following T cell activation (55, 56). It is therefore possible that upon alloantigenic stimulation, a calcineurin-dependent process leads to an increased expression and activation of Synj1 that modulates T cell responses via TCR/CTLA-4 endocytosis. Such a process may be dependent on the context of costimulatory molecule engagement and the avidity of MHC-disparate T cell stimulation. It is also interesting to speculate whether Synj1, which plays a key role in regulating neural synaptic transmission, might also play an important role in the regulation of immunological synapses under certain conditions. The role and mechanisms of Synj1 in T cell responses to MHC-disparate allostimulus and other cognate antigens will be explored in future studies.
WAPAL is a key component of the cohesin complex that regulates the formation of sister chromatids (57). Specifically, replacing WAPAL with soronin from the WAPAL/PDS5 complex leads to sister chromatid cohesion in the S phase (32, 33). However, upon entry into mitosis, soronin is replaced by WAPAL, leading to a loss of cohesion and entry of the cell beyond the prophase of mitosis (32, 33, 57). Thus, WAPAL is required for the cells to progress into mitosis. Although a specific role for WAPAL has not been demonstrated in T cell mitosis, given its fundamental and evolutionarily conserved role in facilitating mitosis, an increase in WAPAL itself may not be a specific consequence of alloantigen stimulation of T cells, but may instead be a reflection of the cell cycling and proliferation induced by the strength and avidity of TCR stimulation. Given the increased expression of Synj1 and Wapal, it is possible that Synj1-dependent mechanisms might lead to increased Wapal expression and T cell mitosis following allogeneic stimulation. The dependence of T cell proliferation on these two molecules following MHC-disparate stimulation may be more a consequence of the context, avidity, and strength of TCR stimulation. Indeed, it appears that these molecules might play a less important role in the responses of T cells to less avid stimulation, such as by the minor alloantigens (data not shown). Nonetheless, the regulation of Synj1 and Wapl expression following T cell stimulation, specifically in the context of MHC-disparate allostimulation, and whether they are functionally related to each other, remains to be explored.
Our comprehensive analyses of the molecular landscape of T cell responses to biologically relevant allostimulation thus provide what we believe to be novel insights into T cell biology. They have uncovered previously unknown molecular regulators of T cell immunity, Wapl and Synj1. Targeting these molecules could potentially have tangible and specific clinical benefit in patients who have undergone MHC-disparate allogeneic BMT and also be germane to solid organ allotransplantation.
Methods
Mice.
Female C57BL/6 (B6, H-2b, CD45.2+) and BALB/c (H-2d) mice were purchased from The Jackson Laboratory. B6 Ly5.2 (H-2b, CD45.1+) mice were purchased from the NCI’s Frederick Cancer Research Facility. RAG2/OT-II (CD45.2) mice were purchased from Taconic.
DCs and T cells.
To obtain murine DCs, BM cells from C57BL/6 or BALB/c mice were cultured with murine GM-CSF (10 ng/ml; BD PharMingen) and IL-4 (10 ng/ml; PeproTech) for 7 days and harvested as described previously (36). The DCs were harvested and positively selected using an autoMACS Pro Separator (Miltenyi Biotec) to obtain CD11c+ cells of 95% purity. To obtain murine T cells without affecting the cell-surface proteins through antibody cross-linking, the spleens of C57BL/6 or RAG2/OT-II and BALB/c mice were removed, and the highly pure T cells (>95% purity) were negatively isolated by the depletion of the magnetically labeled nontarget cells from splenocytes using the Pan T Cell Isolation Kit II (Miltenyi Biotec).
Mixed T cell culture and T cell purification.
Mixed cell culture was prepared by incubating a 1-ml culture of 2 × 10⁶ T cells with syngeneic C57BL/6 DCs (at a ratio of 20:1), allogeneic BALB/c DCs (at a ratio of 20:1), or 0.1 μg/ml anti-CD3e and anti-CD28 mAB9 (BD Biosciences) for 24 hours. All cells were collected and incubated with CD11c microbeads for 30 minutes. The T cells were then isolated by magnetic negative selection (autoMACS Pro Separator; Pan T Cell Isolation Kit II) (36). For OT-II CD4+ T cell stimulation with OVA, C57BL/6 DCs were pulsed with or without OVA323-339 (10 μg/ml) for 16 hours, then cocultured for 5 days with T cells purified from spleens of B6 RAG2/OT-II or WT C57BL/6 mice (at a ratio of 20:1). The T cells were then isolated by magnetic negative selection using the autoMACS Pro Separator and the Pan T Cell Isolation Kit II and processed for RNA isolation, reverse transcription, and qPCR.
CLIP and RNA isolation.
Purified T cells were rinsed once with PBS. The cells were then added to 10 ml PBS/plate (100 mm) and exposed to 400 mJ/cm2 UVA light, followed by an additional 200 ml/cm2 from a UVAR light set (Therakos). The light set was calibrated periodically using a UVX meter fitted with a UVA detector (UVP; Therakos). The cells were collected, washed twice with PBS, and then lysed on ice for 20 minutes with lysis buffer (25 mM Tris-HCl, pH 8.0, 150 mM NaCl, 2 mM MgCl2, 0.5% NP-40, and mM DTT) and a freshly added protease inhibitor cocktail (Pierce), 1 mM PMSF, and 250 U/ml RNasin (Promega). The lysates were then centrifuged at 10,000 g at 4°C for 10 minutes, and the supernatants were subjected to preclearance by a 60-minute incubation at 4°C with preblocked protein A agarose beads, which were prepared by incubating protein A agarose with salmon sperm DNA (100 μg/ml) and BSA (10 mg/ml) overnight at 4°C. A volume of 400 μl of the protein A agarose beads was added to each tube of cross-linked lysate. Prior to their addition to the lysate, the beads were washed three times with 0.1 M Na phosphate, pH 8.0, prior to the addition of 50 μl of bridge Ab [2.4 mg/ml; donkey anti-rabbit IgG F(c); Abnova]. The tubes were then rotated at room temperature for 60 minutes and washed three times with 0.1 M Na phosphate, pH 8.0. The beads were resuspended in 400 μl 0.1 M Na phosphate, pH 8.0, prior to the addition of 10 μl of argonaute 2 rabbit mAb (Cell Signaling Technology). The tubes were rotated at 4°C for 5 hours and washed three times with lysis buffer. The cross-linked and precleared lysate was added to one prepared tube of beads, and the bead/lysate mix was rotated for 4 hours at 4°C. The beads were then washed twice with lysis buffer, three times with lysis buffer containing 900 mM NaCl and 1% NP-40, twice with lysis buffer, and once with lysis buffer containing 0.05% NP-40. After washing, the beads were subjected to DNase treatment by incubation with 250 μl of a DNA digestion solution containing 40 mM Tris-HCl, pH 8.0, 10 mM MgSO4, 1 mM CaCl2, 200 U/ml RNasin, and 0.04 U/ml DNase I (Promega) at 38°C for 20 minutes, with gentle shaking every 5 minutes. The RNAs caught by CLIP were extracted with either TRIzol LS (Invitrogen), which permits the isolation of total RNA, or an miRNeasy kit (QIAGEN), which is designed for the purification of total RNA, including miRNA and other small RNA molecules.
Affymetrix microarrays and analyses.
The total cellular RNA (tcRNA) was extracted with TRIzol LS reagent from the CLIP agarose beads and cleaned with RNeasy columns (QIAGEN). After the quality of the total RNA was verified by an Agilent 2100 Bioanalyzer, the samples were processed using the WT-Ovation Pico System (Affymetrix), which requires only 500 pg of total RNA and a single round of amplification for samples with even stricter concentration restraints. This system incorporates oligo(dT) and random primers for amplification at the 3′ end and throughout the whole transcriptome. Affymetrix mouse genome 430 2.0 arrays (Affymetrix), which contain 45,000 transcripts for annotated genes and expressed sequence tags, were used. The stained arrays were scanned on an Agilent Gene Array Scanner (Affymetrix) with a 560-nm filter. The data were published and analyzed using the R statistical environment ( http://cran.r-project.org/) provided by Bioconductor ( http://www.bioconductor.org/). The expression values were calculated for each gene using an RMA (20, 21). This modeling strategy converts the PM probe values into an expression value (log2 transformed) for each gene. The probe sets with a fold change of 2 or greater were selected (an expression value of 26 or greater was used for one of the two samples to prevent the selection of large fold changes based on two small numbers). The number of probe sets that were uniquely and commonly detected in Allo T and CD3/28 T cells in comparison with Syn T cells was analyzed. The microarray data were deposited in the Gene Expression Omnibus (GEO) database (GSE43636).
Exiqon miRNA microarrays and analyses.
Total RNA, including miRNAs and other small RNA molecules, was purified from CLIP agarose beads using the miRNeasy Mini Kit (QIAGEN). After the quality of the total RNA was verified by an Agilent 2100 Bioanalyzer, miRNA microarray experiments were conducted using a single channel for Hy5 on the Exiqon sixth-generation miRCURY LNA miRNA array; these experiments were performed in duplicate. The RNAs and the spike-in miRNAs were treated with calf intestinal alkaline phosphatase (CIP) and then labeled using the Exiqon miRCURY LNA microRNA Array Power Labeling Kit. The denatured, labeled samples were hybridized to miRNA array slides at 56°C for 16 hours using an Agilent Hybridization SureHyb chamber and gasket slide. The samples were then subjected to a stringent wash protocol. The slides were scanned with a GenePix 4000 microarray scanner (Molecular Devices). The images were captured and analyzed by GAL-file (Exiqon Inc.), which included 1,032 miRNA IDs that had been annotated by miRBase, version 16.0 ( http://microrna.sanger.ac.uk). The median of the spot signals after the subtraction of the relative background signals was used as the expression value. The expression levels were calculated using the signals that were above the background level. A probe was retained if the signals in at least half of the samples in at least one condition were 2.5 times above the background signal. The microarray data were deposited in the GEO database (GSE43636).
miRNA prediction tools and estimates of improvements in the true positive rates.
We integrated the output results of two major prediction programs: TargetScan ( http://www.targetscan.org/) and miRanda ( http://www.microrna.org/microrna/). TargetScan predicts targets based strictly on evolutionary conservation and is one of the most frequently used prediction tools. The miRanda algorithm computes the optimal sequence complementarity between a set of mature miRNAs and a given mRNA using a weighted dynamic programming algorithm. We integrated the outputs from both target prediction programs. According to the principle of posttranslational gene expression regulation, miRNAs guide the miRNPs, of which the AGO proteins are central components, to form miRNA/target mRNA/AGO ternary complexes (15); consequently, we can obtain the proportion of miRNA/target mRNA complexes after AGO-CLIP. To estimate the improvement in the false-positive rates as a result of the CLIP-ChIP protocol, we calculated the prediction frequencies of the potential mRNA targets in Allo T cells that were reduced (or increased) by miRNAs that were simultaneously uniquely reduced (or uniquely increased) in Allo T cells. In addition, miRNAs that were not enriched by the CLIP protocol for the same presumed targets (11) were used as controls.
PCR.
miRNA and mRNA real-time qPCR assays were performed as previously described (25). For miRNA qPCR, total RNA, including small RNAs, was isolated from Allo T, Syn T, and CD3/28 T cells before or after CLIP using the miRNeasy Mini Kit (QIAGEN). Reverse transcription was performed by incubating a mixture of 10 ng RNA, 0.15 μl of 100 mM deoxynucleotide triphosphatases (dNTPs), 1.00 μl MultiScribe Reverse Transcriptase (50 U/μl; Invitrogen), 1.50 μl 10X RT buffer, 0.188 μl RNase inhibitor (20 U/μl), 4.192 μl nuclease-free water, and 3 μl 5X-specific RT primers for miR142-3p, miR-142-5p, miR-16, miR-29a, miR-669i, miR-669d, and snoRNA135 (as an internal control) (all from Applied Biosystems) at 16°C for 30 minutes, 42°C for 30 minutes, and 85°C for 5 minutes. qPCR was performed on an Eppendorf Realplex2 system, which was set to the following program: 95°C for 10 minutes followed by 40 cycles of 95°C for 15 seconds and 60°C for 60 seconds. Each PCR reaction mix contained 10 μl of TaqMan 2X Universal PCR Master Mix (no AmpErase UNG), 7.67 μl nuclease-free water, 1.33 μl RT product, and 1 μl 20X-specific PCR primers for miR142-3p, miR-142-5p, miR-16, miR-29a, miR-669i, miR-669d, and snoRNA135 (all from Applied Biosystems). All of the samples were tested in triplicate. snoRNA-135 was used to normalize the expression levels of the target miRNAs by correcting the differences in the amount of RNA loaded into the qPCR reactions. The threshold levels for each experiment were set during the exponential phase of the reaction. For mRNA qPCR, the total RNA was isolated from Allo T, Syn T, and CD3/28 T cells before or after CLIP using TRIzol reagent (Invitrogen). Briefly, 2 μg of total RNA was reverse transcribed into cDNA using SuperScript III (Invitrogen) in the presence of random hexamers (Invitrogen). All of the reactions were performed in triplicate with SYBR Green Master Mix (Applied Biosystems) and 25 ng of both forward and reverse primers, according to the manufacturer’s recommended thermocycling conditions, and were then subjected to melt curve analysis. The threshold levels for each experiment were set during the exponential phase of the reaction. The DNA in each sample was quantified by interpolation of its threshold cycle (Ct) value from a standard curve of Ct values. The calculated quantity of the target gene for each sample was divided by the average sample quantity of the housekeeping gene glyceraldehyde-3-phosphate dehydrogenase (GAPDH) to obtain the relative gene expression. All of the oligonucleotide primers were synthesized by Integrated DNA Technologies. The primer sequences are provided in Supplemental Table 10.
Immunoblot analyses.
Cell lysates were prepared from Allo T, Syn T, and CD3/28 T cells and combined with a proteinase inhibitor mixture (Roche). A 50-μg quantity of each protein extract was boiled in sample buffer, separated by SDS-PAGE, and transferred onto a PVDF membrane (GE Healthcare). The membrane was incubated for 30 minutes with 5% nonfat dry milk and then incubated overnight at 4°C with the following antibodies: anti-WAPAL rabbit polyclonal antibody (1:500 in 5% nonfat milk; Proteintech Group, Inc.), anti-LPP mouse monoclonal antibody (1:500 in 5% nonfat milk; Cell Signaling Technology), anti-SYNJ1 mouse monoclonal antibody (1:250; Acris Antibodies, Inc.), and anti-actin mouse monoclonal antibody (1:1,000; Abcam). After washing with TBS-T, the blot was incubated with an HRP secondary antibody. The signals were visualized by enhanced chemiluminescence (Thermo Scientific).
BMT and in vivo OT-II T cell responses.
The BMTs were performed as previously described (36). Briefly, the recipient B6 Ly5.1 BALB/c mice received 1,000 cGy of total body irradiation on day –1. Splenic T cells (4 × 10⁶) and BM cells (5 × 10⁶) from B6 Ly5.2 mice were i.v. injected into the recipients on day 0. The donor T cells were isolated from the recipient spleens on day 14. The T cells were isolated from individual or pooled spleen cell suspensions by negative selection (Pan T cell Isolation Kit II; Miltenyi Biotec). The cells were then incubated with biotinylated anti-CD45.1 and subjected to positive selection with anti-biotin microbeads (Miltenyi Biotec) (58). The RNA from purified donor T cells from syngeneic or allogeneic BMTs and naive B6 mice were isolated and analyzed by qPCR. To test whether Synj1 and Wapal expression would be regulated in OVA-specific TCR transgenic T cells, 1 million OT-II T cells were seeded into naive B6 (ly5.2, CD45.1) mice 24 hours before s.c. injection of OVA323-339 (300 μg in PBS). After 7 days, the expanded T cells were isolated by negative selection, and OT-II T cells were purified by FACS sorting after staining with CD90 and CD45.2 antibodies. The T cells were processed for RNA isolation, reverse transcription, and qPCR. To examine the functional role of SYNJ1 and WAPAL in acute GVHD after allogeneic BMT, the recipient B6 and BALB/c mice received 800 cGy of total body irradiation on day –1. Donor T cells were purified from B6 splenocytes that were infected with lentiviral particles carrying WAPAL shRNA, SYNJ1 shRNA, or nontargeting shRNA for 3 days by negative selection. T cells (2 × 10⁶ for B6 mice and 1 × 10⁶ for BALB/c mice) and BM cells (5 × 10⁶) from B6 mice were i.v. injected into the recipients on day 0. Survival was monitored daily and GVHD clinical scores were measured weekly.
Lentiviral infection, MLR, and ELISA.
Lentiviral transduction particles containing either shRNA specific for WAPAL (NM_001004436.3) or SYNJ1 (NM_001045515.1) or nontargeting shRNA were obtained from Santa Cruz Biotechnology, Inc. Splenocytes were cultured in complete medium for 24 hours. The medium was then replaced with complete medium supplemented with Polybrene (Sigma-Aldrich) at a final concentration of 5 μg/ml, and the cells were infected with lentiviral particles carrying WAPAL shRNA, SYNJ1 shRNA, or nontargeting shRNA for 3 days. T cells were isolated by negative selection (Pan T cell Isolation Kit II; Miltenyi Biotec), and their RNA was isolated. The knockdown efficiency was examined by SYBR Green qPCR using specific primers for WAPAL, SYNJ1, PCAF, and GAPDH (the sequences are provided in Supplemental Table 10). After infection with WAPAL shRNA, SYNJ1 shRNA, or nontargeting shRNA for 3 days, the purified B6 T cells (2 × 10⁵) were cultured with B6- or BALB/c BM–derived DCs (5 × 10³) for 94 hours. The supernatants were collected after 80 hours to measure cytokines. The incorporation of 3H-thymidine (1 μCi/well) by the proliferating T cells during the final 16 hours of culture was measured with a Betaplate reader (Wallad). The concentrations of IL-6, IL-2, IFN-γ, IL-17, and TGF-β in the culture supernatants were measured by ELISA with specific anti-mouse mAbs for their capture and detection, and the appropriate standards were purchased from BD Biosciences and BD Pharmingen. B6 T cells were also treated with 0.1 μg/ml anti-CD3e and anti-CD28 mAB9 (BD Biosciences) for 48 hours and incorporation of 3H-thymidine (1 μCi/well) by the proliferating T cells during the final 6 hours of culture was measured. The assays were performed according to the manufacturer’s protocols and read at 450 nm with a Bio-Rad microplate reader.
Statistics.
All gene expression and relative quantification data were analyzed on a log (base 2) scale. Comparisons of the gene expression values across the sample classes were performed using the paired, two-sample Student’s t test. Survival curves were plotted using Kaplan-Meier estimates. The Mann-Whitney U test was used for the statistical analysis of clinical scores, while the Mantel-Cox log-rank test was used to analyze survival data. A P value less than 0.05 was considered statistically significant.
Study approval.
All animals were cared for under regulations reviewed and approved by the University Committee on Use and Care of Animals of the University of Michigan, based on University Laboratory Animal Medicine guidelines.
Supplementary Material
Acknowledgments
We thank M. Iyer (Bioinformatics Program, Howard Hughes Medical Institute, University of Michigan Medical School) for microarray equipment support during the miRNA microarray experiments and data analyses. We also acknowledge the Affymetrix and Microarray Core for technical support and data analyses. This work was supported by NIH grants AI-075284, CA173878, and HL-090775 (to P. Reddy). P. Reddy is a recipient of the Scholar in Clinical Research award from the Leukemia Lymphoma Society and the Basic Science Investigator Award from the American Society of Transplantation.
Footnotes
Conflict of interest: The authors have declared that no conflict of interest exists.
Citation for this article: J Clin Invest. 2013;123(11):4739–4754. doi:10.1172/JCI70013.
References
- 1.O’Connell RM, Rao DS, Baltimore D. microRNA regulation of inflammatory responses. Annu Rev Immunol. 2012;30:295–312. doi: 10.1146/annurev-immunol-020711-075013. [DOI] [PubMed] [Google Scholar]
- 2.Harris A, Krams SM, Martinez OM. MicroRNAs as immune regulators: implications for transplantation. Am J Transplant. 2010;10(4):713–719. doi: 10.1111/j.1600-6143.2010.03032.x. [DOI] [PMC free article] [PubMed] [Google Scholar]
- 3.Wu H, et al. miRNA profiling of naive, effector and memory CD8 T cells. PLoS One. 2007;2(10):e1020. doi: 10.1371/journal.pone.0001020. [DOI] [PMC free article] [PubMed] [Google Scholar]
- 4.Grigoryev YA, et al. MicroRNA regulation of molecular networks mapped by global microRNA, mRNA, and protein expression in activated T lymphocytes. J Immunol. 2011;187(5):2233–2243. doi: 10.4049/jimmunol.1101233. [DOI] [PMC free article] [PubMed] [Google Scholar]
- 5.Schietinger A, Delrow JJ, Basom RS, Blattman JN, Greenberg PD. Rescued tolerant CD8 T cells are preprogrammed to reestablish the tolerant state. Science. 2012;335(6069):723–727. doi: 10.1126/science.1214277. [DOI] [PMC free article] [PubMed] [Google Scholar]
- 6.Bronevetsky Y, et al. T cell activation induces proteasomal degradation of Argonaute and rapid remodeling of the microRNA repertoire. J Exp Med. 2013;210(2):417–432. doi: 10.1084/jem.20111717. [DOI] [PMC free article] [PubMed] [Google Scholar]
- 7.Bartel DP. MicroRNAs: target recognition and regulatory functions. Cell. 2009;136(2):215–233. doi: 10.1016/j.cell.2009.01.002. [DOI] [PMC free article] [PubMed] [Google Scholar]
- 8.Wang KC, Chang HY. Molecular mechanisms of long noncoding RNAs. Mol Cell. 2011;43(6):904–914. doi: 10.1016/j.molcel.2011.08.018. [DOI] [PMC free article] [PubMed] [Google Scholar]
- 9.Krek A, et al. Combinatorial microRNA target predictions. Nat Genet. 2005;37(5):495–500. doi: 10.1038/ng1536. [DOI] [PubMed] [Google Scholar]
- 10.Rajewsky N. microRNA target predictions in animals. Nat Genet. 2006;38(suppl):S8–S13. doi: 10.1038/ng1798. [DOI] [PubMed] [Google Scholar]
- 11.Chi SW, Zang JB, Mele A, Darnell RB. Argonaute HITS-CLIP decodes microRNA-mRNA interaction maps. Nature. 2009;460(7254):479–486. doi: 10.1038/nature08170. [DOI] [PMC free article] [PubMed] [Google Scholar]
- 12.Darnell RB. HITS-CLIP: panoramic views of protein-RNA regulation in living cells. Wiley Interdiscip Rev RNA. 2010;1(2):266–286. doi: 10.1002/wrna.31. [DOI] [PMC free article] [PubMed] [Google Scholar]
- 13.Licatalosi DD, Darnell RB. RNA processing and its regulation: global insights into biological networks. Nat Rev Genet. 2010;11(1):75–87. doi: 10.1038/nrg2673. [DOI] [PMC free article] [PubMed] [Google Scholar]
- 14.Keene JD, Komisarow JM, Friedersdorf MB. RIP-Chip: the isolation and identification of mRNAs, microRNAs and protein components of ribonucleoprotein complexes from cell extracts. Nat Protoc. 2006;1(1):302–307. doi: 10.1038/nprot.2006.47. [DOI] [PubMed] [Google Scholar]
- 15.Wang WX, Wilfred BR, Hu Y, Stromberg AJ, Nelson PT. Anti-Argonaute RIP-Chip shows that miRNA transfections alter global patterns of mRNA recruitment to microribonucleoprotein complexes. RNA. 2010;16(2):394–404. doi: 10.1261/rna.1905910. [DOI] [PMC free article] [PubMed] [Google Scholar]
- 16.Blazar BR, Murphy WJ, Abedi M. Advances in graft-versus-host disease biology and therapy. Nat Rev Immunol. 2012;12(6):443–458. doi: 10.1038/nri3212. [DOI] [PMC free article] [PubMed] [Google Scholar]
- 17.Paczesny S, Hanauer D, Sun Y, Reddy P. New perspectives on the biology of acute GVHD. Bone Marrow Transplant. 2010;45(1):1–11. doi: 10.1038/bmt.2009.328. [DOI] [PMC free article] [PubMed] [Google Scholar]
- 18.Ule J, et al. An RNA map predicting Nova-dependent splicing regulation. Nature. 2006;444(7119):580–586. doi: 10.1038/nature05304. [DOI] [PubMed] [Google Scholar]
- 19.Konig J, et al. iCLIP — transcriptome-wide mapping of protein-RNA interactions with individual nucleotide resolution. J Vis Exp. 2011;(50):pii:2638. doi: 10.3791/2638. [DOI] [PMC free article] [PubMed] [Google Scholar]
- 20.Irizarry RA, et al. Exploration, normalization, and summaries of high density oligonucleotide array probe level data. Biostatistics. 2003;4(2):249–264. doi: 10.1093/biostatistics/4.2.249. [DOI] [PubMed] [Google Scholar]
- 21.Mathew JP, et al. From bytes to bedside: data integration and computational biology for translational cancer research. PLoS Comput Biol. 2007;3(2):e12. doi: 10.1371/journal.pcbi.0030012. [DOI] [PMC free article] [PubMed] [Google Scholar]
- 22.Grigoryev YA, et al. Genome-wide analysis of immune activation in human T and B cells reveals distinct classes of alternatively spliced genes. PLoS One. 2009;4(11):e7906. doi: 10.1371/journal.pone.0007906. [DOI] [PMC free article] [PubMed] [Google Scholar]
- 23.Balaga O, Friedman Y, Linial M. Toward a combinatorial nature of microRNA regulation in human cells. Nucleic Acids Res. 2012;40(19):9404–9416. doi: 10.1093/nar/gks759. [DOI] [PMC free article] [PubMed] [Google Scholar]
- 24.Subramanian A, et al. Gene set enrichment analysis: a knowledge-based approach for interpreting genome-wide expression profiles. Proc Natl Acad Sci U S A. 2005;102(43):15545–15550. doi: 10.1073/pnas.0506580102. [DOI] [PMC free article] [PubMed] [Google Scholar]
- 25.Sun Y, et al. Targeting of microRNA-142-3p in dendritic cells regulates endotoxin-induced mortality. Blood. 2011;117(23):6172–6183. doi: 10.1182/blood-2010-12-325647. [DOI] [PMC free article] [PubMed] [Google Scholar]
- 26.Schmitt MJ, Margue C, Behrmann I, Kreis S. MiRNA-29: a microRNA family with tumor-suppressing and immune-modulating properties. Curr Mol Med. 2012;13(4):572–585. doi: 10.2174/1566524011313040009. [DOI] [PubMed] [Google Scholar]
- 27.Huang B, et al. miR-142-3p restricts cAMP production in CD4+CD25– T cells and CD4+CD25+ TREG cells by targeting AC9 mRNA. . EMBO Rep. 2009;10(2):180–185. doi: 10.1038/embor.2008.224. [DOI] [PMC free article] [PubMed] [Google Scholar]
- 28.Petit MM, et al. LPP, an actin cytoskeleton protein related to zyxin, harbors a nuclear export signal and transcriptional activation capacity. Mol Biol Cell. 2000;11(1):117–129. doi: 10.1091/mbc.11.1.117. [DOI] [PMC free article] [PubMed] [Google Scholar]
- 29.Vervenne HB, Crombez KR, Delvaux EL, Janssens V, Van de Ven WJ, Petit MM. Targeted disruption of the mouse Lipoma Preferred Partner gene. Biochem Biophys Res Commun. 2009;379(2):368–373. doi: 10.1016/j.bbrc.2008.12.074. [DOI] [PubMed] [Google Scholar]
- 30.Voronov SV, et al. Synaptojanin 1-linked phosphoinositide dyshomeostasis and cognitive deficits in mouse models of Down’s syndrome. Proc Natl Acad Sci U S A. 2008;105(27):9415–9420. doi: 10.1073/pnas.0803756105. [DOI] [PMC free article] [PubMed] [Google Scholar]
- 31.Chang-Ileto B, Frere SG, Chan RB, Voronov SV, Roux A, Di Paolo G. Synaptojanin 1-mediated PI(4,5)P2 hydrolysis is modulated by membrane curvature and facilitates membrane fission. Dev Cell. 2011;20(2):206–218. doi: 10.1016/j.devcel.2010.12.008. [DOI] [PMC free article] [PubMed] [Google Scholar]
- 32.Nishiyama T, et al. Sororin mediates sister chromatid cohesion by antagonizing Wapl. Cell. 2010;143(5):737–749. doi: 10.1016/j.cell.2010.10.031. [DOI] [PubMed] [Google Scholar]
- 33.Gandhi R, Gillespie PJ, Hirano T. Human Wapl is a cohesin-binding protein that promotes sister-chromatid resolution in mitotic prophase. Curr Biol. 2006;16(24):2406–2417. doi: 10.1016/j.cub.2006.10.061. [DOI] [PMC free article] [PubMed] [Google Scholar]
- 34.Kueng S, et al. Wapl controls the dynamic association of cohesin with chromatin. Cell. 2006;127(5):955–967. doi: 10.1016/j.cell.2006.09.040. [DOI] [PubMed] [Google Scholar]
- 35.Reddy P, Negrin R, Hill GR. Mouse models of bone marrow transplantation. Biol Blood Marrow Transpl. 2008;14(1 suppl 1):129–135. doi: 10.1016/j.bbmt.2007.10.021. [DOI] [PMC free article] [PubMed] [Google Scholar]
- 36.Reddy P, et al. Histone deacetylase inhibition modulates indoleamine 2,3-dioxygenase-dependent DC functions and regulates experimental graft-versus-host disease in mice. J Clin Invest. 2008;118(7):2562–2573. doi: 10.1172/JCI34712. [DOI] [PMC free article] [PubMed] [Google Scholar]
- 37.Carter CJ. Multiple genes and factors associated with bipolar disorder converge on growth factor and stress activated kinase pathways controlling translation initiation: implications for oligodendrocyte viability. Neurochem Int. 2007;50(3):461–490. doi: 10.1016/j.neuint.2006.11.009. [DOI] [PubMed] [Google Scholar]
- 38.McPherson PS, et al. A presynaptic inositol-5-phosphatase. Nature. 1996;379(6563):353–357. doi: 10.1038/379353a0. [DOI] [PubMed] [Google Scholar]
- 39.Wen J, Parker BJ, Jacobsen A, Krogh A. MicroRNA transfection and AGO-bound CLIP-seq data sets reveal distinct determinants of miRNA action. RNA. 2011;17(5):820–834. doi: 10.1261/rna.2387911. [DOI] [PMC free article] [PubMed] [Google Scholar]
- 40.Daughters RS, et al. RNA gain-of-function in spinocerebellar ataxia type 8. PLoS Genet. 2009;5(8):e1000600. doi: 10.1371/journal.pgen.1000600. [DOI] [PMC free article] [PubMed] [Google Scholar]
- 41.Guil S, Caceres JF. The multifunctional RNA-binding protein hnRNP A1 is required for processing of miR-18a. Nat Struct Mol Biol. 2007;14(7):591–596. doi: 10.1038/nsmb1250. [DOI] [PubMed] [Google Scholar]
- 42.Konig J, et al. iCLIP reveals the function of hnRNP particles in splicing at individual nucleotide resolution. Nat Struct Mol Biol. 2010;17(7):909–915. doi: 10.1038/nsmb.1838. [DOI] [PMC free article] [PubMed] [Google Scholar]
- 43.Zisoulis DG, et al. Comprehensive discovery of endogenous Argonaute binding sites in Caenorhabditis elegans. . Nat Struct Mol Biol. 2010;17(2):173–179. doi: 10.1038/nsmb.1745. [DOI] [PMC free article] [PubMed] [Google Scholar]
- 44.Xue Y, et al. Genome-wide analysis of PTB-RNA interactions reveals a strategy used by the general splicing repressor to modulate exon inclusion or skipping. Mol Cell. 2009;36(6):996–1006. doi: 10.1016/j.molcel.2009.12.003. [DOI] [PMC free article] [PubMed] [Google Scholar]
- 45.Grimson A, Farh KK, Johnston WK, Garrett-Engele P, Lim LP, Bartel DP. MicroRNA targeting specificity in mammals: determinants beyond seed pairing. Mol Cell. 2007;27(1):91–105. doi: 10.1016/j.molcel.2007.06.017. [DOI] [PMC free article] [PubMed] [Google Scholar]
- 46.Licatalosi DD, et al. HITS-CLIP yields genome-wide insights into brain alternative RNA processing. Nature. 2008;456(7221):464–469. doi: 10.1038/nature07488. [DOI] [PMC free article] [PubMed] [Google Scholar]
- 47.Forman JJ, Legesse-Miller A, Coller HA. A search for conserved sequences in coding regions reveals that the let-7 microRNA targets Dicer within its coding sequence. Proc Natl Acad Sci U S A. 2008;105(39):14879–14884. doi: 10.1073/pnas.0803230105. [DOI] [PMC free article] [PubMed] [Google Scholar]
- 48.Ule J, Jensen KB, Ruggiu M, Mele A, Ule A, Darnell RB. CLIP identifies Nova-regulated RNA networks in the brain. Science. 2003;302(5648):1212–1215. doi: 10.1126/science.1090095. [DOI] [PubMed] [Google Scholar]
- 49.Hao S, Baltimore D. The stability of mRNA influences the temporal order of the induction of genes encoding inflammatory molecules. Nat Immunol. 2009;10(3):281–288. doi: 10.1038/ni.1699. [DOI] [PMC free article] [PubMed] [Google Scholar]
- 50.Chambers CA. The expanding world of co-stimulation: the two-signal model revisited. Trends Immunol. 2001;22(4):217–223. doi: 10.1016/S1471-4906(01)01868-3. [DOI] [PubMed] [Google Scholar]
- 51.Chen L, Flies DB. Molecular mechanisms of T cell co-stimulation and co-inhibition. Nat Rev Immunol. 2013;13(4):227–242. doi: 10.1038/nri3405. [DOI] [PMC free article] [PubMed] [Google Scholar]
- 52.Soda K, et al. Role of dynamin, synaptojanin, and endophilin in podocyte foot processes. J Clin Invest. 2012;122(12):4401–4411. doi: 10.1172/JCI65289. [DOI] [PMC free article] [PubMed] [Google Scholar]
- 53.Cossec JC, et al. Trisomy for synaptojanin1 in Down syndrome is functionally linked to the enlargement of early endosomes. Hum Mol Genet. 2012;21(14):3156–3172. doi: 10.1093/hmg/dds142. [DOI] [PMC free article] [PubMed] [Google Scholar]
- 54.Lee SY, Wenk MR, Kim Y, Nairn AC, De Camilli P. Regulation of synaptojanin 1 by cyclin-dependent kinase 5 at synapses. Proc Natl Acad Sci U S A. 2004;101(2):546–551. doi: 10.1073/pnas.0307813100. [DOI] [PMC free article] [PubMed] [Google Scholar]
- 55.Crotzer VL, Mabardy AS, Weiss A, Brodsky FM. T cell receptor engagement leads to phosphorylation of clathrin heavy chain during receptor internalization. J Exp Med. 2004;199(7):981–991. doi: 10.1084/jem.20031105. [DOI] [PMC free article] [PubMed] [Google Scholar]
- 56.Qureshi OS, et al. Constitutive clathrin-mediated endocytosis of CTLA-4 persists during T cell activation. J Biol Chem. 2012;287(12):9429–9440. doi: 10.1074/jbc.M111.304329. [DOI] [PMC free article] [PubMed] [Google Scholar]
- 57.Carretero M, Remeseiro S, Losada A. Cohesin ties up the genome. Curr Opin Cell Biol. 2010;22(6):781–787. doi: 10.1016/j.ceb.2010.07.004. [DOI] [PubMed] [Google Scholar]
- 58.Flutter B, et al. Nonhematopoietic antigen blocks memory programming of alloreactive CD8+ T cells and drives their eventual exhaustion in mouse models of bone marrow transplantation. . J Clin Invest. 2010;120(11):3855–3868. doi: 10.1172/JCI41446. [DOI] [PMC free article] [PubMed] [Google Scholar]
Associated Data
This section collects any data citations, data availability statements, or supplementary materials included in this article.