Abstract
Biologics have become the fastest growing segment in the pharmaceutical industry. As is the case with all proteins, biologics are susceptible to denature or to aggregate; conditions that, if present, preclude their use as pharmaceuticals. Identifying the solvent conditions that maximize their structural stability is crucial during development. Since the structural stability of a protein is susceptible to different chemical and physical conditions, the use of several complementary techniques can be expected to provide the best answers. Stability measurements that rely on temperature or chemical [urea or guanidine hydrochloride (GuHCl)] denaturation have been the preferred ones in research laboratories and together provide a thorough evaluation of protein stability. In this review, we will discuss chemical denaturation as a tool in the optimization of formulation conditions for biologics, and how chemical denaturation complements the role of thermal denaturation for this purpose.
Introduction
The identification of conditions that maximize the structural stability of the native state of proteins is essential for the development of protein therapeutics, protein formulations, process development conditions, quality control as well as basic protein sciences [1–4]. Since protein denaturation often leads to aggregation, improving structural stability is important to retard or prevent the formation of aggregates. There are different ways to measure the structural stability of proteins and they involve disrupting the protein structure by either physical or chemical means. Essentially, the structural stability is proportional to the structural resistance of the protein to the perturbation. Temperature is one of the most widely used physical denaturation tools [5,6]. One of the drawbacks is that proteins usually denature at 60°C or higher temperatures while the temperature of interest is either physiological (37°C) or storage temperatures (4°C or 25°C), requiring result extrapolations of 20–55°C [7]. These temperature extrapolations are error prone because the temperature stability of proteins is a function of three parameters (enthalpy, entropy and heat capacity changes) [5,6]. Heat capacity changes, in particular, are difficult to measure by differential scanning calorimetry (DSC). In addition, temperature denaturation is often irreversible and accompanied by aggregation and precipitation, precluding a rigorous thermodynamic analysis. Under irreversibility conditions, which is often the case with antibodies [8], it is impossible to extrapolate reliable stability parameters to lower temperatures; consequently, stability rankings have been traditionally presented in terms of Tm values [9]. Irreversible protein denaturation is kinetically controlled and dominated by the rate of precipitation or aggregation which occurs upon the onset of unfolding. These processes are usually observed in DSC by the appearance of exothermic peaks overlapping the denaturation peak on the high temperature side of the transition. An additional complication is that the denaturation temperature is dependent on the rate at which the temperature is increased during the experiment [10,11], complicating even further stability extrapolations to lower temperatures.
A different approach to measure protein stability is the use of chemical denaturants like urea or guanidine hydrochloride (GuHCl), which permits measurements at any desired temperature and under many different solvent conditions. Chemical denaturation has been proven to provide reliable thermodynamic values for over 40 years [12–17] and is one of the most widely used technique in academic research laboratories. Unfortunately, the popularity of chemical denaturation methods have not been translated to industrial settings, due in part to the absence of instrumentation capable of automatically performing chemical denaturation experiments. This situation is likely to change with the appearance of novel instrumentation with the ability to automatically perform chemical denaturation analysis for proteins under different solvent conditions.
The temperature stability of proteins
The structural stability of a protein is determined by its Gibbs energy of stability, ΔG, which is a function of temperature, chemical denaturants and other physical or chemical variables [12,18–21]. In terms of temperature, ΔG is given by:
| (1) |
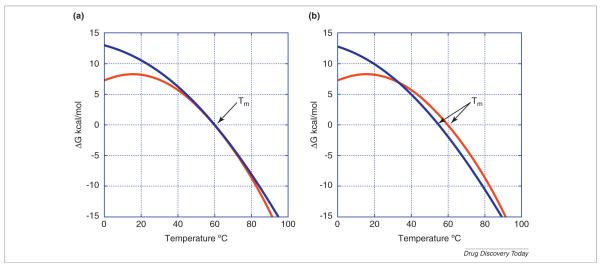
where T° is the reporting or reference temperature (i.e. the temperature at which the protein stability needs to be known). It could be physiological temperature (37°C), room temperature (25°C) or storage temperature (4°C) or any other desired temperature. Customarily, it is the midpoint of the denaturation transition temperature (Tm). ΔH° and ΔS° are the enthalpy and entropy changes at the reporting temperature and ΔCp is the heat capacity change associated with the denaturation transition. Figure 1 (panel A) shows temperature stability curves calculated for typical stability parameters for globular proteins as detailed in the figure legend. As indicated in the figure, the midpoint of the denaturation transition (Tm) occurs when ΔG = 0. Also, the temperature dependence is a complex nonlinear function depending on four quantities (ΔH°, ΔS°, ΔCp and T°). A full thermodynamic description can only be obtained by DSC because it is the only technique that measures ΔH°, ΔS° and ΔCp. However, DSC measures these quantities at the denaturation temperature and calculation of the protein stability at the reporting temperature requires long extrapolation. Denaturation temperature usually occurs around 60°C at the point in which ΔG is zero, as indicated in the figure. In the simulated example, the stability at 25°C is close to 8 kcal/mol, a typical value for globular proteins [5,6].
FIGURE 1.
The temperature dependence of the Gibbs energy of protein stability calculated for typical parameters obtained for globular proteins [5,6]. Panel A illustrates the influence of ΔCp on the curvature of the temperature dependence. Both proteins have a Tm of 60°C but the red one a ΔCp of 2.5 kcal/K mol compared to 1.5 kcal/K mol for the blue curve. Panel B illustrates the reversal of the stability rank order. In this case the blue protein has a lower Tm (55°C) but a higher stability at room temperature and below. In this case also ΔCp is 2.5 kcal/K mol for the red curve compared to 1.5 kcal/K mol for the blue curve. In all cases ΔH at Tm was assumed to be 120 kcal/mol.
The curvature in the temperature dependence of ΔG is dictated by the magnitude of ΔCp. As shown in the figure, two proteins with the same denaturation temperature can have very different stabilities at room temperature depending on the magnitude of ΔCp. In general, ΔCp is proportional to the degree of solvent exposure of the hydrophobic core of the protein upon denaturation [22–24]. The more hydrophobic the core, the more pronounced the curvature and the lower the stability at low temperature. Similarly and depending on the magnitude of ΔCp, the stability rank order obtained by Tm may not coincide with the stability at room or other lower temperature (Fig. 1, panel B). The profound influence of ΔCp on the temperature extrapolation of protein stability is particularly troublesome because it is the most difficult quantity to determine experimentally and subject to significant error. Moreover, in those cases in which the protein tends to aggregate or precipitate after denaturation, ΔCp determination becomes impossible.
Chemical denaturation of proteins
Perhaps the most widely used method to study protein stability is by inducing denaturation with a chemical agent. Throughout the years, urea and GuHCl have been the preferred denaturants. The Gibbs energy has been experimentally shown to follow a simple linear dependence with the denaturant concentration [12–16]:
| (2) |
where ΔG° is the Gibbs energy of stability of the protein at zero denaturant concentration (i.e. the stability of the protein at the experimental temperature and solvent conditions except denaturant). In Eqn 2, the Gibbs energy corresponds to the temperature at which the experiment is performed. If chemical denaturation experiments were performed at different temperatures, the resulting Gibbs energies will obey the dependence described by Eqn 1. m is universally referred to as the m-value [13–16]. Although a full thermodynamic analysis of temperature denaturation relies on DSC, chemical denaturation has been performed using a variety of techniques including UV spectroscopy, circular dichroism, fluorescence spectroscopy and nuclear magnetic resonance (NMR), among others [25]. Because the thermodynamic analysis of temperature denaturation requires knowledge of ΔCp, only DSC can be used to determine ΔG in a single experiment [5,6]. In general, in chemical denaturation, the measured changes in the physical observable are used to obtain ΔG° and the m value. Because of the linear dependence of the Gibbs energy on denaturant concentration, accurate values that agree quantitatively with those obtained by DSC can be determined. First, the physical observable is transformed into the fractional degree of denaturation, Fd, by using the equation:
| (3) |
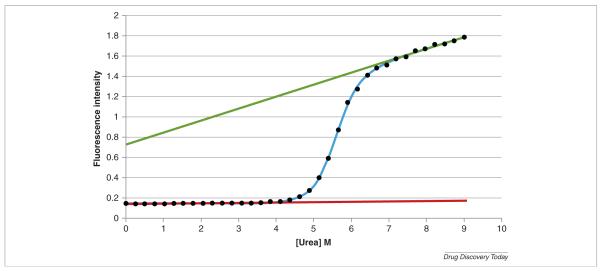
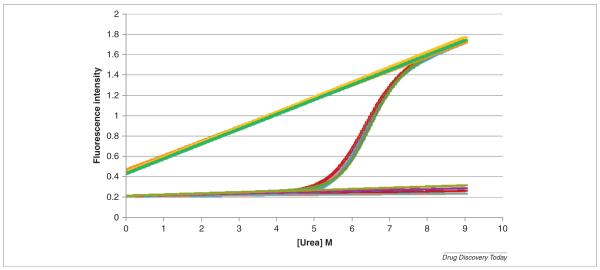
where y is the measured signal and yn, yd, the characteristic signals of the native and denatured states, respectively. Figure 2 shows a typical denaturation curve for cytochrome c obtained by fluorescence spectroscopy. In most cases yn and yd can be well represented by linear functions as shown in the figure.
FIGURE 2.
Urea denaturation of cytochrome c at pH 5. The experiments were performed with an AVIA 2304 Automated Protein Denaturation System using intrinsic fluorescence detection (excitation wavelength 280 nm, emission wavelength 356 nm). The final concentration of cytochrome c was 0.025 mg/mL. The AVIA instrument automatically generated a gradient of 36 different urea concentrations equally spaced between 0 and 9 m. Each of the 36 unique solutions was generated with identical protein concentrations and identical buffer concentrations. This group of solutions at pH 5.00 was one of a larger group of automatically prepared solutions, each group set to one specific pH value. The top (green) and bottom (red) straight lines correspond to the calculated characteristic values for the native and denaturated states. The solid line through the points is the best non-linear least squares fit to the data (see text for details).
The equilibrium constant, K, is defined in terms of ΔG as K = exp(−ΔG/RT). For a simple two-state folded ↔ denatured equilibrium, the fraction of protein molecules that are denatured, Fd, is given by:
| (4) |
From which K = Fd/(1 − Fd). In the past, K and ΔG values were calculated for each individual denaturant concentration, plotted and extrapolated to zero denaturant [12–16]. Nowadays, it is more efficient to perform a nonlinear least squares regression analysis of the denaturation curve (Fig. 2) to obtain best estimates for ΔG° and m without the need for extrapolation. Another quantity of interest is C1/2 = ΔG°/m, the denaturant concentration at half denaturation. In Fig. 2, the solid line through the points was calculated using the parameters obtained from the best nonlinear least squares fit of the data.
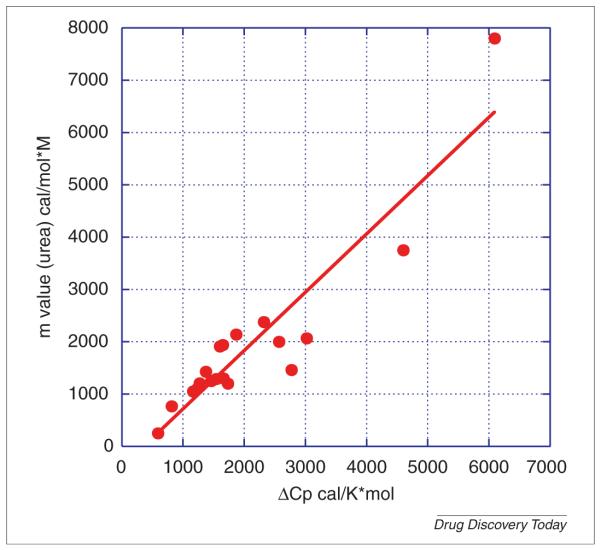
The m value, which appears as an empirical parameter in the linear extrapolation model, is characteristic for individual proteins and has been shown to be correlated with the change in solvent accessible surface area (ASA) of the protein during denaturation [16]. Since the heat capacity change, ΔCp, is also correlated with ASA changes [23,24], it is not surprising that m values and ΔCp also show good correlation as shown in Fig. 3, using the data compiled by Myers et al. [16]. The correlation coefficient between m and ΔCp is 0.92. Besides experimental error, a more perfect correlation is not observed because some proteins undergo non two-state denaturation which depresses the magnitude of the m value [16]. Also, it must be noted that the correlation requires reversible denaturation conditions. In general, a rigorous thermodynamic analysis of temperature or chemical denaturation data can only be performed if the denaturation process is reversible. Irreversible denaturation is controlled by kinetic parameters as discussed by Sanchez-Ruiz et al. [10,11]. m values may also exhibit solvent variations which can be very important for selecting optimal solution conditions. Buffers or excipients that lead to depressed m values provide a warning for conditions that favor aggregation, as the presence of aggregates will diminish ASA changes.
FIGURE 3.
Correlation between m values and ΔCp. Both values are correlated with changes in solvent accessible surface area upon unfolding.
Data taken from Myers et al. [16].
For more complex transitions (e.g. multiple domain proteins) Eqn 4 can be extended easily to:
| (5) |
where Ki is the equilibrium constant for the ith transition and αi its amplitude.
Irreversible denaturation
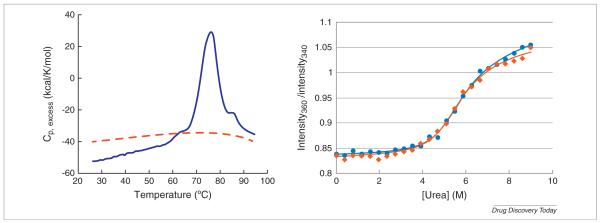
One of the main causes of irreversible denaturation is the formation of aggregates and/or precipitation of the denatured or partially denatured protein. This process is accentuated at higher temperatures due to the prominent role of hydrophobicity in aggregation and precipitation and the fact that the hydrophobic effect is more pronounced at higher temperatures [26]. Irreversibility can be due to temperature, to solvent effects and also to aggregation of the denatured state amplified by protein concentration. Temperature denaturation experiments alone cannot separate solvent from temperature irreversibility. Chemical denaturation experiments, especially urea denaturation which does not affect ionic strength as guanidine hydrochloride does, provide a way to decouple temperature from solvent effects in irreversible denaturation. Many proteins that undergo irreversible temperature denaturation, undergo reversible urea denaturation at lower temperatures. Figure 4 illustrates a situation observed with an anti epidermal growth factor receptor (EGFR) antibody which shows irreversible denaturation by DSC. The left panel shows the DSC temperature scan of the anti EGFR antibody in PBS buffer pH 7.4. The temperature denaturation transition is centered at 77°C and occurs in an irreversible fashion. A repeat scan of the same sample does not give any signal in the DSC scan as shown in the figure. Because DSC requires relatively high concentrations it is not possible to separate temperature or concentration as the source of irreversibility. In addition, and as seen in the figure, irreversible denaturation does not yield an accurate heat capacity change (ΔCp) and therefore temperature extrapolations of the protein stability to lower temperatures are erroneous. Because of aggregation after denaturation, the ΔCp is close to zero. If no ΔCp is considered, the expected stability at 25°C derived from the DSC data is extremely unrealistic (ΔG value of 100 kcal/mol). Panel B shows the urea denaturation curve measured by fluorescence spectroscopy in the same buffer at 25°C. The denaturation transition is centered at 5.7 m urea. As shown in Fig. 4 (panel B) the urea denaturation transition is reversible as demonstrated by dialysing the urea away after full denaturation and repeating the denaturation experiment. Analysis of the data indicates that, under these experimental conditions, the monoclonal antibody has a stability of ΔG = 8.3 kcal/mol and a m value of 1.48 kcal/mol protein/mol urea. The Gibbs energy and m value are similar in magnitude to those reported in the literature for other globular proteins [6,16,21]. This example demonstrates that chemical denaturation can provide reliable thermodynamic stability data for some situations in which temperature denaturation results in irreversibility, aggregation or precipitation. Once thermodynamically reversible conditions have been established, conditions that give rise to irreversibility (temperature, concentration, among others) can be investigated.
FIGURE 4.
Experimental temperature (measured by DSC, left panel) and urea denaturation at 25°C (measured by fluorescence spectroscopy, right panel) of anti-EGFR monoclonal antibody. Experiments were performed in phosphate buffer saline pH 7.4 (Roche Diagnostics GmbH, Mannheim, Germany). DSC experiments were performed in a Microcal VP-DSC instrument (GE Healthcare, Northampton, MA) at a protein concentration of 1 mg/mL. Fluorescence measurements were performed with the AVIA 2304 Automated Protein Denaturation System (excitation wavelength = 280 nm; emission wavelength collected between 300–500 nm) at a protein concentration of 5.5 μg/mL. In the DSC experiment, reversibility was tested using the standard procedure of rescanning the sample (blue line = first scan; red line = rescan). To test reversibility in the chemical denaturation experiment, the monoclonal antibody was dissolved into PBS, pH 7.4 at a concentration of 0.4 mg/mL and divided into two aliquots. Urea was added to a final concentration of 9 m to one of the aliquots and the same volume of buffer was added to the other and both samples were incubated for 24 hours at 25°C. The samples were then dialyzed against several changes of PBS for three days at 4°C and finally concentrated to the same concentration (blue line = first denaturation; red line = second denaturation). Abbreviations: DSC: differential scanning calorimetry; EGFR: epidermal growth factor receptor.
Reproducibility of chemical denaturation data
In the past urea or GuHCl protein denaturation curves needed to be performed individually (i.e. each sample, corresponding to one data point) was prepared individually and measured one at a time. Unless samples were incubated for long periods of time (several hours), the time between preparation and measurement was significantly different for each sample (data point). This situation contributed to long preparation times and large measurement errors. The automatic preparation of samples not only minimizes concentration errors but guarantees an identical timing between preparation and measurement for each sample. The data in the figure show the denaturation curves for four different samples of cytochrome c at pH 7.0. Analysis of the data yields the following thermodynamic parameters: ΔG° = 10.09 ± 0.12 kcal/mol; m = 1.4 ± 0.08 kcal/mol m; C1/2 = 6.3 ± 0.07 m (Fig. 5).
FIGURE 5.
Four independent urea denaturation curves for cytochrome c at pH 7.0. The figure illustrates the level of reproducibility obtained by the AVIA 2304 Automated Protein Denaturation System. All samples were prepared automatically by the instrument starting from stock basic and acid buffer components and a stock protein solution. Analysis of the data yields the following thermodynamic parameters: ΔG° = 10.09 ± 0.12 kcal/mol; m = 1.4 ± 0.08 kcal/mol m; C1/2 = 6.3 ± 0.07 m.
Optimizing solvent conditions for stability
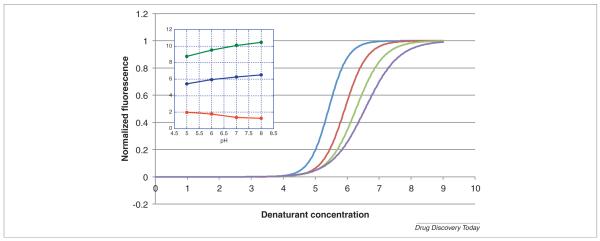
Chemical denaturation in general and urea denaturation in particular, allows identification of solvent conditions that maximize the structural stability of a protein. These conditions include pH, salts, ligands, excipients, among others. Conditions that increase protein stability shift the denaturation curves to higher urea concentrations (higher C1/2) or higher ΔG° values. The m value also provides important information. Since the m value is proportional to ΔASA, a larger m value suggests a more complete unfolding or a more cooperative process which may indicate a lower tendency to aggregation. Figure 6 provides an example of the discrimination that can be achieved in urea denaturation. In this figure, the pH dependence of the stability of cytochrome c is shown. Four curves measured at pH values ranging from 5 to 8 are shown. It can be seen that C1/2 increases at higher pH values; however, the curves become systematically broader resulting in smaller m values. Even though the protein becomes more stable at higher pH values, the smaller m values reflect a less cooperative transition at higher pH consistent with the known tendency of cytochrome c to aggregate upon denaturation at higher pH values [27,28]. In general, solvent conditions that maximize ΔG and C1/2 are those that maximize the structural stability of the protein. Since the m value is related to the cooperativity and extent of unfolding, maximal m values may indicate better solubility of the unfolded state and a lower tendency to aggregation.
FIGURE 6.
Urea denaturation of cytochrome c at pH 5.00, 6.00, 7.00 and 8.00 (left to right). The figure shows the normalized curves as described by Eqn 3. The experiments were performed with an AVIA 2304 Automated Protein Denaturation System using intrinsic fluorescence detection (excitation wavelength 280 nm, emission wavelength 356 nm). Different pH solutions were generated by mixing 10 mm succinic acid, 10 mm phosphoric acid, and 10 mm l-histidine at pH 4.0 with different proportions of 10 mm Na2-succinate, 10 mm Na2H-phosphate, and 10 mm l-histidine at pH 8.0. For each pH, cytochrome c was dispensed in aliquots of 10 μL into 24 wells of a microplate containing 130 μL buffer with a gradient of 0.0–9.0 m urea. The inset shows the variation of ΔG° (green in kcal/mol), m (red in kcal/mol*M) and C1/2 (blue in m urea).
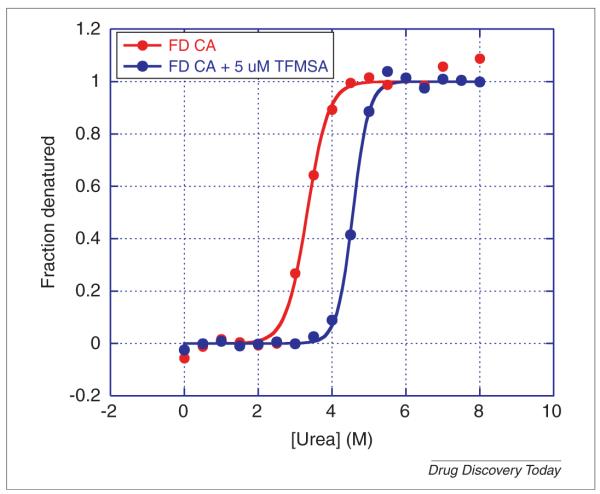
Chemical denaturation curves are also sensitive to the presence of ligands or other solvent variations. Figure 7 shows the urea denaturation curve of carbonic anhydrase in the presence of 5 μm of the inhibitor trifluoromethanesulfonamide (TFMSA) which binds to the enzyme with an affinity in the mid nanomolar range. As expected, the presence of this inhibitor/ligand, shifts the denaturation curve to higher urea concentrations consistent with a stabilization of the enzyme. Protein cofactors or additives can be identified by their stabilizing effect. The structural stabilization induced by ligands also provides a way to screen compound libraries for potential ligands and to rank their potency in terms of the C1/2 shift.
FIGURE 7.
Urea denaturation of carbonic anhydrase in the absence and presence of 5 μm of the inhibitor trifluoromethanesulfonamide (TFMSA). Carbonic anhydrase, isoform I, from human erythrocytes was dissolved in 25 mm MES, pH 6.0 at a concentration of 10 μm (0.3 mg/mL). Two sets of 17 test tubes were prepared containing 180 μL of MES with a gradient of 0.0–8.0 m urea (final concentration). DMSO (2 μL) was added to one of the series of test tubes and 2 μL of 500 μm TFMSA dissolved in DMSO was added to the other series for a final concentration of 5 μm TFMSA. The protein was dispensed in aliquots of 20 μL into the test tubes and incubated for four hours at 25°C. The final concentration of protein was 1 μm (0.03 mg/mL). The excitation wavelength was 280 nm and the emission wavelength 355 nm. Fluorescence measurements were performed manually in a Cary Eclipse spectrofluorometer (Varian, Agilent).
One additional advantage of chemical denaturation is that the experiments can be performed at the temperature of interest, thus producing an accurate ranking of potential ligands without the need for extrapolations.
Physical observables
Chemical denaturation can be measured with different physical observables like UV spectroscopy, fluorescence, NMR or circular dichroism. The superposition of normalized curves obtained with different observables has traditionally been used to test the validity of the two-state model [29]. In addition to ΔG° and m values, different observables provide specific structural information. For example, circular dichroism reports changes in secondary structure while tryptophan fluorescence provides information about the solvent exposure of those residues. Different endpoint values may be used to assess the degree of unfolding or the environment of fluorophores upon denaturation. In the case of tryptophan fluorescence, this information is contained not only in the emission intensity but also in the emission spectrum. Fluorescence measurements can also be performed with extrinsic fluorescence probes (e.g. ANS, sypro orange, Nile Red, Thioflavin T) which have the added advantage of being sensitive to additional processes like aggregation or the formation of protein fibers [30].
Concluding remarks
Chemical denaturation has long been the most popular method to evaluate the structural stability of proteins in research laboratories. Unfortunately, it has suffered from very low throughput due to tedious and lengthy sample preparation procedures, which have precluded its adoption in the biopharmaceutical industry. The availability of automated instrumentation with the capability of automatically performing sample preparation, measurements and data analysis now makes this well-established technique viable and practical in virtually any laboratory setting. Highly automated thermal denaturation techniques, especially differential scanning fluorimetry (DSF), have become widely adopted as protein stability screening techniques. With the advent of fully automated chemical denaturation, there is now a practicable means to complement thermal screening results with a fully orthogonal method and measurement system.
Acknowledgement
This work was supported by a grant from the National Institutes of Health R44 GM096751-02.
References
- 1.Ericsson UB, et al. Thermofuor-based high-throughput stability optimization of proteins for structural studies. Anal. Biochem. 2006;357:289–298. doi: 10.1016/j.ab.2006.07.027. [DOI] [PubMed] [Google Scholar]
- 2.Vedadi M, et al. Chemical screening methods to identify ligands that promote protein stability, protein crystallization and structure determination. Proc. Natl. Acad. Sci. U. S. A. 2006;103:15835–15840. doi: 10.1073/pnas.0605224103. [DOI] [PMC free article] [PubMed] [Google Scholar]
- 3.Capelle MAH, et al. High throughput screening of protein formulation stability: practical considerations. Eur. J. Pharm. Biopharm. 2007;65:131–148. doi: 10.1016/j.ejpb.2006.09.009. [DOI] [PubMed] [Google Scholar]
- 4.Senisterra GA, Finerty PJ., Jr High throughput methods of assessing protein stability and aggregation. Mol. BioSyst. 2009;5:217–223. doi: 10.1039/b814377c. [DOI] [PubMed] [Google Scholar]
- 5.Privalov PL, Khechinashvili NN. A Thermodynamic approach to the problem of stabilization of globular protein structure: a calorimetric study. J. Mol. Biol. 1974;86:665–684. doi: 10.1016/0022-2836(74)90188-0. [DOI] [PubMed] [Google Scholar]
- 6.Privalov G, et al. Precise scanning calorimeter for studying thermal properties of biological macromolecules in dilute solution. Anal. Biochem. 1995;232:79–85. doi: 10.1006/abio.1995.9957. [DOI] [PubMed] [Google Scholar]
- 7.Matulis D, et al. Thermodynamic stability of carbonic anhydrase: measurements of binding affinity and stoichiometry using thermofluor. Biochemistry. 2005;44:5258–5266. doi: 10.1021/bi048135v. [DOI] [PubMed] [Google Scholar]
- 8.Ahrer K, et al. Thermodynamic stability and formation of aggregates of human immunoglobulin G characterized by differential scanning calorimetry and dynamic light scattering. J. Biochem. Biophys. Methods. 2006;66:73–86. doi: 10.1016/j.jbbm.2005.12.003. [DOI] [PubMed] [Google Scholar]
- 9.He F, et al. High throughput thermostability screening of monoclonal antibody formulations. J. Pharm. Sci. 2010;99:1707–1720. doi: 10.1002/jps.21955. [DOI] [PubMed] [Google Scholar]
- 10.Galisteo ML, et al. Kinetic study on the irreversible thermal denaturation of yeast phosphoglycerate kinase. Biochemistry. 1991;30:2061–2066. doi: 10.1021/bi00222a009. [DOI] [PubMed] [Google Scholar]
- 11.Sanchez-Ruiz JM. Theoretical analysis of Lumry–Eyring models min differential scanning calorimetry. Biophys. J. 1992;61:921–935. doi: 10.1016/S0006-3495(92)81899-4. [DOI] [PMC free article] [PubMed] [Google Scholar]
- 12.Greene RF, Jr, Pace CN. Urea and guanidine hydrochloride denaturation of ribonuclease, lysozyme, alpha-chymotrypsin, and beta-lactoglobulin. J. Biol. Chem. 1974;249:5388–5393. [PubMed] [Google Scholar]
- 13.Pace CN, et al. Urea denaturation of barnase: pH dependence and characterization of the unfolded state. Biochemistry. 1992;31:2728–2734. doi: 10.1021/bi00125a013. [DOI] [PubMed] [Google Scholar]
- 14.Santoro MM, Bolen DW. Unfolding free energy changes determined by the linear extrapolation method. 1. Unfolding of phenylmethanesulfonyl.alpha.chymotrypsin using different denaturants. Biochemistry. 1988;27:8063–8068. doi: 10.1021/bi00421a014. [DOI] [PubMed] [Google Scholar]
- 15.Bolen DW, Santoro MM. Unfolding free energy changes determined by the linear extrapolation method. 2. Incorporation of dGn-u values in a thermodynamic cycle. Biochemistry. 1988;27:8069–8074. doi: 10.1021/bi00421a015. [DOI] [PubMed] [Google Scholar]
- 16.Myers JK, et al. Denaturant m values and heat capacity changes: relation to changes in accessible surface area of protein unfolding. Prot. Sci. 1995;4:2138–2148. doi: 10.1002/pro.5560041020. [DOI] [PMC free article] [PubMed] [Google Scholar]
- 17.Aucamp JP, et al. High-throughput measurement of protein stability in microtiter plates. Biotechnol. Bioeng. 2005;89:599–607. doi: 10.1002/bit.20397. [DOI] [PubMed] [Google Scholar]
- 18.Brandts JF, et al. Thermodynamics of protein denaturation. Effect of pressure on the denaturation of ribonuclease A. Biochemistry. 1970;9:1038–1047. doi: 10.1021/bi00806a045. [DOI] [PubMed] [Google Scholar]
- 19.Privalov PL. Stability of proteins: small globular proteins. Adv. Protein Chem. 1979;33:167–239. doi: 10.1016/s0065-3233(08)60460-x. [DOI] [PubMed] [Google Scholar]
- 20.Plaza del Pino IM, et al. Temperature and guanidine hydrochloride dependence of the structural stability of ribonuclease T1. Biochemistry. 1992;31:11196–11202. doi: 10.1021/bi00160a033. [DOI] [PubMed] [Google Scholar]
- 21.Freire E. The thermodynamic linkage between protein structure, stability and function. In: Murphy KP, editor. Methods in Molecular Biology. vol. 168. Humana Press; Clifton, N.J: 2001. pp. 37–68. [DOI] [PubMed] [Google Scholar]
- 22.Privalov PL, Makhatadze GI. Heat capacity of proteins. II. Partial molar heat capacity of the unfolded polypeptide chain of proteins: protein unfolding effects. J. Mol. Biol. 1990;213:385–391. doi: 10.1016/S0022-2836(05)80198-6. [DOI] [PubMed] [Google Scholar]
- 23.Livingstone JR, et al. Contribution to the thermodynamics of protein folding from the reduction in water-accessible nonpolar surface area. Biochemistry. 1991;30:4237–4244. doi: 10.1021/bi00231a019. [DOI] [PubMed] [Google Scholar]
- 24.Gomez J, et al. The heat capacity of proteins. Proteins. 1995;22:404–412. doi: 10.1002/prot.340220410. [DOI] [PubMed] [Google Scholar]
- 25.Pace CN. Determination and analysis of urea and guanidine hydrochloride denaturation curves. Methods Enzymol. 1986;131:266–280. doi: 10.1016/0076-6879(86)31045-0. [DOI] [PubMed] [Google Scholar]
- 26.Baldwin RL. Temperature dependence of the hydrophobic interaction in protein folding. Proc. Natl. Acad. Sci. U. S. A. 1986;83:8069–8072. doi: 10.1073/pnas.83.21.8069. [DOI] [PMC free article] [PubMed] [Google Scholar]
- 27.Fedunova D, Antalik M. Prevention of thermal induced aggregation of cytochrome c at isoelectric pH values by polyanions. Biotechnol. Bioeng. 2006;93:485–493. doi: 10.1002/bit.20733. [DOI] [PubMed] [Google Scholar]
- 28.Singh SM, et al. Mechanisms of m-cresol-induced protein aggregation studied using a model protein cytochrome c. J. Pharm. Sci. 2011;100:1679–1689. doi: 10.1002/jps.22426. [DOI] [PMC free article] [PubMed] [Google Scholar]
- 29.Lumry R, et al. Validity of the ‘two-state’ hypothesis for conformational transitions of proteins. Biopolymers. 1966;4:917–944. doi: 10.1002/bip.1966.360040808. [DOI] [PubMed] [Google Scholar]
- 30.Hawe A, et al. Extrinsic fluorescent dyes as tools for protein characterization. Pharm. Res. 2008;25:1487–1499. doi: 10.1007/s11095-007-9516-9. [DOI] [PMC free article] [PubMed] [Google Scholar]


