Abstract
BACKGROUND AND PURPOSE:
The natural history of cerebral aneurysms is thought to be governed by multifactorial processes involving hemodynamics, biomechanics, mechanobiology, and perianeurysmal environment. The purpose of this study was to highlight the importance of considering the influence of contacts with perianeurysmal environment structures on the hemodynamics and geometric evolution of intracranial aneurysms.
MATERIALS AND METHODS:
A large aneurysm of the basilar artery in contact with bone and observed to grow during a 4-year follow-up period was selected for study. Anatomic models were constructed from longitudinal CTA images acquired at 1-year intervals during the observation period. Computational fluid dynamics simulations were carried out under pulsatile flow conditions to analyze the blood flow pattern and WSS distribution in the aneurysm during its evolution.
RESULTS:
The aneurysm was observed to grow against the bone, resulting in a geometric change of the proximal parent artery, which, in turn, induced substantial changes in the aneurysm hemodynamics. In particular, a region of elevated WSS created by the inflow streams was observed to shift locations around the place where the aneurysm enlarged in contact with the bone as the aneurysm progressed. In addition, a “notch” near the distal end of the aneurysm, away from the bone and subject to relatively high WSS, was observed to grow and, later, completely disappear.
CONCLUSIONS:
Contacts with perianeurysmal structures need to be considered and analyzed to assess whether they could exert a significant influence on the geometric evolution of each individual intracranial aneurysm and its hemodynamics.
The increasing numbers of incidentally detected cerebral aneurysms has fueled, over the last decade, the discussion of whether unruptured brain aneurysms should be treated or conservatively followed.1 However, planning elective surgery requires a better understanding of the natural history of intracranial aneurysms, so that a sound judgment between the risks and benefits of possible therapies can be made. Hemodynamics is thought to play a fundamental role in the mechanisms of cerebral aneurysm formation, growth, and stabilization or rupture.2 Most previous studies of the hemodynamics of cerebral aneurysms have been limited to aneurysms imaged only once.3–5 However, to improve our knowledge of the mechanisms governing the evolution of cerebral aneurysms, it has become necessary to analyze aneurysms that have been longitudinally followed during their natural evolution. Only a few studies of the patient-specific hemodynamics in growing cerebral aneurysms, longitudinally followed with 3D imaging, have been carried out.6–8 This is a challenging task because, typically, most aneurysms are preventively treated and only a few that are considered to carry a low rupture risk are conservatively observed. Furthermore, a proper analysis of aneurysmal growth in longitudinal studies could be a difficult task due to confounding factors such as physiologic changes over time or the location of the aneurysm (bone or soft tissues may influence the direction of growth). In this context, the goal of this paper is to highlight the importance of considering possible contacts between the aneurysm and perianeurysmal structures and studying their effects on the aneurysm evolution. For this purpose, a computational analysis of a growing aneurysm in contact with bone at the base of the skull is presented.
Materials and Methods
Image Data
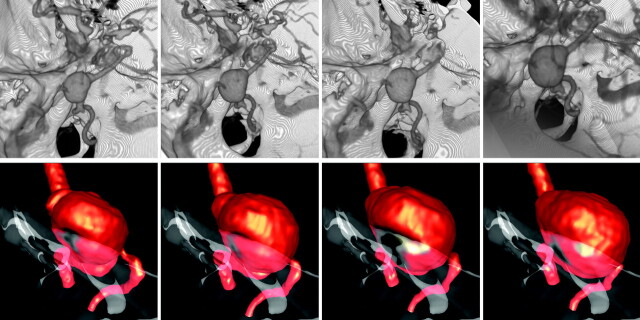
In an ongoing longitudinal study of unruptured, untreated intracranial aneurysms, a large fusiform aneurysm of the basilar artery was observed to grow in contact with the clivus bone and was selected for detailed analysis. The patient was a 65-year-old woman with a 19-mm aneurysm immediately distal to the vertebrobasilar junction. The aneurysm was followed noninvasively with CTA imaging at 1-year intervals for a total of 4 years. Because the aneurysm was observed to enlarge during the observation period, treatment was recommended and the aneurysm was finally embolized with coils. The CTA images acquired during the follow-up period contained between 150 and 314 sections of 512 × 512 pixels, with an in-plane resolution of 0.351562 mm and a section thickness of 0.5 mm. Aneurysms in our longitudinal study are classified as growing if their dimension in any direction enlarges by more than 0.5 mm between consecutive examinations. Volume renderings of the aneurysm and surrounding bone structures at the 4 examination times during the follow-up period are presented in Fig 1 (top row). These 4 time points are hereafter denoted as times 1 to 4.
Fig 1.
Top row: Longitudinal CTA images of a growing basilar artery aneurysm in contact with the bone. Bottom row: Corresponding vascular and bone models showing the geometric evolution of the aneurysm against the bone. Images are 1 year apart, from oldest (left) to newest (right). These models were aligned with respect to the bone.
Anatomic Modeling
Anatomic reconstructions of the vasculature and a portion of the bone around the contact region were created from the CTA images. The vascular models included the aneurysm, the 2 vertebral arteries, and a segment of the basilar artery distal to the aneurysm. Four anatomic models corresponding to the 4 examination times were created by careful manual segmentation, paying special attention to the consistency of the vascular structures at the 4 examination times. Models were considered consistent when similar parent artery diameters were achieved in the segmentation. Once the images were segmented, 3D geometric models were constructed by isosurface extraction, followed by surface smoothing and truncation of the vessels perpendicularly to their axes. Fig 1 (bottom row) presents the vascular models at all 4 times, together with the reconstructed portion of the occipital bone (rendered with transparency). The contact region between the bone and the aneurysm can be clearly seen. Unstructured grids composed of tetrahedral elements and a resolution of 0.01 cm were subsequently generated for computational fluid dynamics calculations. The grids contained from 2.2 to 3.7 million elements.
Aneurysm Alignment and Deformation Estimation
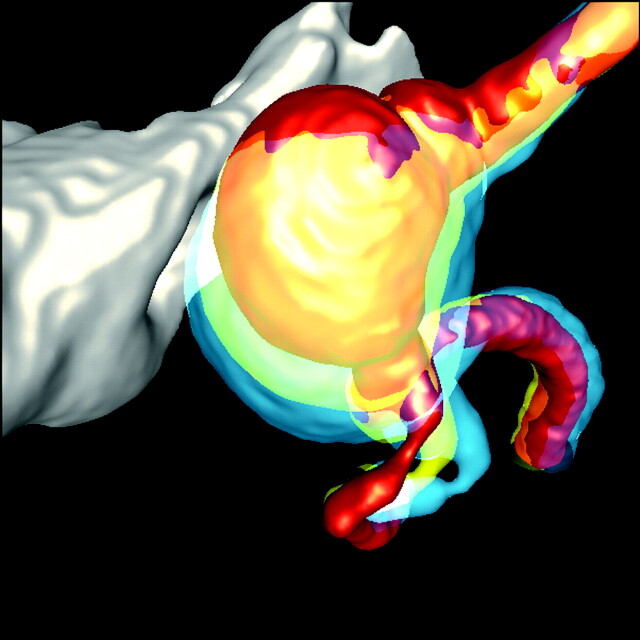
To analyze the geometric progression of the aneurysm, the anatomic models corresponding to the different examination times were aligned in the following 2 ways. First, the vascular models were aligned with respect to the segmented bone structures, which did not exhibit significant changes during the observation period. This alignment allows the analysis of the geometric change of the aneurysm and the parent artery using the bone as a reference. The aligned vascular models at the 4 observation times, along with the bone structure, are presented in Fig 2. Second, the vascular models were aligned by matching a portion of the parent artery consisting of proximal and distal segments connected to the aneurysm. This alignment allows the analysis of the relative geometric deformation of the aneurysm at different stages during its progression. In both cases, model alignments were carried out by minimization of the distance between consecutive surface models.
Fig 2.
Changes in the aneurysm and parent artery geometry as a consequence of aneurysmal growth against the bone during the longitudinal follow-up period. Note the change of curvature at the stenosis on the left vertebral artery. These models were aligned with respect to the bone to compare vascular displacement. The red model is for year 1; the yellow and orange models are for years 2 and 3, respectively; and the blue model is for year 4.
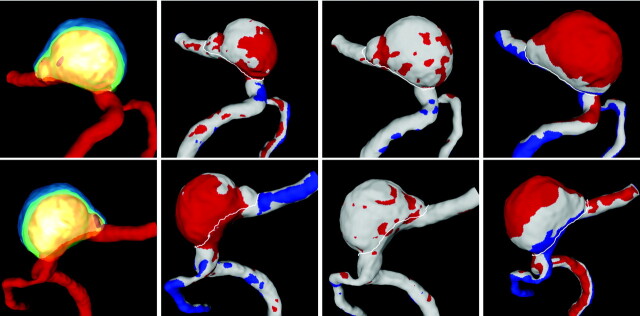
Subsequently, the geometric deformation of the aneurysm was estimated by computing the displacement between consecutive vascular models after alignment with respect to the parent artery. Regions of “enlargement” (displacement > −0.5 mm), “shrinkage” (displacement <−0.5 mm), and “no change” (distance <0.5 mm) were identified on the vascular models at each examination time. The aligned vascular models, as well as the identified regions, are presented in Fig 3 from 2 viewpoints: left to right (LR, top row) and right to left (RL, bottom row).
Fig 3.
Regions of aneurysm deformation during its evolution from 2 viewpoints (top row: right to left view; bottom row: left to right view). Left to right columns: Superposition of geometric models corresponding to all 4 examination times aligned with respect to the parent artery, and regions of aneurysm deformation from time 1 to 2, from time 2 to 3, and from time 3 to 4. Red indicates positive displacement (outward expansion), blue indicates negative displacement (contraction), and white indicates no displacement. These models were aligned with respect to the parent artery to evaluate aneurysm deformation.
Hemodynamics Modeling
The blood flow was studied using CFD, a branch of fluid mechanics that uses numeric methods and algorithms implemented on a computer to solve and analyze problems that involve fluid flows. In particular, blood flow simulations were carried out for all vascular geometries by numerically solving the 3D unsteady Navier-Stokes equations for an incompressible Newtonian fluid.9 The vessel walls were considered rigid and no-slip boundary conditions were applied at the walls. Traction-free boundary conditions were imposed at the single outlet located in the basilar artery. Pulsatile flow boundary conditions were prescribed at the inlet boundaries located in the left and right vertebral arteries using the Womersley velocity profile. Because patient-specific flow information was not available, waveforms derived from in vivo measurements in vertebral arteries of normal subjects were used.10 These waveforms were scaled with the inlet diameter to achieve a mean WSS of 15 dyne/cm2 at the inlets.11 Unsteady calculations were carried out for 2 cardiac cycles using 100 time-steps per cycle, employing a fully implicit finite element solver.12 Results are presented for the second cycle.
Results
Examination of the anatomic models presented in Fig 1 (bottom row) reveals the left part of the aneurysm wall contacts the bone at all times during its evolution. Figure 2 then suggests that the aneurysm attempts to enlarge in the left/anterior direction, but because it is constrained by the bone, it seems to push against it and deform in the opposite (right/posterior) direction. This causes a displacement of the parent artery in the right/posterior direction and an associated change in its curvature immediately proximal to the vertebral artery junction and the aneurysm. It can be seen that the left vertebral artery has a mild stenosis at this location and that it starts to develop a kink in this place as the geometry progresses (Fig 2).
The inspection of the geometric deformations obtained by aligning the models with respect to their parent arteries (Fig 3) would indicate that the aneurysm enlarges mainly in the right/posterior/inferior direction from times 1 to 2, remains relatively stable from times 2 to 3, and enlarges mainly at the dome fundus from times 3 to 4. However, these observations must be carefully interpreted. Because the left part of the aneurysm wall is in contact with the bone, it cannot enlarge in this direction. Therefore, it seems that as it pushes against the wall it enlarges in the opposite and normal directions; otherwise, we would not observe the associated geometric changes in the parent artery. Thus, it seems reasonable to assume that the aneurysm grows or expands at its left wall and probably also at its fundus.
Despite the confusion introduced by the contact with bone in the determination of the regions of aneurysmal progression, there is a region that clearly exhibits growth. This region corresponds to the “notch” that can be observed near the distal part of the aneurysm. The vascular models presented in Figs 1 and 3 show that this “notch,” which is quite pronounced at time 1, gradually expands until it is no longer visible by time 4. It is important to note that this localized enlargement is away from the bone and is probably less influenced by this contact.
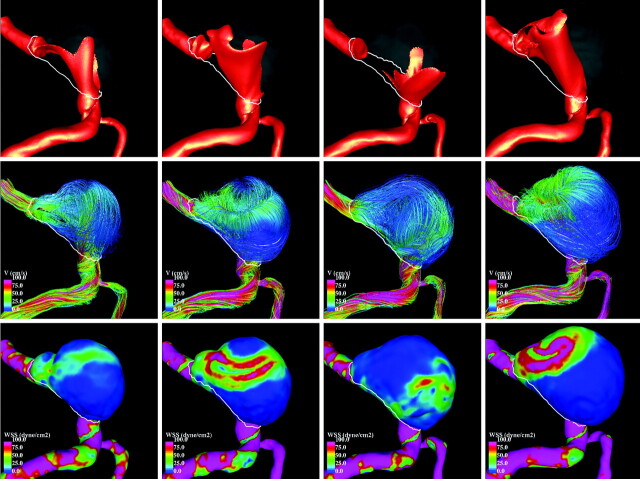
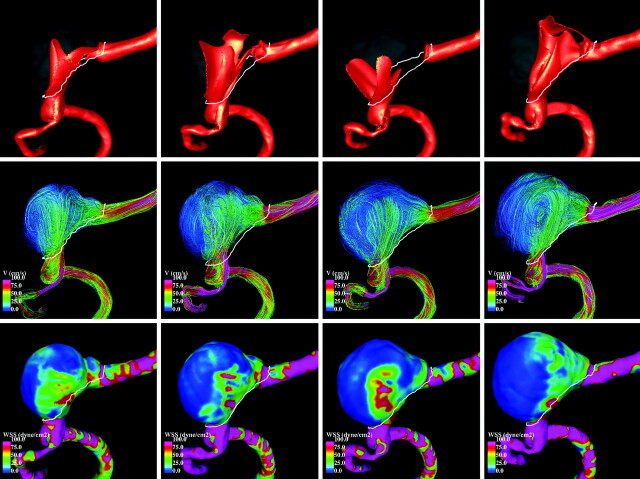
Visualizations of the blood flow patterns at each time point during the aneurysm evolution are presented in Fig 4 (left-right view) and Fig 5 (right-left view). These figures show, from top to bottom, visualizations of the inflow streams using isovelocity surfaces, the blood flow structure using streamlines, and the WSS distribution (a measure of the force of friction from the blood acting on the arterial wall), all at peak systole. The columns of these figures show, from left to right, the hemodynamics at times 1 to 4.
Fig 4.
Hemodynamic visualizations at peak systole during aneurysm progression (LR view). Left to right: Four stages during aneurysm growth. Top to bottom: Isovelocity surfaces showing the inflow streams, velocity color-coded streamlines showing flux complexity (pink is maximum velocity, blue is minimum), and WSS distribution showing stress intensity on the wall (pink is maximum, blue is minimum).
Fig 5.
Hemodynamic visualizations at peak systole during aneurysm progression (RL view). Left to right: Four stages during aneurysm growth. Top to bottom: Isovelocity surfaces showing the inflow streams, velocity color-coded streamlines showing flux complexity (pink is maximum velocity, blue is minimum), and WSS distribution showing stress intensity on the wall (pink is maximum, blue is minimum).
It can be seen that the inflow streams from both vertebral arteries interact and mix within the aneurysm, producing a complex intra-aneurysmal flow pattern. However, the structures of these flow patterns change substantially during the evolution of the aneurysm. At time 1, one of the inflow streams penetrates the aneurysm and impacts the distal part of the dome, creating a region of elevated WSS at this location. A second inflow stream slides along the right side of the aneurysm wall elevating the WSS. Then the flow recirculates within the aneurysm and exits into the basilar artery, elevating the WSS in the region of the “notch.” At time 2, the change in the parent artery geometry causes a substantial change in the inflow streams, creating more complex flow patterns and higher WSS values but still producing an elevated WSS at the region of the “notch.” At time 3, further changes in the parent artery now cause the inflow streams to collide and spread toward the left and right parts of the aneurysm walls, elevating the WSS. At this point, the “notch” has virtually disappeared and that region has progressed to a state of low WSS. At point 4, the 2 inflow jets penetrate the aneurysm parallel to each other, effectively creating a single concentrated inflow stream that impacts the distal part of the aneurysm dome, elevating the WSS (especially on the left side). This means that the changes in the geometry of the vertebral arteries during the aneurysm evolution dramatically alter the blood flow.
Discussion
The natural history of cerebral aneurysms can be divided into 3 stages: 1) aneurysm formation or initiation, 2) growth or enlargement, and 3) rupture. The underlying mechanisms governing the evolution from one stage to the next are thought to be multifactorial, involving hemodynamic loads and, in particular, WSS, wall biomechanics, mechanobiology, and contacts with the perianeurysmal environment.2 It is generally believed that aneurysm formation is caused by focally increased hemodynamic stresses, which cause local damage to the wall.13 It is also generally accepted that aneurysm enlargement results from a weakening of the wall and a subsequent yield to pressure, and that rupture occurs when wall stresses exceed wall strength.14 Wall weakening is thought to occur as a consequence of mechanobiologic responses to hemodynamic loading. However, there is disagreement about the exact mechanisms responsible for this weakening of the wall. On the one hand, low flow and low WSS have been thought to produce dysfunction of the endothelium at the aneurysm dome, as well as accumulation of macrophages along the intimal surface, inducing inflammation and damage and subsequent wall degradation.15 On the other hand, strong flows and high WSS have been thought to cause endothelial injury, initiating wall remodeling and wall degeneration.16,17 CFD studies of the in vivo hemodynamic environment during aneurysmal evolution, using longitudinal image data, are divided as well—some support the low-flow theory,6,7 and others, the high-flow theory.18
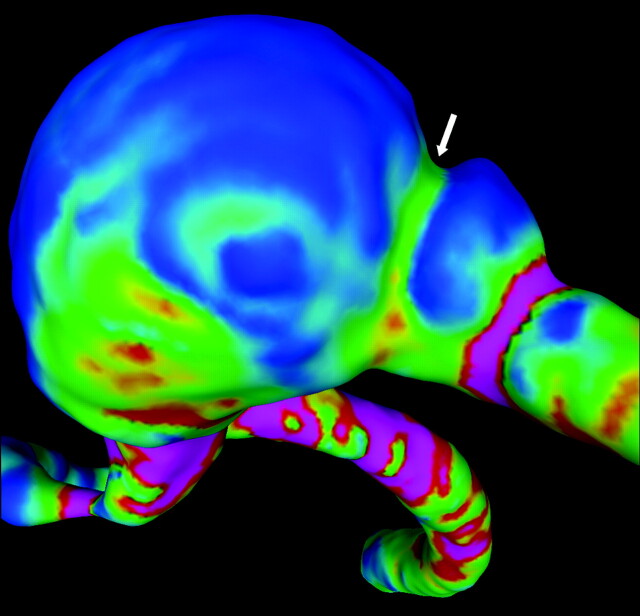
The results of the current work suggest the following interesting observations. It is not possible to claim that this particular aneurysm grew in the region persistently subjected to low WSS. If that were the case, it would be difficult to explain the deformation of the parent artery and the disappearance of the distal notch. The contact with bone complicates the determination of the regions of aneurysm deformation and, therefore, the analysis of the relationship between hemodynamic loads and growth. In other words, in this case, the observed displacements of the aneurysm wall cannot simply be equated to aneurysm growth. Thus, these results highlight the importance of considering the effects of possible contacts with perianeurysm environment structures. Nevertheless, it is safe to assume that the expansion and subsequent disappearance of the “notch” near the distal dome of the aneurysm was due to aneurysm progression and not a consequence of the contact of the aneurysm with the bone. Interestingly, this region of aneurysm enlargement was observed to be consistently subjected to elevated WSS during its evolution. The fading of the notch thus seems inconsistent with the low-flow theory of aneurysm progression. In this context, if the aneurysm grew in low WSS regions (Fig 6), then the notch should have become more pronounced with time, just the opposite of what was observed.
Fig 6.
WSS distribution at the notch (arrow) on the distal part of the aneurysm dome at year 1. Note the green (higher WSS) region at the notch (arrow) that eventually disappeared is surrounded by blue regions (lower WSS). This strongly suggests there is growth on the high WSS region.
The results of the current study may be affected by a number of limitations, as well as assumptions and approximations made when creating the computational models. These include limited image resolution, relatively long follow-up imaging intervals, blood modeled as a Newtonian fluid, wall compliance that was neglected, and “typical” flow conditions derived from measurements of normal subjects.
Inconsistencies in the creation of geometric models from medical images could result in errors when measuring differences; however, to alleviate this problem, models were manually segmented and considered consistent when similar parent artery diameters were achieved (it was assumed parent arteries did not change significantly in diameter).
Previous sensitivity analyses have also shown that wall motion, non-Newtonian effects, and flow conditions have a secondary effect compared with the vascular geometry.19,20 These studies suggest that though these assumptions and approximations can influence the exact values of hemodynamic variables, the fundamental characteristics of their distributions over the aneurysm are not fundamentally affected.
Conclusions
In studies of the evolution of cerebral aneurysms, contacts with perianeurysmal structures need to be considered and analyzed to assess whether these could exert a significant influence on the geometric evolution of each individual intracranial aneurysm and its hemodynamics. This is important because the interaction between the aneurysm and extravascular structures can create confusion about the regions of aneurysm progression, making it difficult to associate geometric displacement with local aneurysm enlargement. In addition, this interaction can also induce deformations in the parent artery that can significantly alter the aneurysm hemodynamics. These interactions need to be carefully evaluated to understand the geometric progression of the aneurysm and its relationship with the intra-aneurysmal hemodynamics.
In general, the observed displacements of the aneurysm wall cannot simply be equated to aneurysm growth. In the particular case presented here, the observation of the eventual disappearance of the notch at the distal part of the dome provides an unambiguous identification of a region of growth that was subjected to a relatively high WSS.
ABBREVIATIONS:
- CFD
computational fluid dynamics
- WSS
wall shear stress
Footnotes
Disclosures: Christopher Putman—UNRELATED: Consultancy: Stryker; Payment for Lectures (including service on speakers bureaus): Codman Neurovascular. Juan Cebral—UNRELATED: Grants/Grants Pending: Philips Healthcare.
This study was supported by National Institutes of Health grant # R01NS059063.
References
- 1. Wiebers DO, Whisnant JP, Huston J, 3rd, et al. International Study of Unruptured Intracranial Aneurysms Investigators. Unruptured intracranial aneurysms: natural history, clinical outcome, and risks of surgical and endovascular treatment. Lancet 2003;362:103–10 [DOI] [PubMed] [Google Scholar]
- 2. Sforza DM, Putman CM, Cebral JR. Hemodynamics of cerebral aneurysms. Annu Rev Fluid Mechanics 2009;41:91–107 [DOI] [PMC free article] [PubMed] [Google Scholar]
- 3. Cebral JR, Castro MA, Burgess JE, et al. Characterization of cerebral aneurysm for assessing risk of rupture using patient-specific computational hemodynamics models. AJNR Am J Neuroradiol 2005;26:2550–59 [PMC free article] [PubMed] [Google Scholar]
- 4. Shojima M, Oshima M, Takagi K, et al. Magnitude and role of wall shear stress on cerebral aneurysm: computational fluid dynamic study of 20 middle cerebral artery aneurysms. Stroke 2004;35:2500–05 [DOI] [PubMed] [Google Scholar]
- 5. Valencia A, Morales H, Rivera R, et al. Blood flow dynamics in patient-specific cerebral aneurysm models: the relationship between wall shear stress and aneurysm area index. Med Eng Phys 2008;30:329–40 [DOI] [PubMed] [Google Scholar]
- 6. Boussel L, Rayz V, McCulloch C, et al. Aneurysm growth occurs at region of low wall shear stress: patient-specific correlation of hemodynamics and growth in a longitudinal study. Stroke 2008;39:2997–3002 [DOI] [PMC free article] [PubMed] [Google Scholar]
- 7. Jou LD, Wong G, Dispensa B, et al. Correlation between lumenal geometry changes and hemodynamics in fusiform intracranial aneurysms. AJNR Am J Neuroradiol 2005;26:2357–63 [PMC free article] [PubMed] [Google Scholar]
- 8. Tateshima S, Tanishita K, Omura H, et al. Intra-anerysmal hemodynamics during the growth of unruptured aneurysm: in vitro study using longitudinal CT angiogram database. AJNR Am J Neuroradiol 2007;28:622–27 [PMC free article] [PubMed] [Google Scholar]
- 9. Kundu PK, Cohen IM. Fluid mechanics. New York: Academic Press; 2004 [Google Scholar]
- 10. Ford MD, Alperin N, Lee SH, et al. Characterization of volumetric flow rate waveforms in the normal internal carotid and vertebral arteries. Physiol Meas 2005;26:477–88 [DOI] [PubMed] [Google Scholar]
- 11. Cebral JR, Castro MA, Putman CM, et al. Flow-area relationship in internal carotid and vertebral arteries. Physiol Meas 2008;29:585–94 [DOI] [PMC free article] [PubMed] [Google Scholar]
- 12. Cebral JR, Löhner R, Appanaboyina S, et al. Image-based computational hemodynamics methods and their application for the analysis of blood flow past endovascular devices. In: Leondes CT. ed., Biomechanical Systems Technology: (1) Computational Methods: Singapore: World Scientific; 2007:29–85 [Google Scholar]
- 13. Gao L, Hoi Y, Swartz DD, et al. Nascent aneurysm formation at the basilar terminus induced by hemodynamics. Stroke 2008;39:2085–90 [DOI] [PMC free article] [PubMed] [Google Scholar]
- 14. Humphrey JD. Vascular adaptation and mechanical homeostasis at tissue, cellular, and sub-cellular levels. Cell Biochem Biophys 2008;50:53–78 [DOI] [PubMed] [Google Scholar]
- 15. Griffith TM. Modulation of blood flow and tissue perfusion by endothelium-derived relaxing factor. Exp Physiolo 1994;779:873–913 [DOI] [PubMed] [Google Scholar]
- 16. Sho E, Sho M, Singh TM, et al. Bloodflow decrease induces apoptosis of endothelial cells in previously dilated arteries resulting from chromic high blood flow. Arterioscler Thromb Vasc Biol 2001;21:1139–45 [DOI] [PubMed] [Google Scholar]
- 17. Fukuda S, Hashimoto N, Naritomi H, et al. Prevention of rat cerebral aneurysm formation by inhibition of nitric oxide synthase. Circulation 2000;101:2532–38 [DOI] [PubMed] [Google Scholar]
- 18. Sforza DM, Putman CM, Tateshima S, et al. Hemodynamics and growth of intracraneal aneurysms. ASME Summer Bioengineering Conference. Naples, Florida; June 16–19, 2010 [Google Scholar]
- 19. Cebral JR, Castro MA, Appanaboyina S, et al. Efficient pipeline for image-based patient-specific analysis of cerebral aneurysm hemodynamics: technique and sensitivity. IEEE Trans Med Imaging 2005;24:457–67 [DOI] [PubMed] [Google Scholar]
- 20. Sforza DM, Löhner R, Putman CM, et al. Hemodynamic analysis of intracranial aneurysms with moving parent arteries: basilar tip aneurysms. IJNMBE Int J Num Meth Biomed Eng 2010;26:1219–27 [DOI] [PMC free article] [PubMed] [Google Scholar]


