

Abstract
Acute myeloid leukemia (AML) in Down syndrome (DS) children has several unique features including a predominance of the acute megakaryocytic leukemia (AMkL) phenotype, higher event-free survivals compared to non-DS children using cytosine arabinoside (ara-C)/anthracycline-based protocols, and a uniform presence of somatic mutations in the X-linked transcription factor gene, GATA1. Several chromosome 21-localized transcription factor oncogenes including ETS2 may contribute to the unique features of DS AMkL. ETS2 transcripts measured by real-time RT-PCR were 1.8- and 4.1-fold, respectively, higher in DS and non-DS megakaryoblasts than those in non-DS myeloblasts. In a doxycycline-inducible erythroleukemia cell line, K562pTet-on/ETS2, induction of ETS2 resulted in an erythroid to megakaryocytic phenotypic switch independent of GATA1 levels. Microarray analysis of doxycycline induced and uninduced cells revealed an upregulation by ETS2 of cytokines (e.g. interleukin 1 and CSF2) and transcription factors (e.g. TAL1), which are key regulators of megakaryocytic differentiation. In the K562pTet-on/ETS2 cells, ETS2 induction conferred differences in sensitivities to ara-C and daunorubicin, depending on GATA1 levels. These results suggest that ETS2 expression is linked to the biology of AMkL in both DS and non-DS children, and acts by regulating expression of hematopoietic lineage and transcription factor genes involved in erythropoiesis and megakaryopoiesis, and in chemotherapy sensitivities.
Keywords: Down syndrome, acute megakaryocytic leukemia, chromosome 21, ETS2, GATA1, chemotherapy sensitivity
INTRODUCTION
Down Syndrome (DS) children have a 10-20-fold increased risk of developing acute lymphoblastic leukemia (ALL) and acute myeloid leukemia (AML) compared to non-DS children (1). AML in DS children displays unique characteristics including a predominance of the megakaryocytic leukemia (AMkL) phenotype (2–9), which is estimated to occur at a 500-fold greater frequency in DS children compared to non-DS children (8). This suggests that trisomy 21 plays an important role in leukemogenesis. DS and non-DS children with AMkL treated with cytosine arabinoside (ara-C)/anthracycline-based protocols have extremely different treatment outcomes. DS children routinely experience event-free survival (EFS) rates of 80–100% (1), whereas non-DS children with AMkL have extremely low EFS rates (<30%). These results highlight distinct biological differences between DS and non-DS AMkL cases. Consistent with this notion, in our previous studies using in vitro MTT assays, DS megakaryoblasts were significantly more sensitive to ara-C and daunorubicin than non-DS megakaryoblasts (10), similar to results reported by others (11, 12).
Somatic mutations in exon 2 of the X-linked gene, GATA1, which encodes a zinc-finger transcription factor that is essential for normal erythroid and megakaryocytic differentiation, have been detected exclusively and almost uniformly in all DS AMkL cases, but not in non-DS AML or non-AMkL DS leukemia cases (13–19). The net effect of the mutations is to introduce early stop codons that result in the synthesis of a shorter GATA1 (GATA1s, 40-kDa) protein translated from a downstream initiation site, distinguishable from the full-length 50-kDa GATA1 protein in its transactivation capacity. GATA1 mutations in DS are believed to cause accumulation of poorly differentiated megakaryocytic precursors (13).
The high frequency of the AMkL phenotype in DS AML and the extremely different treatment outcomes between DS and non-DS AMkLs suggest that interactions between chromosome 21-localized genes (present in 3 copies in trisomy 21 cells) and GATA1 mutations may facilitate the development of AMkL and may also be involved in the altered chemotherapy sensitivities between DS and non-DS AMkL. Candidate genes include transcription factor oncogenes located on chromosome 21, such as AML1, ERG and ETS2.
AML1 [also known as RUNX1, a DNA-binding subunit of the transcription complex termed core-binding factor (20,21)] is located in the “critical Down syndrome region” on chromosome 21 and is an established regulator of hematopoiesis and megakaryopoiesis (21–23). AML1 haploinsufficiency in humans impairs some aspect of megakaryopoiesis, as is also seen in mouse models (22,23). In humans, hereditary loss-of-function mutations of AML1 cause the autosomal dominant familial platelet disorder with a predisposition to develop AML (23). Most recently, it was reported that transcripts for AML1b and AML1c, the two larger isoforms of AML1, are down regulated in DS megakaryoblasts compared to non-DS megakaryoblasts, suggesting that AML1 is linked to the megakaryocytic lineage (24). In addition to its gene dosage effects, AML1 co-expresses and cooperates with GATA1 in megakaryocytic differentiation (25).
ETS2 and ERG (ETS transcription factor family members) have been shown to be overexpressed in adult myeloid leukemia cases with complex acquired karyotypes involving chromosome 21 (26). This suggests that these two genes may also play important roles in leukemogenesis in individuals with DS, since both genes are located on chromosome 21q22 within the minimal DS region (27). Consistent with this hypothesis, forced expression of ERG3 results in a phenotypic switch from erythroid to megakaryocytic development (28) such that trisomy 21 may cause developmental skewing toward the megakaryocytic lineage during hematopoietic development. This “promegakaryocytic pressure” may, in turn, enhance the selection and proliferation of hematopoietic progenitor cells with GATA1 mutations, leading to an arrest in differentiation (28).
ETS2 is ubiquitously expressed in adult tissues. In hematopoietic cells, ETS2 is abundantly expressed in monocytes and macrophages of the myeloid lineage but not in granulocytes (29), and has been implicated in regulating megakaryocytic gene expression (30), macrophage differentiation (31) and T-cell development (32). Constitutive ETS2 expression transforms NIH 3T3 cells and makes them tumorigenic (33). In prostate cancer, ETS2 is overexpressed (34) and its function is required to maintain the transformed state of human prostate cancer cells (35).
In this report, we show that transcript levels for ETS2 are significantly higher in megakaryoblasts from both DS and non-DS children with AMkL than those in myeloblasts from non-DS children with other AML subtypes. Further, for the children with AMkL, median ETS2 transcripts tended to be higher in the non-DS AMkL cases than in the DS AMkL cases. These results suggest that ETS2 may play a critical role in the development of AMkL and in the differential chemotherapy sensitivities between DS and non-DS children with AMkL. By inducibly overexpressing ETS2 in a K562 cell line model, we show that ETS2 can result in a phenotypic switch from the erythroid to megakaryocytic lineage independent of GATA1 levels, and result in altered ara-C and daunorubicin sensitivities depending on GATA1 levels. Microarray studies revealed a modulation of critical transcription factors and cytokines by ETS2 in K562 cells, which may be responsible for the observed erythroid to megakaryocytic phenotypic switch and the altered chemotherapy drug sensitivities.
MATERIAL AND METHODS
Clinical Samples
Diagnostic blast samples from DS children with AMkL (66% median blasts) and from non-DS children with AMkL (81.5% median blasts) or other subtypes of AML (84% median blasts) were obtained from the Children’s Hospital of Michigan leukemia cell bank and from the Pediatric Oncology Group 9421 study, as previously described (36,37). The diagnosis of AMkL was confirmed by flow cytometric detection of the megakaryocytic lineage antigens, CD41 and CD61. Mononuclear cells were isolated on Ficoll-Hypaque gradients to obtain highly purified cell fractions consisting mostly of leukemic blasts. Total RNAs were extracted from the samples using TRIzol reagent (Invitrogen Life Technologies, Carlsbad, CA). The research protocol was approved by the Human Investigation Committee of Wayne State University School of Medicine.
Cell Culture
The DS AMkL cell line, CMK, was obtained from the German Collection of Microorganisms and Cell Cultures (DSMZ; Braunschweig, Germany). The CMY DS AMkL cell line (established from a 21-month old DS boy with AMkL), the CTS non-DS AML cell line, and the non-DS AMkL cell line, CMS, were gifts from Dr. A. Fuse (National Institute of Infectious Diseases, Tokyo, Japan). The K562 and KG-1a erythroleukemia cell lines, the U937 non-DS monocytic AML cell line, and the Meg-01 and Dami non-DS AMkL cell lines were obtained from the American Type Culture Collection (Manassas, VA). All cell lines were cultured in RPMI 1640 with 10% calf serum (Hyclone, Logan, UT) and 2 mM L-glutamine plus 100 U/ml penicillin and 100 μg/ml streptomycin, in a 37 °C humidified atmosphere containing 5% CO2/95% air.
Expression of an Inducible ETS2 Construct in K562 Cells
A commercial “Tet-on” (Clontech, Palo Alto, CA) system was used to express ETS2 in ETS2-null K562 cells under control of a tetracycline/doxycycline (Dox)-inducible promoter (38). The K562pTet-on cell line was developed from wild-type K562 cells by transfection with the regulator pTet-on plasmid using Lipofectin (Invitrogen Life Technologies, Carlsbad, CA), as previously reported (39). To construct the pTRE2hyg/ETS2 plasmid, wild-type ETS2 cDNA from CMK cells was PCR amplified with forward (5′-AACTCGGATCCGCAGCGGCAGGATGAATGATTTCGGA-3′) and reverse (5′-AACTCCTCGAGGCTCAGGGTGGTCCCGGCGACCTCAG-3′) primers and cloned into the pTRE2hyg plasmid at the BamHI and SalI sites (underlined in the above primer sequences). The plasmid was then transfected into the K562pTet-on cell line by electroporation (200 V, 950 μF) and screened by selection with hygromycin (200 μg/ml). Colonies were isolated in soft agar, expanded in the presence of 200 μg/ml hygromycin, and tested for ETS2 expression in the presence or absence of Dox (2 μg/ml) by Western blotting, as described below. A “double-stable” resistant clone (designated KE), which exhibited no background and a high level of Dox-induced ETS2 expression, was identified and used for further analysis.
siRNA Knock-Down Experiments
The upper strand GATA1 siRNA oligo (5′-GATCCGGACAGGCCACTACCTATGTTCAAGAGACATAGGTAGTGGCCTGTCCTTA-3′) and the lower strand GATA1 siRNA oligo (5′-AGCTTAAGGACAGGCCACAACCTATGTCTCTTGAACATAGGTAGTGGCCTGTCCG-3′) were annealed and cloned into pSliencer 4.1-CMVhygro (Ambion) digested with BamHI and HindIII. The resulting plasmid and a negative control pSilencer 4.1-CMVhygro vector that expressed a hairpin siRNA with limited homology to any known sequences in the human, mouse and rat genomes (Ambion), were transfected into the KE cells, respectively, by electroporation (200 V, 950 μF) and selected with a higher dose of hygromycin (400 μg/ml) for two weeks. Colonies were isolated in soft agar, expanded in the presence of 400 μg/ml hygromycin, and tested for GATA1 expression in the absence of Dox by Western blotting and real-time RT-PCR. One colony was selected and designated KE-G. A pool of cells from the negative control transfection (designated KE-Neg) was used as the negative control for the GATA1 siRNA stable clone.
Western Blot Analysis
Soluble protein extracts were prepared by sonication in hypotonic buffer (10 mM Tris-Cl, pH 7.0), containing 1% SDS and proteolytic inhibitors, and subjected to SDS-PAGE. Separated proteins were electrophoretically transferred to PVDF membranes (DuPont) and immunoblotted with anti-ETS2 (C-20) or anti-GATA1 (N1) antibodies (Santa Cruz Biotechnology, Inc, Santa Cruz, CA), as described previously (37). Immunoreactive proteins were visualized using the Odyssey Infrared Imaging System (Li-Cor, Lincoln, NE), as described by the manufacturer.
Flow Cytometry Analysis
To determine the extent of cell differentiation of the KE and KE-G cells induced by 2 μg/ml Dox, expression of cell surface markers was measured by flow cytometry. Briefly, suspension cultures of KE or KE-G cells induced with or without 2 μg/ml Dox were resuspended in PBS+30% adult bovine serum (Sigma Chemical Co.; St. Louis, MO) at a concentration of 2 × 10⁶ cells/ml. Samples were stained in the dark at room temperature for 30 minutes with the following two-color cocktails, using the manufacturer recommended concentrations: CD36-FITC/GlycophorinA-PE, CD41-FITC/CD11b-PE, CD61-FITC/CD33-PE and CD9-FITC/CD34-PE (Coulter/Immunotech; Brea, CA). Appropriately matched isotype controls were used throughout. After staining, samples were washed in PBS, resuspended in PBS containing 0.25% formaldehyde and immediately analyzed on a Coulter XL-MCL flow cytometer equipped with an argon laser. Viable KE or KE-G cells were gated using forward and side scatter characteristics and analyzed for immunofluorescence patterns.
In vitro sensitivities of the KE-Neg and KE-G cells with or without Dox induction of ETS2
For determinations of cytotoxicities, the cell lines were cultured in complete medium with dialyzed fetal calf serum in 96-well plates at a density of 4 × 10⁴ cells/ml. Cells were cultured continuously with a range of ara-C and daunorubicin concentrations at 37 °C with or without 2 μg/ml Dox, and cell numbers were determined using the Cell Titer-blue reagent (Promega) and a fluorescence microplate reader. The IC50 values were calculated as the concentrations of drug necessary to inhibit 50% growth compared to control cells cultured in the absence of drug. The data are presented as the mean values ± standard errors from at least 3 independent experiments.
Microarray Sample Preparation and Hybridization
Prior to sample preparation, RNA quality was determined using an Agilent Bioanalyzer. Samples of total RNA were then amplified as aRNA while incorporating aminoallyl modified bases, using the TargetAMP 1-Round Aminoallyl-aRNA Amplification Kit 101 per the vendor’s protocol (Epicentre, Madison, WI). Five μg of each aminoallyl-aRNA sample was fluorescent labeled using Alexa 555 or Alexa 647 by incubating with an amine-reactive dye conjugate for 1 hour at room temperature. Unincorporated dye was removed using an RNeasy column (Qiagen, Valencia, CA). Dye incorporation efficiency was determined using a Nanodrop spectrophotometer. Agilent Whole Human Genome oligonucleotide microarrays (catalog #G4112A) were hybridized using 0.75 μg of Alexa 555 labeled aRNA and 0.75 μg of Alexa 647 labeled aRNA. Agilent’s SureHyb hybridization chambers were used in a hybridization oven and rotation rack for 17 hours at 60° C. After hybridization, the slides were washed per Agilent’s SSPE wash protocol.
Slides were scanned using an Agilent dual laser scanner with PMT settings at 100%. Tiff images were analyzed with Agilent’s feature extraction software (version 7.5). Local background subtraction and linear and LOWESS normalization were performed. The resultant data were analyzed using Rosetta Resolver (version 5.1, Rosetta Biosoftware). Features flagged as saturated in both channels or flagged as non-uniformity outliers in either channel were excluded from analysis.
On each microarray, a labeled ETS2 positive (induced) sample was co-hybridized with an oppositely labeled ETS2 negative (uninduced) sample. Two arrays were completed for each of two independent pairs of biological samples, for a total of four microarrays. One pair was created from a sample taken prior to ETS2 induction and a sample obtained at the 24 hour time point after ETS2 induction. An independent set of samples was similarly obtained using a 25 hour time point. A dye-swapped pair of arrays was completed for each pair of biological samples.
Verification of Gene Expression by Real-time RT-PCR
cDNAs were prepared from 1 μg RNA using random hexamer primers and a RT-PCR kit (Perkin Elmer Life Sciences, Boston, MA), and purified with the QIAquick PCR Purification Kit (Qiagen). ETS2, TAL1, IL1A, IL1B, ERMAP, ITGA2B, HBA2 and CSF2 transcripts were quantitated using a LightCycler real-time PCR machine (Roche, Indianaopolis, IN), as previously described (37). Briefly, PCR reactions contained 2 μl purified cDNA or standard plasmid, 4 mM MgCl2, 0.5 μM each of sense and antisense primers, and 2 μl FastStart DNA Master SYBR Green I enzyme-SYBR reaction mix (Roche). Primers and PCR conditions are described in Table S1. Real-time PCR results were expressed as mean values from 3 independent experiments using the same cDNA preparation and normalized to 18S rRNA.
Statistical Analysis
Differences in transcript levels between the DS and non-DS AML patient groups were compared using the nonparametric Mann-Whitney two-sample test. Statistical analyses were performed with GraphPad Prism 4.0.
RESULTS
Overexpression of ETS2 in both DS and non-DS Megakaryoblasts Compared to non-DS Myeloblasts
DS AML cases have several unique features including a predominance of the megakaryocytic phenotype (>90% of DS cases compared to an overall frequency of ~10% for non-DS pediatric AML cases) and uniform presence of somatic GATA1 mutations in DS AMkL (13–19). This suggests that trisomy 21 and GATA1 mutations cooperate to facilitate the development of AMkL in DS children. Overexpression of chromosome 21-localized transcription factor oncogenes including ERG, AML1 and ETS2 in DS may contribute to the megakaryocytic phenotype in DS leukemia cases. This hypothesis has been in part supported by studies from Rainis et al. (28), who showed that overexpression of ERG3 in K562 cells resulted in an erythroid to megakaryocytic phenotypic “switch”.
Based on the gene dosage effect of three copies of chromosome 21 in DS cells, it is predicted that transcript levels for chromosome 21-localized genes including ETS2 would be 1.5-fold higher in DS AMkL compared to non-DS AMkL cases. When measured by real-time RT-PCR, median ETS2 transcript levels in DS (n=20) megakaryoblasts were significantly higher (1.8-fold, p=0.027) than those in non-DS AML blasts (n=52, excluding non-DS AMkL cases) (Figure 1, panel A). Interestingly, median ETS2 transcripts were also higher in non-DS AMkL cases [4.1-fold higher (p=0.013)] than those in non-DS AML blasts. Further, there was an obvious trend toward higher median ETS2 transcript levels (2.3-fold, p=0.16) in the non-DS AMkL cases compared to the DS AMkL cases. However, this difference was not quite statistically significant, likely due to the sample size.
Figure 1. Overexpression of ETS2 in Down syndrome (DS) and non-DS (NDS) megakaryoblasts compared to NDS AML blasts.
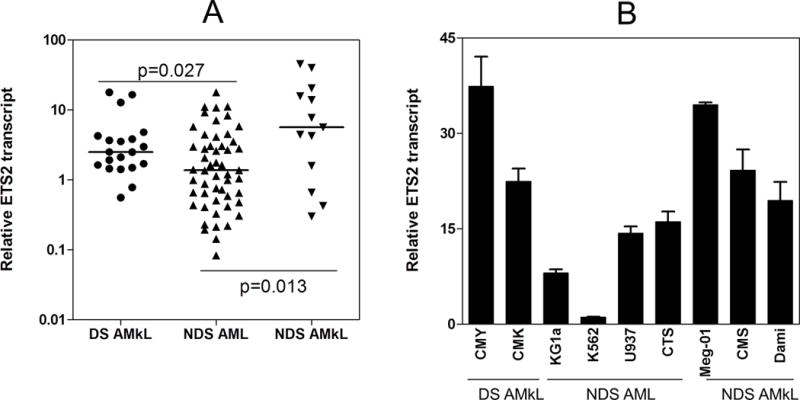
Panel A: ETS2 transcript levels in megakaryoblasts, obtained from newly diagnosed DS and NDS children with AMkL, and in myeloblasts from newly diagnosed NDS children with AML, were measured by real time RT-PCR. ETS2 transcript levels were normalized to 18S rRNA levels and are presented as the average values from 2 independent experiments. The horizontal lines indicate median ETS2 transcript levels in each group of patient samples. The p values were determined by the nonparametric Mann Whitney U test. Panel B: ETS2 transcript levels in DS (CMK and CMY) and NDS (Meg-01, CMS and Dami) megakaryocytic leukemia cell lines and NDS AML cell lines (KG1a, K562, U937 and CTS) were measured by real time RT-PCR and normalized to 18S rRNA. The data are presented as average values ± standard errors from 3 independent experiments.
Analogous to primary patient samples, ETS2 transcript levels were also higher in DS (CMK, CMY) and non-DS AMkL (Meg-01, Dami, CMS) cell lines overall, compared to non-DS AML cell lines (KG1a, K562, U937, CTS) (Figure 1, panel B). Collectively, these results suggest that overexpression of ETS2 in AMkL relative to other subtype AMLs may play an important role in AMkL biology overall.
Inducible Expression of ETS2 in K562 Cells Results in an Erythroid to Megakaryocytic Phenotypic Switch
To further investigate the role of ETS2 in AMkL, an ETS2 Dox-inducible expression system, K562pTet-on/ETS2, was generated (designated KE) in the human erythroleukemia cell line, K562, which has potential to differentiate into either erythroid or megakaryocytic lineage cells (40). When the KE cells were induced by 2 μg/ml Dox, ETS2 protein levels increased in a time-dependent manner with the protein level peaking at 25h (Figure 2, panel A, upper panel). To determine the optimal concentration of Dox, the KE cells were induced with a range of Dox concentrations for 24h. Western blot analyses established 2 μg/ml to be the optimal concentration of Dox to induce the highest level of ETS2 protein in the cells (Figure 2, panel A, lower panel).
Figure 2. Development of the KE cell line and induction of an erythroid to megakaryocytic phenotypic switch with ETS2 expression.
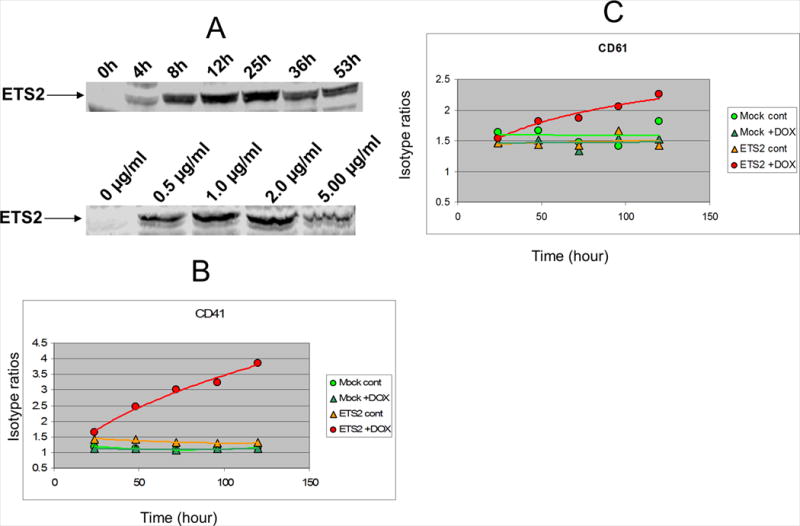
The erythroleukemia cell line, K562, was previously transfected with pTet-on to generate the K562pTet-on stable clone (36). The K562pTet-on stable clone was then transfected with pTRE2hyp-ETS2 by electroporation (200 V, 950 μF) to generate the K562pTet-on/ETS2 stable clone (designated KE). ETS2 protein levels were assayed on Western blots with an anti-ETS2 antibody. The time dependence with 2 μg/ml Dox (panel A, upper panel) and the Dox concentration dependence at 24h (panel A, lower panel) for optimal induction of ETS2 expression in the KE cells were determined. In panels B and C, the KE cells were induced by 2 μg/ml Dox for up to 120 h and subjected to flow cytometry analysis of megakaryocytic cell surface markers (CD41 and CD61, respectively) every 24 h, as described in the Materials and Methods.
To determine the effects of ETS2 on differentiation of K562 cells, the KE cells were induced with 2 μg/ml Dox for up to 120 h and subjected to flow cytometry analysis every 24 h to determine the expression levels for the megakaryocyte-specific cell surface antigens, CD41 and CD61, and the erythroid marker, glycophorin A. Induction of ETS2 coincided with increased expression of CD41 (Figure 2, panel B) and CD61 (Figure 2, panel C), and decreased glycophorin A (data not shown) expression compared to uninduced cells or mock transfectants (with or without induction). These results provide additional evidence of a linkage between ETS2 and megakaryocytic leukemia, and support the notion of a erythroid to megakaryocytic phenotypic switch of K562 cells with increased ETS2 expression.
ETS2 Induction on Megakaryocytic Differentiation of K562 Cells may be GATA1 Independent
To explore whether the effects of ETS2 on K562 cell differentiation were GATA1-dependent, siRNA silencing GATA1 expression was performed in the KE cells; the resulting cell lines were designated KE-Neg and KE-G, respectively. As shown in panels A and B of Figure 3, stable expression of GATA1 siRNA in the KE cells resulted in ~50% decrease of both GATA1 transcripts and protein compared to the KE-Neg cells expressing a non-target negative control siRNA. Knockdown of GATA1 had at most only a minor effect on the inducible expression of ETS2 in the KE cells (Figure 3, panel C).
Figure 3. siRNA silencing of GATA1 in KE cells.
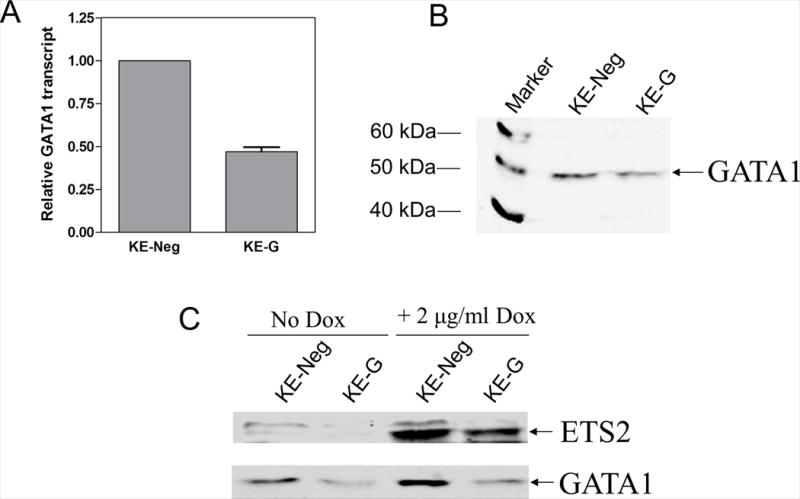
Double strand GATA1 siRNA oligo was cloned into pSliencer 4.1-CMVhygro (Ambion) cut with BamHI and HindIII. The resulting plasmid and a negative control pSilencer 4.1-CMVhygro vector were transfected into the KE cells by electroporation and selected with high dose hygromycin (400 μg/ml) for two weeks. Colonies were isolated in soft agar, expanded in the presence of 400 μg/ml hygromycin, tested for GATA1 expression in the absence of Dox by real-time RT-PCR (panel A) and Western blotting (panel B). One colony was chosen and designated KE-G. A pool of cells from the negative control transfection (designated KE-Neg) was used as the negative control of the GATA1 siRNA stable clone. siRNA knockdown of GATA1 had at the most a minor impact on the inducible expression of ETS2 in the KE-G cells compared to the KE-Neg cells (panel C).
The effects of ETS2 induction on the expression of megakaryocytic surface markers were identical in the negative control KE-Neg cells (Figure 4, panels A and B) and normal KE cells (Figure 2). GATA1 knockdown resulted in decreased expression of CD41 in the KE-G cells in the absence of ETS2 induction (Figure 4, panels A and C). However, in spite of this, a decrease of GATA1 expression did not affect the induction of cell differentiation towards the megakaryocytic lineage accompanying ETS2 induction (Figure 4, panels C and D).
Figure 4. Decreased expression of GATA1 in KE cells did not alter the effects of ETS2 on megakaryocytic differentiation.
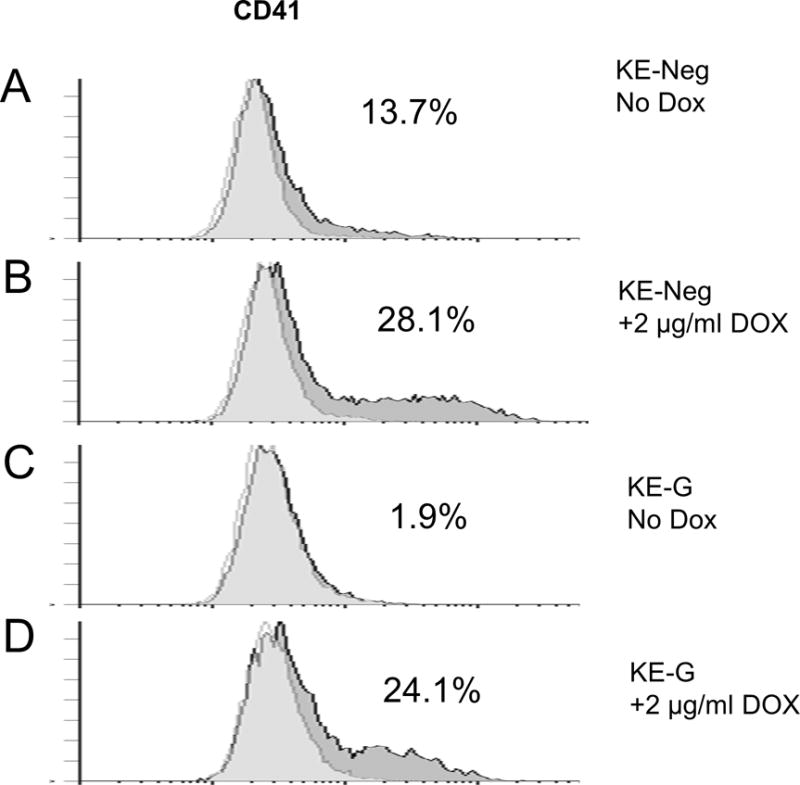
The KE-Neg and KE-G cells were induced by 2 μg/ml Dox (panels B and D) or vehicle (water) (panels A and C) for 72 h and then subjected to flow cytometry analysis of megakaryocytic cell surface marker, CD41. The percentages on each panel indicate the percentage of CD41 cells.
Determination of ETS2 Target Genes in K562 Cells by Microarray Analysis
To identify genes potentially linked to the apparent erythroid to megakaryocytic phenotypic switch resulting from induced ETS2 expression in the K562 cells, oligonucleotide microarray analysis was performed on two independent pairs of total RNA samples isolated from induced (2 μg/ml Dox for 24 h) and uninduced KE cells. Average log ratios representing the difference in expression between ETS2-expressing and ETS2-null samples were derived for each array feature by combining the replicate array data, using the error-weighted algorithm of Rosetta Resolver (41). Differentially expressed genes were identified by their p-values, calculated with the Resolver error-model and the replicate data. Features (probes) with a p-value ≤ 0.005 were considered statistically significant. Using this cutoff, 4505 features were identified as differentially expressed (data not shown). Given the p-value and the number of features on the array, approximately 205 features would be expected to have a significant p-value by chance (i.e., false positives), indicating that the false discovery rate (FDR) was very stringent at 4.6%. To further reduce false positives, we filtered the set of 4505 features to select only those having a minimum ±1.5 fold change. This resulted in the identification of 1683 features that were used in our subsequent analysis (Table S2).
Verification of Microarray Data by Real-time RT-PCR
To validate the differentially expressed genes identified by microarrays, real-time RT-PCR was used with the same RNA samples used in the microarray analyses from induced and uninduced KE cells. Several representative genes from the microarray analysis (Table S2) associated with a switch from an erythroid to a megakaryocytic phenotype were either under or overexpressed in the induced KE cells relative to the uninduced cells. Erythroblast membrane-associated protein (ERMAP; NM_018538) and hemoglobin alpha 2 (HBA2; NM_000517) genes were chosen from the underexpressed group, and ETS2, integrin alpha 2b (ITGA2B, platelet glycoprotein IIb of IIb/IIIa complex, antigen CD41B; NM_000419), T-cell acute lymphocytic leukemia 1 (TAL1; NM_003189), interleukin 1α (IL1A; NM_000575), interleukin 1β (IL1B; NM_000576) and granulocyte-macrophage colony stimulating factor 2 (CSF2; NM_000758) genes were selected from the upregulated group. Our real-time RT-PCR results (Figure 5, panel A) indicate that the differences in transcript levels for ERMAP, HBA2, ITGA2B, ETS2, IL1A, IL1B, CSF2 and TAL1 were all statistically significant between the induced and un-induced KE cells, consistent with our microarray data. When expression patterns were determined in a time course experiment (Figure 5B), gene expression levels (lower panel) paralleled changes in ETS2 protein levels (upper panel).
Figure 5. Validation of microarray results by real time RT-PCR.
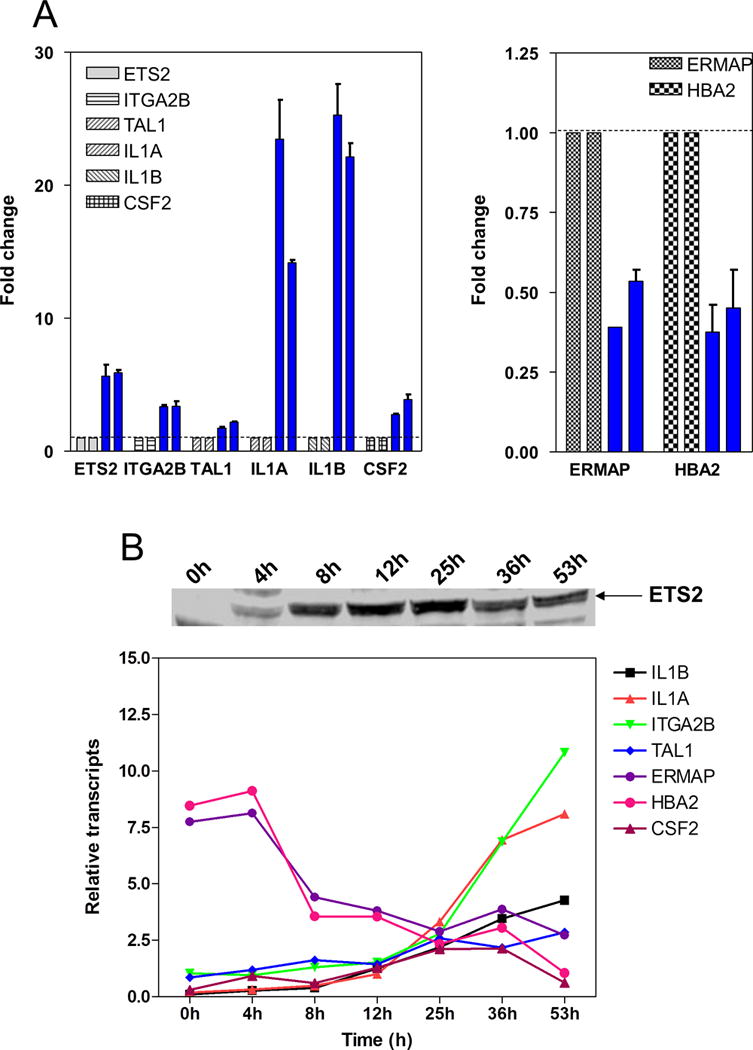
Several representative genes (ETS2, ITGA2B, TAL1, IL1A, IL1b, CSF2, HBA2 and ERMAP) were selected from the 1683 probes identified in the microarray analysis which were either under or over expressed in the induced KE cells relative to the uninduced cells. Panel A: transcript levels of ETS2, ITGA2B, TAL1, IL1A, IL1B, CSF2, HBA2 and ERMAP in two pairs of RNA samples (same as the microarray samples) from induced (blue bars) and uninduced KE cells were quantitated by real time RT-PCR and normalized to 18S rRNA. Results are presented as the average values ± standard errors from three independent experiments. Transcript levels for the above genes were set as 1 in the uninduced KE cells, as indicated by a dotted line. Panel B: transcript levels of ETS2, ITGA2B, TAL1, IL1A, IL1B, CSF2, HBA2 and ERMAP in the RNA samples from the time course experiment shown in panel A of Figure 2 were quantitated by real time RT-PCR and normalized to 18S rRNA.
ETS2 Modulates Hematopoietic Lineage Genes and Transcriptional Regulator Genes in K562 Cells
Amongst the 1683 probes differentially expressed between induced and uninduced KE cells identified by microarray, was a group of hematopoietic lineage genes including membrane metallo-endopeptidase (antigen CD10), integrin alpha4 (ITGA4, antigen CD49D), CD36 (oxidized fatty acid transporter, thrombospondin receptor), CD33 (siglec-3; sialic acid-binding immunoglobin-like lectin), ITGA2B (antigen CD41B), integrin beta3 (ITGB3, antigen CD61), IL1A, IL1B, and CSF2 (Table 1). Interestingly, ETS2 differentially regulates a large group of transcriptional regulators in the K562 cells (Table S3). Of these transcriptional regulators, TAL1, Kruppel-like factor 1 (erythroid, KLF1, also known as EKLF) and nuclear factor-erythroid 2 (NFE2) are known to be critical regulators of erythropoiesis or megakaryopoiesis.
TABLE 1.
Modulation of hematopoietic cell lineage genes by ETS2 in K562 cells determined by microarray analysis.
| Fold Change | Primary Sequence Name | Sequence Description | P-value |
|---|---|---|---|
| −2.903 | HBA2 | hemoglobin, alpha 2 | 2.72E-12 |
| −2.303 | ERMAP | Erythroblast membrane-associated protein | 6.31E-08 |
| −1.874 | MME | membrane metallo-endopeptidase (neutral endopeptidase, enkephalinase, CALLA, CD10) | 1.32E-06 |
| −1.755 | ITGA4 | integrin, alpha 4 (antigen CD49D, alpha 4 subunit of VLA-4 receptor) | 0.001 |
| −1.748 | CD36 | CD36 antigen (collagen type I receptor, thrombospondin receptor) | 6.47E-21 |
| −1.545 | AL833104 | Homo sapiens mRNA; cDNA DKFZp313N2115 (from clone DKFZp313N2115), with glycophorin A feature sequence. | 1.4E-05 |
| 1.605 | ITGA2B | integrin, alpha 2b (platelet glycoprotein IIb of IIb/IIIa complex, antigen CD41B) | 1.33E-11 |
| 1.839 | CD33 | CD33 antigen (gp67) | 1.7E-27 |
| 1.855 | CD33 | CD33 antigen (gp67) | 6.26E-12 |
| 1.941 | ITGA2B | integrin, alpha 2b (platelet glycoprotein IIb of IIb/IIIa complex, antigen CD41B) | 2.8E-44 |
| 2.406 | ITGB3 | integrin, beta 3 (platelet glycoprotein IIIa, antigen CD61) | 1.08E-05 |
| 2.568 | CSF2 | colony stimulating factor 2 (granulocyte-macrophage) | 2.53E-10 |
| 9.372 | IL1B | interleukin 1, beta | 0 |
| 10.637 | IL1A | interleukin 1, alpha | 0 |
These results further confirm the erythroid to megakaryocytic phenotypic switch of K562 cells accompanying ETS2 induction. Upregulation of cytokines (e.g. IL1 and CSF2) and modulation of transcription factor genes (e.g. TAL1 and KLF1) by ETS2 in K562 cells may provide a molecular basis for the phenotypic switch resulting from ETS2 overexpression.
Implication of Cooperation between ETS2 and GATA1 in Sensitivities of Ara-C and Daunorubicin
Studies from our group and others have demonstrated that DS megakaryoblasts are significantly more sensitive in vitro to both ara-C and daunorubicin, the two main drugs used in the treatment of AML, compared to non-DS megakaryoblasts and non-DS myeloid blasts (10–12). This indicates that chromosome 21-localized genes somehow contribute to these unique patterns of drug activity. The uniform detection of GATA1 exon 2 mutations in DS AMkL implies that GATA1 mutations and loss of GATA1 function for GATA1s may also be involved in the enhanced drug sensitivities in DS AMkL. This is suggested by our findings of increased resistance to ara-C and daunorubicin accompanying stable overexpression of GATA1 in the DS AMkL cell line, CMK (37). It is also possible that chromosome 21 localized genes (e.g. ETS2) may interact with GATA1s protein to modulate ara-C and daunorubicin sensitivities in DS AMkL.
To explore the relationship between levels of ETS2 and GATA1 and chemotherapy sensitivity of AMkL, growth inhibitions by ara-C and daunorubicin were determined in the KE-Neg and KE-G cells with or without Dox induction of ETS2. In the KE-Neg cells, induction of ETS2 resulted in 3-fold increased ara-C sensitivity compared to uninduced cells. (Figure 6A). However, in the KE-G cells with decreased GATA1 levels (compared to the KE-Neg cells), induction of ETS2 was accompanied by decreased ara-C drug sensitivity (Figure 6B). Interestingly, reduced GATA1 expression in the absence of ETS2 overexpression is functionally neutral in this system (Figure 6). Analogous results were obtained with daunorubicin in the KE-Neg and KE-G cells (data not shown). These findings strongly imply that ETS2 and GATA1 functionally cooperate so as to determine ara-C and daunorubicin sensitivities in KE-G cells, and by extension to AMkL.
Figure 6. In vitro ara-C sensitivities of the KE-Neg (panel A) and KE-G (panel B) cells with or without Dox induction of ETS2.

For determinations of cytotoxicities, the cell lines were cultured in complete medium with dialyzed fetal calf serum in 96-well plates at a density of 4 × 10⁴ cells/ml. Cells were cultured continuously with a range of cytosine arabinoside (ara-C) concentrations at 37 °C with or without 2 μg/ml Dox and cell numbers were determined using the Cell Titer-blue reagent (Promega) and a microplate reader. The IC50 values were calculated as the concentrations of drug necessary to inhibit 50% growth compared to control cells cultured in the absence of drug. The data are presented as the mean values ± standard errors from at least 3 independent experiments. By paired T-test, the differences in ara-C IC50s for induced and uninduced cells were statistically significant
DISCUSSION
In the present study, we demonstrated that ETS2, a member of the ETS transcription factor family, may play a critical role in the biology of AMkL, analogous to the ERG gene (28). Real-time RT-PCR analysis established that median ETS2 transcripts were overexpressed in both DS and non-DS AMkL cases compared to other subtypes of AML cases. Interestingly, for the children with AMkL, there was a clear trend toward higher median ETS2 transcripts (median 2.3-fold) in the non-DS AMkL cases compared to the DS AMkL cases, in spite of the differences in gene dosage. This is analogous to another chromosome 21-localized gene, AML1, which was downregulated in DS AMkL compared to non-DS AMkL (24).
Using an inducible expression system in K562 cells, we found that overexpression of ETS2 was associated with increased expression of the megakaryocytic cell surface markers, CD41 and CD61, independent of GATA1 levels. This suggests that ETS2 may play important roles in the AMkL phenotype in both DS and non-DS children. By microarray and real-time RT-PCR analyses, we found that ETS2 overexpression in K562 cells was associated with increased expression of megakaryopoiesis-associated cytokines such as IL1A, IL1B and CSF2, involved in early maturation of megakaryocytes, and with altered expression of transcription factors important for erythropoiesis and megakaryopoiesis, such as TAL1, KLF1 and NF-E2.
IL1 is an important cytokine mediator of many immunologic and inflammatory responses during bacterial infection, as well as proliferative and reconstructive responses during wound healing (42). CSF2 is a cytokine that stimulates proliferation, differentiation, and function of myeloid progenitor cells (43). IL1 and CSF2 enhance megakaryocytic colonies in vitro (43), suggesting that IL1 and CSF2 may play important roles in megakaryocytic differentiation.
TAL1 is a member of the basic helix-loop-helix family of transcription factors (44), which plays an essential role in early hematopoiesis and megakaryopoiesis (44–46). Increased expression of TAL1 accompanying induction of ETS2 in the KE cells may be another critical contribution to the megakaryocytic differentiation. KLF1 (or EKLF) is a zinc finger transcription factor that plays very important roles in erythropoiesis by regulating the β-globin gene (47–49). In the KE cells, overexpression of ETS2 significantly repressed KLF1 expression (Table S3), followed by decreased transcript levels for β-globin (Table S2). Thus, ETS2 overexpression can repress erythropoiesis by downregulating KLF1. NFE2 is a bZIP transcription factor expressed in erythroid, megakaryocytic and mast cells, which is critical for production of platelets, the final process of megakaryocyte maturation, by regulating its target gene, β-tubulin (50). Interestingly, NFE2 is downregulated in the KE cells upon induction of ETS2 (Table S3), followed by decreased expression of β-tubulin (Table S2). Therefore, elevated expression of ETS2 may impair the terminal differentiation of megakaryocytes and affect production of platelets through downregulation of NFE2 and β-tubulin.
The significantly enhanced in vitro sensitivity to chemotherapy drugs (ara-C and daunorubicin) in DS megakaryoblasts compared to non-DS megarkyoblasts (10) suggests that trisomy 21 and GATA1 mutations may somehow cooperate to modulate chemotherapy drug activity toward DS megakaryoblasts. However, this has not been previously tested. In the present study, we found that silencing GATA1 while simultaneously overexpressing ETS2 resulted in decreased sensitivity to chemotherapy drugs. While the molecular basis for this surprising result is unclear, it nonetheless implies that GATA1 and ETS2 are functionally intertwined so as to modulate ara-C and daunorubicin sensitivities. Indeed, the increased resistance to ara-C and daunorubicin resulting from induction of ETS2 in the KE-G cell line model suggests that elevated ETS2 may actually be an unfavorable determinant of chemotherapy sensitivity in DS AMkL. This would be minimized by the downregulation of ETS2 in DS AMkL compared to non-DS AMkL, as implied by our results in a small number of AMkL patient specimens. Of course, validation of this hypothesis will require further experiments in appropriate DS AMkL cell line models to identify the complex mechanisms responsible for the significantly enhanced chemotherapy sensitivities in DS AMkL compared to non-DS AMkL (10).
In summary, our results with KE and KE-G cell line models suggest that ETS2 likely contributes to the AMkL phenotype in both DS and non-DS children. Further, an apparent cooperation between ETS2 and GATA1 was implied that results in significantly altered sensitivities to chemotherapy drugs used for AMkL, such as ara-C and daunorubicin.
Supplementary Material
Acknowledgments
We thank the Children’s Oncology Group AML Biology Subcommittee for providing the clinical specimens that made this study possible. This study is dedicated in memory of Charles O’Brien for his longstanding support of childhood cancer research.
Supported by grants (RO1 CA92308 and RO1 CA120772), from the National Cancer Institute, the Leukemia and Lymphoma Society, Leukemia Research Life, BPCT Golf Charity, The Elana Fund, Justin’s Gift Charity, the Dale Meyer Endowment for Leukemia Research, The Ryan Gibson Foundation and The Ring Screw Textron Chair in Pediatric Cancer Research. Microarray data analysis was supported by the Microarray and Bioinformatics Facility Core, Wayne State University, NIEHS Center Grant P30 ES06639. J.W.T. is a Scholar in Clinical Research of the Leukemia and Lymphoma Society. Y.G. is a recipient of a Research Award from the Children’s Leukemia Foundation of Michigan and a Research Award from the Children’s Research Center of Michigan. S.P. was supported by T32 CA009531.
Footnotes
Supplementary Information accompanies the paper on the Leukemia website (http://www.nature.com/leu).
References
- 1.Taub JW. Relationship of chromosome 21 and acute leukemia in children with Down syndrome. J Pediatr Hematol Oncol. 2001;23:175–178. doi: 10.1097/00043426-200103000-00012. [DOI] [PubMed] [Google Scholar]
- 2.Zeller B, Gustafsson G, Forestier E, Abrahamsson J, Clausen N, Heldrup J, et al. Acute leukaemia in children with Down syndrome: a population-based Nordic study. Br J Haematol. 2005;128:797–804. doi: 10.1111/j.1365-2141.2005.05398.x. [DOI] [PubMed] [Google Scholar]
- 3.Ravindranath Y, Abella E, Krischer JP, Wiley J, Inoue S, Harris M, et al. Acute myeloid leukemia (AML) in Down’s syndrome is highly responsive to chemotherapy: experience on Pediatric Oncology Group AML study 8498. Blood. 1992;80:2210–2214. [PubMed] [Google Scholar]
- 4.Ravindranath Y, Yeager AM, Chang MN, Steuber CP, Krischer J, Graham-Pole J, et al. Acute myeloid leukemia in children: a randomized comparative study of purged autologous bone marrow transplantation versus intensive multiagent consolidation chemotherapy in first remission (Pediatric Oncology Group Study-POG 8821) N Engl J Med. 1996;334:1428–1434. doi: 10.1056/NEJM199605303342203. [DOI] [PubMed] [Google Scholar]
- 5.Lange BJ, Kobrinsky N, Barnard DR, Arthur DC, Buckley JD, Howells WB, et al. Distinctive demography, biology, and outcome of acute myeloid leukemia and myelodysplastic syndrome in children with Down syndrome: Children’s Cancer Group Studies 2861 and 2891. Blood. 1998;91:608–615. [PubMed] [Google Scholar]
- 6.Gamis AS, Woods WG, Alonzo TA, Buxton A, Lange B, Barnard DR, et al. Children’s Cancer Group Study 2891. Increased age at diagnosis has a significantly negative effect on outcome in children with Down syndrome and acute myeloid leukemia: a report from the Children’s Cancer Group Study 2891. J Clin Oncol. 2003;21:3415–3422. doi: 10.1200/JCO.2003.08.060. [DOI] [PubMed] [Google Scholar]
- 7.Creutzig U, Reinhardt D, Diekamp S, Dworzak M, Stary J, Zimmermann M. AML patients with Down syndrome have a high cure rate with AML-BFM therapy with reduced dose intensity. Leukemia. 2005;19:1355–1360. doi: 10.1038/sj.leu.2403814. [DOI] [PubMed] [Google Scholar]
- 8.Zipursky A, Thorner P, De Harven E, Christensen H, Doyle J. Myelodysplasia and acute megakaryoblastic leukemia in Down’s syndrome. Leuk Res. 1994;18:163–171. doi: 10.1016/0145-2126(94)90111-2. [DOI] [PubMed] [Google Scholar]
- 9.Kojima S, Sako M, Kato K, Hosoi G, Sato T, Ohara A, et al. An effective chemotherapeutic regimen for acute myeloid leukemia and myelodysplastic syndrome in children with Down’s syndrome. Leukemia. 2000;14:786–791. doi: 10.1038/sj.leu.2401754. [DOI] [PubMed] [Google Scholar]
- 10.Ge Y, Dombkowski AA, LaFiura KM, Tatman D, Yedidi RS, Stout ML, et al. Differential gene expression, GATA1 target genes, and the chemotherapy sensitivity of Down syndrome megakaryocytic leukemia. Blood. 2006;107(4):1570–81. doi: 10.1182/blood-2005-06-2219. [DOI] [PMC free article] [PubMed] [Google Scholar]
- 11.Zwaan CM, Kaspers GJ, Pieters R, Hahlen K, Janka-Schaub GE, van Zantwijk CH, et al. Different drug sensitivity profiles of acute myeloid and lymphoblastic leukemia and normal peripheral blood mononuclear cells in children with and without Down syndrome. Blood. 2002;99:245–51. doi: 10.1182/blood.v99.1.245. [DOI] [PubMed] [Google Scholar]
- 12.Frost BM, Gustafsson G, Larsson R, Nygren P, Lonnerholm G. Cellular cytotoxic drug sensitivity in children with acute leukemia and Down’s syndrome: an explanation to differences in clinical outcome? Leukemia. 2000;14:943–4. doi: 10.1038/sj.leu.2401753. [DOI] [PubMed] [Google Scholar]
- 13.Wechsler J, Greene M, McDevitt MA, Anastasi J, Karp JE, Le Beau MM, et al. Acquired mutations in GATA1 in the megakaryoblastic leukemia of Down syndrome. Nat Genet. 2002;32:148–152. doi: 10.1038/ng955. [DOI] [PubMed] [Google Scholar]
- 14.Mundschau G, Gurbuxani S, Gamis AS, Greene ME, Arceci RJ, Crispino JD. Mutagenesis of GATA1 is an initiating event in Down syndrome leukemogenesis. Blood. 2003;101:4298–4300. doi: 10.1182/blood-2002-12-3904. [DOI] [PubMed] [Google Scholar]
- 15.Hitzler JK, Cheung J, Li Y, Scherer SW, Zipursky A. GATA1 mutations in transient leukemia and acute megakaryoblastic leukemia of Down syndrome. Blood. 2003;101:4301–4304. doi: 10.1182/blood-2003-01-0013. [DOI] [PubMed] [Google Scholar]
- 16.Rainis L, Bercovich D, Strehl S, Teigler-Schlegel A, Stark B, Trka J, et al. Mutations in exon 2 of GATA1 are early events in megakaryocytic malignancies associated with trisomy 21. Blood. 2003;102:981–986. doi: 10.1182/blood-2002-11-3599. [DOI] [PubMed] [Google Scholar]
- 17.Groet J, McElwaine S, Spinelli M, Rinaldi A, Burtscher I, Mulligan C, et al. Acquired mutations in GATA1 in neonates with Down’s syndrome with transient myeloid disorder. Lancet. 2003;361:1617–1620. doi: 10.1016/S0140-6736(03)13266-7. [DOI] [PubMed] [Google Scholar]
- 18.Xu G, Nagano M, Kanezaki R, Toki T, Hayashi Y, Taketani T, et al. Frequent mutations in the GATA1 gene in the transient myeloproliferative disorder of Down’s syndrome. Blood. 2003;102:2960–2968. doi: 10.1182/blood-2003-02-0390. [DOI] [PubMed] [Google Scholar]
- 19.Ahmed M, Sternberg A, Hall G, Thomas A, Smith O, O’Marcaigh A, et al. Natural history of GATA1 mutations in Down Syndrome. Blood. 2004;103:2480–2489. doi: 10.1182/blood-2003-10-3383. [DOI] [PubMed] [Google Scholar]
- 20.Peterson LF, Zhang DE. The 8;21 translocation in leukemogenesis. Oncogene. 2004;23:4255–4262. doi: 10.1038/sj.onc.1207727. [DOI] [PubMed] [Google Scholar]
- 21.Michaud J, Scott HS, Escher R. AML1 interconnected pathways of leukemogenesis. Cancer Investigation. 2003;21:105–136. doi: 10.1081/cnv-120018821. [DOI] [PubMed] [Google Scholar]
- 22.Okuda T, van Deursen J, Hiebert SW, Grosveld G, Downing JR. AML1, the target of multiple chromosomal translocations in human leukemia, is essential for normal fetal liver hematopoiesis. Cell. 1996;84:321–330. doi: 10.1016/s0092-8674(00)80986-1. [DOI] [PubMed] [Google Scholar]
- 23.Song WJ, Sullivan MG, Legare RD, Hutchings S, Tan X, Kufrin D, et al. Haploinsufficiency of CBFA2 causes familial thrombocytopenia with propensity to develop acute myelogenous leukaemia. Nat Genet. 1999;23:166–175. doi: 10.1038/13793. [DOI] [PubMed] [Google Scholar]
- 24.Bourquin JP, Subramanian A, Langebrake C, Reinhardt D, Bernard O, Ballerini P, et al. Identification of distinct molecular phenotypes in acute megakaryoblastic leukemia by gene expression profiling. Proc Natl Acad Sci U S A. 2006;103:3339–44. doi: 10.1073/pnas.0511150103. [DOI] [PMC free article] [PubMed] [Google Scholar]
- 25.Elagib KE, Racke FK, Mogass M, Khetawat R, Delehanty LL, Goldfarb AN. RUNX1 and GATA-1 coexpression and cooperation in megakaryocytic differentiation. Blood. 2003;101:4333–41. doi: 10.1182/blood-2002-09-2708. [DOI] [PubMed] [Google Scholar]
- 26.Baldus CD, Liyanarachchi S, Mrózek K, Auer H, Tanner SM, Guimond M, et al. Acute myeloid leukemia with complex karyotypes and abnormal chromosome 21: Amplification discloses overexpression of APP, ETS2, and ERG genes. Proc Natl Acad Sci USA. 2004;101:3915–3920. doi: 10.1073/pnas.0400272101. [DOI] [PMC free article] [PubMed] [Google Scholar]
- 27.Rahmani Z, Blouin JL, Creau-Goldberg N, Watkins PC, Mattei JF, Poissonnier M, et al. Critical role of the D21S55 region on chromosome 21 in the pathogenesis of Down syndrome. Proc Natl Acad Sci U S A. 1989;86:5958–62. doi: 10.1073/pnas.86.15.5958. [DOI] [PMC free article] [PubMed] [Google Scholar]
- 28.Rainis L, Toki T, Pimanda JE, Rosenthal E, Machol K, Strehl S, et al. The proto-oncogene ERG in megakaryoblastic leukemias. Cancer Res. 2005;65:7596–76025. doi: 10.1158/0008-5472.CAN-05-0147. [DOI] [PubMed] [Google Scholar]
- 29.Boulukos KE, Pognonec P, Sariban E, Bailly M, Lagrou C, Ghysdael J. Rapid and transient expression of Ets2 in mature macrophages following stimulation with cMGF, LPS, and PKC activators. Genes Dev. 1990;4:401–9. doi: 10.1101/gad.4.3.401. [DOI] [PubMed] [Google Scholar]
- 30.Lemarchandel V, Ghysdael J, Mignotte V, Rahuel C, Romeo PH. GATA and Ets cis-acting sequences mediate megakaryocyte-specific expression. Mol Cell Biol. 1993;13:668–76. doi: 10.1128/mcb.13.1.668. [DOI] [PMC free article] [PubMed] [Google Scholar]
- 31.Aperlo C, Pognonec P, Stanley ER, Boulukos KE. Constitutive c-ets2 expression in M1D+ myeloblast leukemic cells induces their differentiation to macrophages. Mol Cell Biol. 1996;16:6851–8. doi: 10.1128/mcb.16.12.6851. [DOI] [PMC free article] [PubMed] [Google Scholar]
- 32.Zaldumbide A, Carlotti F, Pognonec P, Boulukos KE. The role of the Ets2 transcription factor in the proliferation, maturation, and survival of mouse thymocytes. J Immunol. 2002;169:4873–81. doi: 10.4049/jimmunol.169.9.4873. [DOI] [PubMed] [Google Scholar]
- 33.Seth A, Watson DK, Blair DG, Papas TS. c-ets-2 protooncogene has mitogenic and oncogenic activity. Proc Natl Acad Sci U S A. 1989;86:7833–7. doi: 10.1073/pnas.86.20.7833. [DOI] [PMC free article] [PubMed] [Google Scholar]
- 34.Liu AY, Corey E, Vessella RL, Lange PH, True LD, Huang GM, et al. Identification of differentially expressed prostate genes: increased expression of transcription factor ETS-2 in prostate cancer. Prostate. 1997;30:145–53. doi: 10.1002/(sici)1097-0045(19970215)30:3<145::aid-pros1>3.0.co;2-l. [DOI] [PubMed] [Google Scholar]
- 35.Sementchenko VI, Schweinfest CW, Papas TS, Watson DK. ETS2 function is required to maintain the transformed state of human prostate cancer cells. Oncogene. 1998;17:2883–8. doi: 10.1038/sj.onc.1202220. [DOI] [PubMed] [Google Scholar]
- 36.Taub JW, Huang X, Matherly LH, Stout ML, Buck SA, Massey GV, et al. Expression of chromosome 21-localized genes in acute myeloid leukemia: differences between Down syndrome and non-Down syndrome blast cells and relationship to in vitro sensitivity to cytosine arabinoside and daunorubicin. Blood. 1999;94:1393–1400. [PubMed] [Google Scholar]
- 37.Ge Y, Stout ML, Tatman DA, Jensen TL, Buck S, Thomas RL, et al. GATA1, cytidine deaminase and the high cure rate of Down syndrome children with acute megakaryocytic leukemia. J Natl Cancer Institute. 2005;97:226–231. doi: 10.1093/jnci/dji026. [DOI] [PubMed] [Google Scholar]
- 38.Gossen M, Freundlieb S, Bender G, Müller G, Hillen W, Bujard H. Transcriptional activation by tetracyclines in mammalian cells. Science. 1995;268:1766–1769. doi: 10.1126/science.7792603. [DOI] [PubMed] [Google Scholar]
- 39.Ding BC, Whetstine JR, Witt TL, Schuetz JD, Matherly LH. Repression of human reduced folate carrier gene expression by wild type p53. J Biol Chem. 2001;276:8713–9. doi: 10.1074/jbc.M005248200. [DOI] [PubMed] [Google Scholar]
- 40.Sutherland JA, Turner AR, Mannoni P, McGann LE, Turc JM. Differentiation of K562 leukemia cells along erythroid, macrophage, and megakaryocyte lineages. J Biol Response Mod. 1986;5:250–62. [PubMed] [Google Scholar]
- 41.Weng L, Dai H, Zhan Y, He Y, Stepaniants SB, Bassett DE. Rosetta error model for gene expression analysis. Bioinformatics. 2006;22:1111–1121. doi: 10.1093/bioinformatics/btl045. [DOI] [PubMed] [Google Scholar]
- 42.Dinarello CA. Interleukin-1 and interleukin-1 antagonism. Blood. 1991;77:1627–1652. [PubMed] [Google Scholar]
- 43.Takahashi T, Tsuyuoka R, Ueda Y, Suzuki A, Ichiba S, Okuno Y, et al. Megakaryocyte potentiating activity of IL-1, IL-6 and GM-CSF as evaluated by their action on in vitro human megakaryocytic colonies. Br J Haematol. 1991;78:480–7. doi: 10.1111/j.1365-2141.1991.tb04476.x. [DOI] [PubMed] [Google Scholar]
- 44.Lecuyer E, Hoang T. SCL: from the origin of hematopoiesis to stem cells and leukemia. Exp Hematol. 2004;32:11–24. doi: 10.1016/j.exphem.2003.10.010. [DOI] [PubMed] [Google Scholar]
- 45.Mikkola HK, Klintman J, Yang H, Hock H, Schlaeger TM, Fujiwara Y, et al. Haematopoietic stem cells retain long-term repopulating activity and multipotency in the absence of stem-cell leukaemia SCL/tal-1 gene. Nature. 2003;421:547–51. doi: 10.1038/nature01345. [DOI] [PubMed] [Google Scholar]
- 46.Valtieri M, Tocci A, Gabbianelli M, Luchetti L, Masella B, Vitelli L, et al. Enforced TAL-1 expression stimulates primitive, erythroid and megakaryocytic progenitors but blocks the granulopoietic differentiation program. Cancer Res. 1998;58:562–9. [PubMed] [Google Scholar]
- 47.Faustino P, Lavinha J, Marini MG, Moi P. β-Thalassemia mutation at -90C-->T impairs the interaction of the proximal CACCC box with both erythroid and nonerythroid factors. Blood. 1996;88:3248–9. [PubMed] [Google Scholar]
- 48.Perkins AC, Sharpe AH, Orkin SH. Lethal beta-thalassaemia in mice lacking the erythroid CACCC-transcription factor EKLF. Nature. 1995;375:318–22. doi: 10.1038/375318a0. [DOI] [PubMed] [Google Scholar]
- 49.Lim SK, Bieker JJ, Lin CS, Costantini F. A shortened life span of EKLF−/− adult erythrocytes, due to a deficiency of beta-globin chains, is ameliorated by human gamma-globin chains. Blood. 1997;90:1291–9. [PubMed] [Google Scholar]
- 50.Shivdasani RA, Rosenblatt MF, Zucker-Franklin D, Jackson CW, Hunt P, Saris CJ, et al. Transcription factor NF-E2 is required for platelet formation independent of the actions of thrombopoietin/MGDF in megakaryocyte development. Cell. 1995;81:695–704. doi: 10.1016/0092-8674(95)90531-6. [DOI] [PubMed] [Google Scholar]
Associated Data
This section collects any data citations, data availability statements, or supplementary materials included in this article.