

Abstract
Detection of circulating tumor cells has emerged as a promising minimally invasive diagnostic and prognostic tool for patients with metastatic cancers. We report a novel three dimensional microfilter device that can enrich viable circulating tumor cells from blood. This device consists of two layers of parylene membrane with pores and gap precisely defined with photolithography. The positions of the pores are shifted between the top and bottom membranes. The bottom membrane supports captured cells and minimize the stress concentration on cell membrane and sustain cell viability during filtration. Viable cell capture on device was investigated with scanning electron microscopy, confocal microscopy, and immunofluorescent staining using model systems of cultured tumor cells spiked in blood or saline. The paper presents and validates this new 3D microfiltration concept for circulation tumor cell enrichment application. The device provides a highly valuable tool for assessing and characterizing viable enriched circulating tumor cells in both research and clinical settings.
Keywords: Circulating tumor cell, Microfilter, Parylene
1 Introduction
According to the American Cancer Society, cancer is projected to be the leading cause of death worldwide in 2010 (Boyle and Levin 2008). Malignancies derived from the epithelium, carcinoma, constitute the majority of the cancer incidence and over 90% of death among carcinoma patients are caused by metastatic tumors (Crnic and Christofori 2004). Metastasis is the spread of cancer from the primary site to non-adjacent secondary sites through a series of sequential steps. According to the current model, the “invasion-metastasis cascade” includes localized invasion, intravasation, transport through circulation, arrest in microvessels, extravasation, formation of a micrometastasis and dormancy, and finally angiogenesis, colonization and formation of a macrometastsis (Pantel and Brakenhoff 2004; Gupta and Massague 2006; Steeg 2006; Sahai 2007; Weinberg 2007). While the tumor cells are transported in the circulatory system, they are referred as circulating tumor cells (CTC) in bloodstream and disseminated tumor cells (DTC) in bone marrow (Braun and Naume 2005; Smerage and Hayes 2006; Alix-Panabieres et al. 2008; Pantel et al. 2008). CTCs are prognostically critical, associated with clinical stage, disease recurrence, tumor metastasis, treatment response, and patient survival following therapy (Cristofanilli et al. 2004; Cristofanilli et al. 2005; Budd et al. 2006; Hayes et al. 2006). There is a growing body of literature demonstrating CTC to be an emerging surrogate and independent marker for assessing the risk of relapse, guiding course of therapy and treatment monitoring (Hanahan and Weinberg 2000; Dirix et al. 2005; Cristofanilli and Mendelsohn 2006; Gupta and Massague 2006; Meng et al. 2006; Dawood et al. 2008; Hayes and Smerage 2008).
The main technical challenge of CTC detection arises due to its rarity, at the level of 1 CTC in 7.5 mL of blood (or 1 CTC against 1010 blood cells), making efficient enrichment a prerequisite for CTC detection in most of the cases. Various CTC enrichment methods exploit the intrinsic differences between the epithelial derived CTCs (Weinberg 2007) and hematogeneous blood cells. Traditionally, density gradient centrifugation is employed to enrich the mononucleocyte (MNCs) fraction, which includes CTCs due to their similar buoyant density (Cote et al. 1991; Baker et al. 2003; Lara et al. 2004; Pantel and Brakenhoff 2004). Interpreting the immunofluorescent staining results requires a trained pathologist to examine each slide for the presence of CTCs, which is both time consuming and subjective. Moreover, density gradient centrifugation has a maximum recovery rate of ~70%. More recent technologies take advantages of specific epithelial surface antigens such as epithelial cell adhesion molecule (EpCAM) for selective capture of CTCs. Cellsearch™ is the only FDA approved automated system to capture and assess CTCs for prognosis and treatment monitoring in metastatic breast, colorectal or prostate cancer. It is based on immunomagnetic separation (Hardingham et al. 1993; Racila et al. 1998; Benez et al. 1999; Allard et al. 2004; Lara et al. 2004; Riethdorf et al. 2007), in which EpCAM conjugated magnetic beads are used to capture EpCAM positive CTCs from blood under magnetic field. Although plenty of clinical studies substantiate its prognostic value, the assay is expensive, labor intensive and subject to a large range of recovery rates (9%–90%) (Lara et al. 2004) mainly due to variable expression of surface markers. Recently an immunoaffinity based “CTC chip”, where CTCs are captured with antibodies conjugated to surface of micro posts in a microflow chamber, has successfully demonstrated CTC capture and detection from patient samples of multiple metastatic cancers (Nagrath et al. 2007; Maheswaran et al. 2008). While viable CTCs with high purity can be obtained, the capture efficiency is limited by the variability of surface antigen expression and the throughput and processing time is limited by allowable maximal flow rate.
Alternatively, isolation of CTC based on cell size has been demonstrated to be a potentially efficient, inexpensive and quick way for CTC enrichment (Vona et al. 2000; Vona et al. 2002; Kahn et al. 2004; Vona et al. 2004; Pinzani et al. 2006), dating back to 1960s (Seal 1964; Fleischer et al. 1965). Circulating tumor cells are in most of the cases epithelial cells and believed to be significantly larger than the surrounding blood cells (Vona et al. 2000; Lara et al. 2004; Lin et al. 2008). Pore size around 8 μm in diameter has been shown to be optimal for CTC retention (Zabaglo et al. 2003). However, the previously described polycarbonate filters are fabricated using track etching (Fleischer et al. 1972), which can only generate pores at random locations. Low pore density and multiple pore fusion lead to low CTC capture efficiency (~50–60%) and frequent sample clogging on filter (Rostagno et al. 1997; Lara et al. 2004). Recently microfabricated filters have shown better promise for size based CTC enrichment. We have previously reported the utility of microfabricated single layer (2D) microfilter devices for CTC enrichment (Zheng et al. 2007; Lin et al. 2010). Filters with high density uniform circular pores were made using photolithography processes in a cost-effective way. The device has superior performance in CTC enrichment with clinical samples from metastatic cancer patients. In another study, traps in a microfluidic flow chamber capture tumor cells from blood under low shear stress with high purity and viability (Tan et al. 2009). More recently a microcavity array device made by nickel electroforming have demonstrated trapping and detection of tumor cells from blood with high capture efficiency and viability (Hosokawa et al. 2010).
Our previous version of the 2D pore microfilter device is suitable for CTC enumeration in blood from metastatic cancer patients with high recovery and short processing time; however, samples are required to be partially fixed, incompatible for further live cell interrogations. The ability to capture viable and proliferative CTC may pave the way for functional studies, such as the recently proposed cancer stem cells giving rise to relapse in cancer patients (Reya et al. 2001; Wicha et al. 2006; Stingl and Caldas 2007). The object of the current study is to capture viable tumor cells by controlling the micro environment of the trapped cells with a novel 3D device structure design.
2 Experimental
2.1 Device design
Cell membrane damage has been associated with mechanical trauma, which can be induced by passage through filter pores (Gabor and Weiss 1985; Weiss and Schmidschonbein 1989). Micropipette experiments on artificial phospholipids show membrane rupture happens when membrane tension increases above a critical level, i.e. membrane area increment exceeding 3% (Evans et al. 1979). The tension at which cell lysis occurs may be as low as 3 mN/m in these membrane models (Kwok and Evans 1981). The maximum tensions at the surfaces of seven different types of cancer cells, measured from micropipet-deformability study, have a median value of 3.7 mN/m and range from 0.8 to 5.0 mN/m (Weiss and Schmidschonbein 1989). We think for a particular tumor cell, the damage can result from either of the two stages of the filtration process. The first stage starts from when the cell begins to have interaction with the pore edge until this is fully trapped. This is a dynamic process which happens within millisecond range in our experimental conditions. The second stage is from this fully entrapment to the end of the overall filtration process. During this stage, the cell will experience the static pressure. Under 3.45×10³ Pa (0.5 psi) constant pressure we used in a previous study (2D microfilters of 8 μm diameter pore size), cytoplasm membrane tension is estimated by finite element simulation to be 13.8 mN/m at the contact circumference to the device. Compared with the critical tension for cell rupture, even this tension due to the 2nd stage static pressure can cause cell damage.
The concentrated tension stress exerted by the device edges is the primary cause for cell damage. To reduce it, the new 3D microfilter has two layers of membranes. Both the top and bottom layers have pores defined by micro-fabrication. The gap between the two layers is defined precisely by photolithography. An important feature of the device is that the pore positions of the bottom membrane are shifted from the pore positions of the top membrane. So if tumor cells are trapped in the pores of the top membrane, the bottom membrane can provide direct force in the opposite direction and effectively reduce the concentrated tension stress on cell plasma membrane (Fig. 1(a)). The tension reduction applies to both the dynamic process during which the cell is plugged into a pore, and later when the cell is under static pressure. As shown in Fig. 1(b), each microfilter patch has thirty-six 9 μm diameter pores on the top membrane and thirty-seven 8 μm diameter pores on the bottom membrane. Also the gap formed by the top and bottom membrane allows smaller flow-through cells to traverse through while blocking large cells, which effectively acts as a third critical dimension during filtration.
Fig. 1.

Device design. (a) Filtration process and forces on a trapped cell. FL: force caused by fluidic pressure from top. FS: supporting force from bottom membrane. FT: tension stress force on plasma membrane. (b) Design of a single hexagon-shaped microfilter patch
2.2 Device fabrication
To fabricate the device, first alignment marks were generated on both sides of a prime silicon wafer followed by 1 μm-thick thermal oxidation, backside oxide patterning and front-side oxide stripping as shown in Fig. 2. A 5 μm-thick parylene-C (poly(monochloro-p-xylylene), referred as parylene below) thin film was deposited on the front-side and melted at 350°C, forming a molten parylene layer that eventually integrates as part of the bottom filter and also provides front side protection during wet etching. Next on each of the 1×1 cm2 die, nine through-wafer cavities were etched by tetramethylammonium hydroxide (TMAH) from backside, with silicon dioxide as etching mask. A 2.5 μm-thick second parylene layer was deposited from both sides and patterned with oxygen plasma. In the cavity regions, the molten parylene layer was sandwiched between this second parylene layer to form the bottom filter layer. Then 6.5 μm-thick sacrificial photoresist AZ4620 was spin-coated and patterned, followed by 10 μm-thick parylene deposition and patterning from front-side, forming the top filter layer of the 3D microfilter. Finally, sacrificial photoresist was dissolved in acetone followed by a 190°C parylene annealing step to strengthen the overall structure. The pore size, shape and density in this 3D microfilter were defined by photolithography, while the gap between the top and bottom membranes was defined by the thickness of the sacrificial photoresist.
Fig. 2.
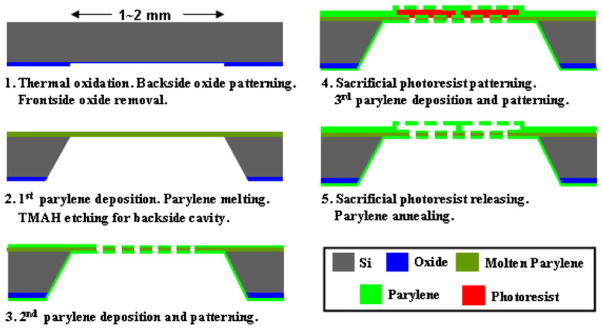
Microfabrication process flow
As shown in Fig. 3, a fabricated 3D microfilter is a 1× 1 cm2 device with two layers of parylene on a silicon substrate. The device has nine open windows of effective filtration area. The open windows are formed by wet etching of silicon substrate for form cavities. In order to maintain the gap distance during filtration, each cavity are arranged into 99 hexagonal microfilter patches as Fig. 1(b), where the top and bottom parylene membrane layers are in contact and annealed along the patch edges to provide structural support.
Fig. 3.
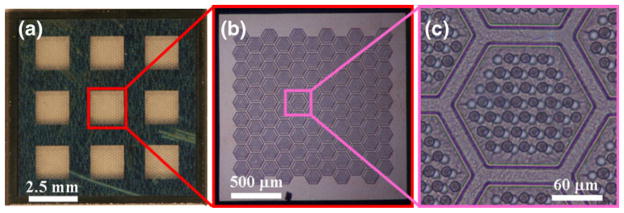
Fabricated 3D microfilter showing (a) the overall device, (b) one open window and (c) one patch
2.3 Device assembly
To introduce samples to the 3D microfilter, it is assembled into a custom made housing cassette. The microfilter is clamped between four pieces of polydimethylsiloxane (PDMS) and two machined acrylic parts (Fig. 4). The two thin PDMS pieces (~1 mm thick) have an 8×8 mm2 central square hole, which forms a chamber for sample to flow through the 3D filtration device. One of the two thick PDMS pieces (~4 mm thick) has a small circular central hole as a receiving port for sample injection directly from a syringe. The other thick PDMS piece has a large square hole open to atmosphere pressure for filtrate collection. The two acrylic pieces have a central hole of 3 mm diameter. The samples were manually pushed through the experimental assembly.
Fig. 4.

Device is assembled inside a housing cassette
2.4 Fluidic simulation of microfilter devices
Due to the complexity of the dynamic process of cell trapping, here we only studied the effects of static back pressure induced cell membrane tension during the filtration process. We compare the 2D microfilters with the 3D microfilters. For 2D microfilter devices, we simulated a membrane piece of 25 pores in a five by five array with 30 μm distance among the pores. For 3D microfilter devices, we simulated a single patch as shown in Fig. 1 (b). The modeling and simulations of the fluidic field were performed by using incompressible Navier-Stokes steady-state analysis with Comsol Multiphysics. According to the properties of human blood, the fluid density is chosen as 1025 kg/m3, and the dynamic viscosity is 3×10⁻³ Pa·s without considering the partial fixation required for the current protocol using the 2D microfilters. For the real devices, blood flows into the chamber between the top PDMS sheets and top parylene layer before it reaches the filter, so as is in the models. “Slip/symmetry” boundary conditions were used on the side walls to represent the repeated structure. No-slip boundary conditions were used for elsewhere except for inflow and outflow surface. Assuming the same equivalent total area on the 1×1 cm2 device and the same processing time of the 2D and 3D devices (7.5 mL of blood filtered in 2 min), an inflow rate of 0.002 m/s was applied on the top surface for both cases. A zero pressure condition was applied to outflow surface.
As shown in Fig. 5(a), the simulated fluid field is almost uniformly distributed on the 3D microfilter device, although the positions of the pores are shifted and the top pores themselves are not symmetrically located. Therefore, the simulation results verify that all the pores on the same patch can be efficiently used in the same way without significant edge effect.
Fig. 5.
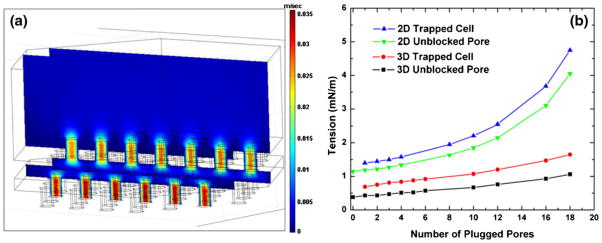
Finite element simulation. (a) Fluid field simulation of a single patch of a 3D microfilter device without cells showing the velocity field. (b) Calculated tensions on the rim of an empty pore and a plugged cell for 2D and 3D microfilter devices
We also simulated cases where an increasing number of cells are plugged in the pores surrounding a central open pore (Fig. 5(b)). For simplicity, we made the filter membrane continuous at the plugged pore position without using any cell geometry. Pressure was measured locally at the surrounding plugged pores to estimate the tension on a trapped cell, and at the central open pore to estimate the tension on an unblocked pore. For comparison with the critical membrane tension, the pressure differences are converted to tension according to , where r is the radius of the pore. The tension on a trapped cell is an estimation of the tension of cell membrane at the pore edge after it plugs under the applied static back pressure. For 3D microfilter case, we did not consider the supporting force on a trapped cell from the bottom membrane and instead just using the local pressure on the surface of the bottom membrane. The real membrane tension for the 3D cases should be even smaller. As shown in the simulation, this overestimated tension on cell for the 3D devices is only about 50% or smaller compared with that of the 2D devices. The tension on a trapped cell for 2D devices is in the range of the critical membrane tension of tumor cells mentioned earlier, which suggests even the static pressure can damage the cells due to plasma membrane rupture. Tension on unblocked pore is calculated from the local pressure for an open pore with some of its neighboring pores being blocked. Higher local pressure on unblocked pore is likely to cause larger cell membrane tension during the dynamic process of cell plugging into the pore, thus causing cell damage. The local pressure on unblocked pore of 2D devices is about 3 times larger than that of the 3D devices, which suggests cells are more likely to be damaged during the dynamic trapping process in 2D devices compared with the 3D devices.
2.5 SEM sample preparation
Sodium cacodylate, glutaraldehyde, and osmium tetroxide were all purchased from Polysciences, Warrington, PA, USA. After sample filtration, the device was first rinsed in Dulbecco’s phosphate buffered saline (PBS) for two minutes and replaced with primary glutaraldehyde fixative (0.1 M sodium cacodylate, 5% glutaraldehyde, 0.1 M sucrose, pH 7.4 in PBS) in fume hood for 45 min with occasionally gentle mixing. The glutaraldehyde fixative was later removed and replaced with buffered sucrose vehicle (0.1 M sodium cacodylate, 0.1 M sucrose, pH 7.4) for 30 min followed by incubation with secondary osmium fixative (0.1 M sodium cacodylate, 0.1 M sucrose, 1% osmium tetroxide, pH 7.4) for 60 min. Dehydration and drying procedure started with 5 min distilled water wash twice, followed by sequentially immersing the device in 35%, 70%, 85%, and 95% ethanol for 10 min each, and 100% ethanol for 20 min. Finally the device was inserted in 100% hexamethyldisilazane (HMDS) for 5 min and kept in desiccator before observation with an Oxford LEO 1550VP field emission scanning electron microscope (SEM).
2.6 Cell culture and live cell labeling
Human prostate adenocarcinoma cell line (LNCaP) and human breast adenocarcinoma cell line (MCF-7) were purchased from American Type Culture Collection (Manassas, VA, USA) and cultured using recommended media and conditions in a humidified incubator at 5% CO2 and 37°C. Adherent cells were harvested using GIBCO® Trypsin-EDTA (Invitrogen, Carlsbad, CA, USA) and cell counts were assessed using hemocytomter. Harvested cells were washed twice in PBS and resuspended to concentration of ~106 cells/mL. Cells were labeled with carboxyfluorescein diacetate, succinimidyl ester (CFDA-SE, Invitrogen, Carlsbad, CA, USA) by incubation with final concentration of 20 μM CFDA-SE at 37°C for 15 min followed by 30 min incubation in complete medium at 37°C. Labeled cells were washed twice in PBS before use.
2.7 Cell labeling for confocal microscopy
To better define the boundary of the cells trapped on device, CFDA-SE labeled cells were further labeled with Lissamine™ Rhodamine B 1,2-dihexadecanoyl-sn-glycero-3-phosphoethanolamine, triethylammonium (rhodamine DHPE, Invitrogen, Carlsbad, CA, USA). The labeling procedure started with making a 1 mM stock solution of Rhodamine DHPE in ethanol. CFDA-SE labeled cells were suspended in PBS at a concentration of 106 cells/mL. Rhodamine DHPE was added to the cell suspension with the final concentration of 1 μM. The mixture was then incubated for 5 min at 37°C. Finally cells were centrifuged, rinsed once with PBS, resuspended in PBS and put in a live cell imaging chamber for confocal microscopy study with a Zeiss LSM Pascal inverted laser scanning microscope. Images were processed with Zeiss LSM software.
2.8 Immunofluorescent (IF) analysis
Samples were prepared by passing known quantities of cultured tumor cells (MCF-7 and LNCaP) in PBS or blood from healthy donors through the 3D microfilter devices. Devices with captured cells were first rinsed with PBS twice followed by fixation with 10% neutral buffered formalin for 20 min. Fixed samples were washed with PBS and ready for IF analysis mostly using antibodies obtained from Invitrogen, Carlsbad, CA unless noted otherwise. A cocktail of two different mouse monoclonal antibodies against cytokeratins (CKs) was used for the detection of epithelial tumor cells: AE-1 (1:600 dilution, Signet, Dedham, MA, USA) against low and intermediate Type I acidic keratins and CAM 5.2 (1:100 dilution, Beckton-Dickinson, San Jose, CA, USA) against CK 8 and 18. The devices were incubated for 1 h in the cocktail of primary antibodies diluted in CheMate antibody diluent (DakoCyotmation, Carpinteria, CA, USA). Subsequently, the devices were washed and incubated for 1 h with Alexa Fluor 488 conjugated goat anti-mouse secondary antibody. To confirm captured CK positive cells were of prostate origin in LNCaP spiked samples, a double staining was used. Rabbit anti-CK was used as the 1st primary antibody and Alexa Fluor 568 conjugated goat anti-rabbit IgG as the 1st secondary antibody for detection of CK. It was followed by IF staining using mouse anti-PSA as the 2nd primary antibody and Alexa Fluor 488 conjugated goat anti-mouse IgG as the 2nd secondary antibody for detection of prostate originated cells. The IF images were obtained using a Nikon Eclipse 80i microscope (Nikon, Japan) with B-2E/C filter cube for green fluorescent channel and G-2E/C for red fluorescent channel and a cooled CCD camera (RT-KE color 3-shot, Diagnostic Instruments, Sterling Heights, MI, USA) for image capture.
2.9 Cell viability assay on cellular metabolic level
CFDA-SE labeled cells mixed with blood from healthy donors were filtered through the device, washed with PBS, and cultured in a petri dish for 2 weeks. On the 14th day, the device was washed twice with PBS and C12-resazurin was added to the petri dish containing the device at a final concentration of 5 μM. The reaction mixture was allowed to incubate for 15 min in a humidified incubator at 5% CO2 and 37°C. Excess amount of PBS was added to the petri with gentle mixing and analyzed under epi fluorescent microscope with red emission filter block (Nikon G-2E/C) immediately.
3 Results and discussion
3.1 Cell capture efficiency
Since CTCs are rare occurrences in blood, it is important to retain maximum number of target cells in a blood sample and we have characterized the capture efficiency of our 3D device with a model system. The model system is constructed by spiking a known number of CFSE labeled MCF-7 cells into blood obtained from healthy donors. 342±58 MCF-7 cells were spiked in 1 mL of whole blood obtained from healthy donors and diluted with 9 mL of PBS before passing through the 3D microfilter devices. During filtration, a constant pressure of approximate 3.45×10³ Pa (0.5 psi) is used to push samples through the device. It took about 3–5 min to finish the filtration process. Numbers of captured cells were manually counted under fluorescence microscope right after filtration (Table 1) with the average of 296±16 (n=4) captured cells and capture efficiency of 86.5±5.3%, which is comparable to our previously reported data obtained using single layer 2D microfilter device (Zheng et al. 2007). The sample volume of the device is limited to about 1 mL of whole blood. Larger volume results in clogging of the device. Assuming pores are eventually clogged by single large leukocytes with normal count ranging from 4.5–11× 106/mL, the enrichment of the device is on the order of 103, given total pore numbers about 7000 on a single device. This is close to our previous 2D pore shaped microfilter device (Lin et al. 2010). If larger sample volume is desired, either multiple devices or device of larger size (e.g. 3 cm by 3 cm instead of 1 cm by 1 cm) can be used.
Table 1.
Capture efficiency measurement
| Experiment number | 1 | 2 | 3 | 4 |
| Tumor cell count | 288 | 317 | 281 | 299 |
3.2 Comparison of 2D and 3D microfilter devices for cell capture
A sided by side comparison was performed between 2D and 3D microfilter devices by filtering unfixed CFDA-SE labeled MCF-7 cells under the same flow rates. The 2D microfilter device failed to retain intact cells as shown in Fig. 6(b) in comparison to a positive control prepared by pipetting a droplet of buffer containing labeled cells on a 2D microfilter device without filtration (Fig. 6(a)). Moreover, intact cells were not observed in the filtrate of the sample, which rules out the possibility of intact cells squeezing through the pores and suggests cell lysis during filtration. Under careful examination using fluorescence microscope, faint green fluorescence can be observed on the 2D devices coming from the edges of pores, which were thought to be cell membrane remnants and later confirmed by SEM (Fig. 6(b) inset). On the contrary, 3D device can capture MCF-7 cells while preserving cell membrane integrity as demonstrated by the bright green fluorescence indicating intact cytoplasm as shown in Fig. 6(c). This direct comparison between the 2D and 3D microfilter devices clearly demonstrates the capability of 3D device for capturing viable unfixed tumor cells.
Fig. 6.
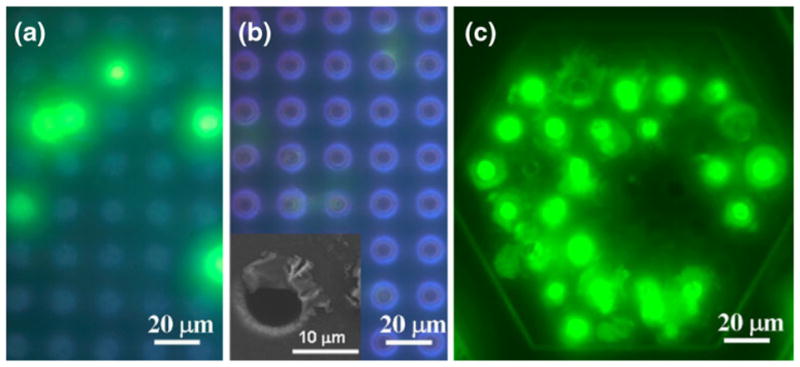
Comparison of 2D and 3D filters with unfixed CFDA-SE labeled MCF-7 cells. (a) cells loaded on top surface of a 2D filter device. (b) cells filtered through a 2D filter device. (c) cells filtered through a 3D filter device
The pore density of the 2D devices is normally about 1.12×10⁵/cm2, which corresponds to porosity (open pore area to overall area) of 5.6%. While higher density 2D filters of 2.5×10⁵/cm2 (porosity 12.6%) was fabricated, the high pore density introduces local membrane distortion during filtration and makes image observation difficult. With the current 3D microfilter device, each patch has a pore density of about 2.89×10⁵/cm2, corresponding to a porosity of 14.5%; however, considering the border effect of each patch, the pore density and porosity drops to 1.39× 10⁵/cm2 and 6.96% respectively. Regardless, the porosity of 2D and 3D microfilters is much higher than conventional track etched polycarbonate filters, which has a reported fill factor of less than 2% to avoid significant pore overlapping during fabrication (Fleischer et al. 1964). Higher pore density facilitates filtration of larger sample volume without clogging. It also enables using smaller membrane, which presents the captured cell in a smaller area for observation or scanning and make the overall process more efficient.
3.3 SEM and confocal microscopy studies of tumor cells captured on 3D devices
To confirm the capture of intact unfixed cells on the 3D microfilter device, approximately 200 MCF-7 cells in 1 mL of PBS was filtered through a 3D microfilter device and observed with SEM. As shown in Fig. 7(a), a cell with intact membrane was captured and sitting on a pore of the top filter layer with the cell size comparable to expected diameter of 13.6±1.3 μm. Furthermore, fluorescence confocal microscopy was used to examine how the cells were captured on the 3D microfilter. The cytoplasm of MCF-7 cells was labeled with green fluorescent CFDA-SE dye and the plasma membrane was labeled with red fluorescent labeled lipid analog, rhodamine DHPE. Figure 7 (b) is an image taken while keeping the focus at the top membrane surface. The 9 μm diameter red ring corresponds to the top pore edge where the red fluorescence from rhodamine DHPE intensifies on the pore edge within the depth of focus of the microscope. Figure 7(c) is a reconstructed image based on an image stack of 0.5 μm vertical step size, showing the vertical cross section of the cell trapped in a pore. The cell part above the pore is more flat compared with SEM image. This might due to the lipid analog labeling of cell membrane. Before filtration, the lipid labeled plasma membrane seems to be more flexible and cells changed their shape with pseudopodia on surface under conventional fluorescent microscope.
Fig. 7.

SEM and confocal imaging for captured tumor cells. (a) SEM image of a MCF-7 cell captured on a 3D microfilter. (b) Confocal microscopy image focused on the top surface of the 3D microfilter. (c) 3D reconstructed cross-sectional image
3.4 On-chip immunofluorescent staining of captured cells
Interrogation of specific protein expression of captured cell using IF is a common and widely accepted technology for the CTC detection. It provides information on both cell morphology and protein expression and location. In our model system, we have demonstrated our ability to perform on-chip IF for the expression of CK. Figure 8(a) shows a positive control with sample containing only tumor cells in PBS and Fig. 8(b) is the result where culture cell lines were admixed in blood before filtration. In addition to single marker analysis of captured cells, we demonstrated the capability for multi-marker IF analysis using LNCaP cells, which express prostate specific antigen (PSA) in addition to CK. Approximately 100 LNCaP cells were spiked in PBS, filtered through 3D microfilter devices, and fixed with formalin. LNCaP cells were positive for both CK (Fig. 8(c)) and PSA (Fig. 8(d)). Moreover, the cells were stained afterwards with nucleic acid selective fluorescent dye, acridine orange (AO), as shown in (8E) to confirm the presence of cell nucleus.
Fig. 8.

Immunofluorescent staining of captured tumor cells. (a) MCF7 and LNCaP mix without blood stained with anti-CK. (b) MCF7 and LNCaP mix with blood stained with anti-CK. (c) double IF staining, LNCaP cells, without blood, red channel, anti-CK. (d) double IF staining, LNCaP cells, without blood, green channel, anti-PSA. E: double IF staining, LNCaP cells, without blood, green channel, AO
3.5 Viability studies of captured cells
To further validate the viability of the captured tumor cells on the 3D microfilter device, the cells were cultured on device for 2 weeks and confirmed with a functional assay. Immediately after filtering a sample of CFDA-SE labeled MCF-7 cells admixed in blood, the 3D microfilter device was placed inside a petri dish containing complete culture media and checked under the bright field microscopy (Fig. 9(a)) for device integrity and fluorescence (Fig. 9(b)) for the presence of intact captured cells. Captured cells were cultured for 2 weeks inside the petri dish and most of the captured cells remained in the same positions as shown in Fig. 9(c). It is interesting to note the number of green fluorescent cells reduced from 71 to 61 in the same area during the 2 week period. It is possible these cells were damaged during the filtration process, passively moved by the flow of fluids when changing the media, or actively moved out of the pores and into the cell culture container. Overall, after 2 weeks of cell culture, at least over 85% of the tumor cells had intact cell membrane. A separate negative control was performed (data not shown), in which CFDA-SE labeled MCF-7 cells were filtered through 3D microfilter device, checked for bright green fluorescence. After treated with common fixative acetone, the original bright green fluorescent spots turned dark. It is well known that acetone makes cell surface permeable by removing lipids, precipitating proteins, and dehydrating the cells (Hoetelmans et al. 2001). Thus CFDA-SE in cytoplasm leaks out of the cells leaving behind dark spots that were originally occupied by bright green fluorescent cells.
Fig. 9.
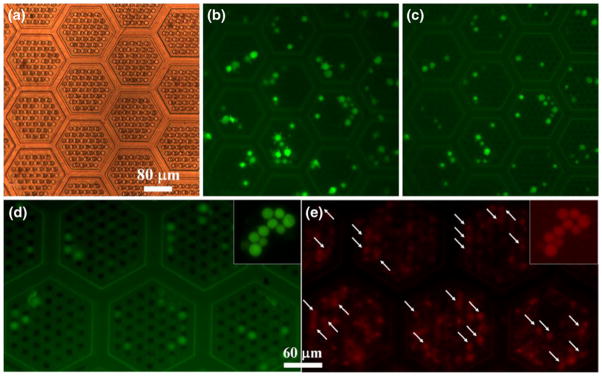
Cell viability tests. (a) Device right after filtration under bright field illumination showing the geometry of the patches and the two layers of pores. (b) Device right after filtration under green fluorescent emission channel. (c) and (d) Device 14 days later under green fluorescent emission channel. (e) Device 14 days later after C12-resazurin staining under red fluorescent emission channel. White arrows in E point to positions of green fluorescent cells in (d). (a), (b), and (c) were focused on the same area. (d) and (e) were focused on the same area. Insets in (d) and (e) are positive controls where cells were loaded on flat parylene surface
Captured tumor cells on the 3D microdevice were tested with C12-resazurin functional assay to demonstrate active metabolic activity. Colorless C12-resazurin (dodecyl-resazurin) readily diffuses across cellular membrane and is reduced to red-fluorescent C12-resorufin in metabolically active cells; therefore, marking metabolic active cells red. As shown in Fig. 8(e), metabolic active cells were labeled red along with a high background coming from blood cells. Most of the captured tumor cells in Fig. 9(d) corresponds to a red fluorescent area (arrows in Fig. 9(e)) indicating tumor cells were metabolically active even after 2 weeks of culture. Insets of Fig. 9(d) and (e) are positive controls with fresh MCF-7 cells loaded on parylene surface and stained with C12-resorufin.
It is worth noting that parylene is an ideal building material for this filtration device because of its unique properties. It is a mechanically strong (Young’s modulus 4 GPa and tensile strength: 70 MPa) while malleable (elongation to break 200%) polymer. Being optically transparent in visible range, this parylene device enables direct on-chip pathological observation as demonstrated. Chemically, it is inert to most of the chemicals and solvents used in standard chemical and biological laboratories yielding compatibility with most post-processing (e.g. cell fixation, lysing, staining) steps to be performed on devices without complexities and cell loss associated with added transfer step. Moreover, parylene is a highly biocompatible polymer that can meet the highest standard for long-term implantation or cell culture as shown. Lastly, parylene membrane filtration devices experiences less clogging and membrane fouling due to reduced protein absorption and cell adhesion (Chang et al. 2007).
4 Conclusion
Despite decades of effort, metastasis remains one of the major challenges of basic cancer research. The main roadblock to characterizing CTCs and their involvement in cancer progression has been the lack of a standard method for viable capture of rare occurring CTCs in the complex fluid of blood. We have demonstrated here a 3D microfilter that can enrich viable CTCs with ~86% capture efficiency in a few minutes. We confirmed intact cell capture with SEM and confocal microscopy. Furthermore, the ability to perform on-chip multimarker immunofluorescence analysis was demonstrated. The captured cells were shown to be viable and metabolically active even after 2 weeks of cell culture on the device. Further characterization and optimization of the device is underway and can potentially even improve device performance. Future clinical testing with cancer patient blood samples can provide more information on the performance of the device. The device is a valuable tool for metastatic cancer diagnosis, treatment monitoring, personalized drug screening, and research of CTCs.
Acknowledgments
The funding of the project was provided by NIH 1R21 CA123027-01. The authors would like to thank for all the members at Caltech micromachining group and Dr. Cote’s pathology group for their valuable assistance. The authors greatly appreciate for the help from Dr. Chris Water at Caltech Biological Imaging Center on using confocal microscopy.
Contributor Information
Siyang Zheng, Email: siyang@psu.edu, Department of Bioengineering, Pennsylvania State University, University Park, PA 16802, USA.
Henry K. Lin, BioSciences Division, Oak Ridge National Lab, Oak Ridge, TN 37831, USA
Bo Lu, Department of Electrical Engineering, California Institute of Technology, Pasadena, CA 91125, USA.
Anthony Williams, Department of Pathology, University of Miami, Miami, FL 33136, USA.
Ram Datar, Department of Pathology, University of Miami, Miami, FL 33136, USA.
Richard J. Cote, Department of Pathology, University of Miami, Miami, FL 33136, USA
Yu-Chong Tai, Department of Electrical Engineering, California Institute of Technology, Pasadena, CA 91125, USA.
References
- Alix-Panabieres C, Riethdorf S, et al. Circulating tumor cells and bone marrow micrometastasis. Clin Cancer Res. 2008;14(16):5013–5021. doi: 10.1158/1078-0432.CCR-07-5125. [DOI] [PubMed] [Google Scholar]
- Allard WJ, Matera J, et al. Tumor cells circulate in the peripheral blood of all major carcinomas but not in healthy subjects or patients with nonmalignant diseases. Clin Cancer Res. 2004;10(20):6897–6904. doi: 10.1158/1078-0432.CCR-04-0378. [DOI] [PubMed] [Google Scholar]
- Baker MK, Mikhitarian K, et al. Molecular detection of breast cancer cells in the peripheral blood of advanced-stage breast cancer patients using multimarker real-time reverse transcription-polymerase chain reaction and a novel porous barrier density gradient centrifugation technology. Clin Cancer Res. 2003;9(13):4865–4871. [PubMed] [Google Scholar]
- Benez A, Geiselhart A, et al. Detection of circulating melanoma cells by immunomagnetic cell sorting. J Clin Lab Anal. 1999;13(5):229–233. doi: 10.1002/(SICI)1098-2825(1999)13:5<229::AID-JCLA7>3.0.CO;2-Y. [DOI] [PMC free article] [PubMed] [Google Scholar]
- Boyle P, Levin B. World cancer report. WHO; Geneva: 2008. [Google Scholar]
- Braun S, Naume B. Circulating and disseminated tumor cells. J Clin Oncol. 2005;23(8):1623–1626. doi: 10.1200/JCO.2005.10.073. [DOI] [PubMed] [Google Scholar]
- Budd GT, Cristofanilli M, et al. Circulating tumor cells versus imaging—Predicting overall survival in metastatic breast cancer. Clin Cancer Res. 2006;12(21):6403–6409. doi: 10.1158/1078-0432.CCR-05-1769. [DOI] [PubMed] [Google Scholar]
- Chang TY, Yadav VG, et al. Cell and protein compatibility of parylene-C surfaces. Langmuir. 2007;23(23):11718–11725. doi: 10.1021/la7017049. [DOI] [PubMed] [Google Scholar]
- Cote RJ, Rosen PP, et al. Prediction of early relapse in patients with operable breast-cancer by detection of occult bone-marrow micrometastases. J Clin Oncol. 1991;9(10):1749–1756. doi: 10.1200/JCO.1991.9.10.1749. [DOI] [PubMed] [Google Scholar]
- Cristofanilli M, Mendelsohn J. Circulating tumor cells in breast cancer: advanced tools for “tailored” therapy? PNAS. 2006;103(46):17073–17074. doi: 10.1073/pnas.0608651103. [DOI] [PMC free article] [PubMed] [Google Scholar]
- Cristofanilli M, Budd GT, et al. Circulating tumor cells, disease progression, and survival in metastatic breast cancer. N Engl J Med. 2004;351(8):781–791. doi: 10.1056/NEJMoa040766. [DOI] [PubMed] [Google Scholar]
- Cristofanilli M, Hayes DF, et al. Circulating tumor cells: a novel prognostic factor for newly diagnosed metastatic breast cancer. J Clin Oncol. 2005;23(7):1420–1430. doi: 10.1200/JCO.2005.08.140. [DOI] [PubMed] [Google Scholar]
- Crnic I, Christofori G. Novel technologies and recent advances in metastasis research. Int J Dev Biol. 2004;48(5–6):573–81. doi: 10.1387/ijdb.041809ic. [DOI] [PubMed] [Google Scholar]
- Dawood S, Broglio K, et al. Circulating tumor cells in metastatic breast cancer. Cancer. 2008;113(9):2422–2430. doi: 10.1002/cncr.23852. [DOI] [PubMed] [Google Scholar]
- Dirix L, Van Dam P, et al. Genomics and circulating tumor cells: promising tools for choosing and monitoring adjuvant therapy in patients with early breast cancer? Curr. Opin Oncol. 2005;17(6):551–558. doi: 10.1097/01.cco.0000183669.61767.81. [DOI] [PubMed] [Google Scholar]
- Evans EA, Skalak R, et al. Mechanics and thermodynamics of biomembranes. 1. CRC Crit Rev Bioeng. 1979;3(3):181–330. [PubMed] [Google Scholar]
- Fleischer RL, Price PB, et al. Novel filter for biological materials. Science. 1964;143(3603):249–250. doi: 10.1126/science.143.3603.249. [DOI] [PubMed] [Google Scholar]
- Fleischer RL, Price PB, et al. Tracks of charged particles in solids. Science. 1965;149(3682):383–393. doi: 10.1126/science.149.3682.383. [DOI] [PubMed] [Google Scholar]
- Fleischer RL, Alter HW, et al. Particle track etching. Science. 1972;178(4058):255–263. doi: 10.1126/science.178.4058.255. [DOI] [PubMed] [Google Scholar]
- Gabor H, Weiss L. Mechanically induced trauma suffered by cancer-cells in passing through pores in polycarbonate membranes. Invasion Metastasis. 1985;5(2):71–83. [PubMed] [Google Scholar]
- Gupta GP, Massague J. Cancer metastasis: building a framework. Cell. 2006;127(4):679–695. doi: 10.1016/j.cell.2006.11.001. [DOI] [PubMed] [Google Scholar]
- Hanahan D, Weinberg RA. The hallmarks of cancer. Cell. 2000;100(1):57–70. doi: 10.1016/s0092-8674(00)81683-9. [DOI] [PubMed] [Google Scholar]
- Hardingham JE, Kotasek D, et al. Immunobead-Pcr—A technique for the detection of circulating tumor-cells using immunomagnetic beads and the polymerase chain-reaction. Cancer Res. 1993;53(15):3455–3458. [PubMed] [Google Scholar]
- Hayes DF, Smerage J. Is there a role for circulating tumor cells in the management of breast cancer? Clin Cancer Res. 2008;14(12):3646–3650. doi: 10.1158/1078-0432.CCR-07-4481. [DOI] [PubMed] [Google Scholar]
- Hayes DF, Cristofanilli M, et al. Circulating tumor cells at each follow-up time point during therapy of metastatic breast cancer patients predict progression-free and overall survival. Clin Cancer Res. 2006;12(14):4218–4224. doi: 10.1158/1078-0432.CCR-05-2821. [DOI] [PubMed] [Google Scholar]
- Hoetelmans RWM, Prins FA, et al. Effects of acetone, methanol, or paraformaldehyde on cellular structure, visualized by reflection contrast microscopy and transmission and scanning electron microscopy. Appl Immunohistochem Mol Morphol. 2001;9(4):346–351. doi: 10.1097/00129039-200112000-00010. [DOI] [PubMed] [Google Scholar]
- Hosokawa M, Hayata T, et al. Size-selective microcavity array for rapid and efficient detection of circulating tumor cells. Anal Chem. 2010;82(15):6629–6635. doi: 10.1021/ac101222x. [DOI] [PubMed] [Google Scholar]
- Kahn HJ, Presta A, et al. Enumeration of circulating tumor cells in the blood of breast cancer patients after filtration enrichment: correlation with disease stage. Breast Cancer Res Treat. 2004;86(3):237–247. doi: 10.1023/B:BREA.0000036897.92513.72. [DOI] [PubMed] [Google Scholar]
- Kwok R, Evans E. Thermoelasticity of large lecithin bilayer vesicles. Biophys J. 1981;35(3):637–652. doi: 10.1016/S0006-3495(81)84817-5. [DOI] [PMC free article] [PubMed] [Google Scholar]
- Lara O, Tong XD, et al. Enrichment of rare cancer cells through depletion of normal cells using density and flow-through, immunomagnetic cell separation. Exp Hematol. 2004;32(10):891–904. doi: 10.1016/j.exphem.2004.07.007. [DOI] [PubMed] [Google Scholar]
- Lin HK, Zheng S, et al. Portable filter-based microdevice for detection of circulating tumor cells. 2008 doi: 10.1158/1078-0432.CCR-10-1105. submitted. [DOI] [PMC free article] [PubMed] [Google Scholar]
- Lin HK, Zheng S, et al. Portable filter-based microdevice for detection and characterization of circulating tumor cells. Clin Cancer Res. 2010 doi: 10.1158/1078-0432.CCR-10-1105. Accepted. [DOI] [PMC free article] [PubMed] [Google Scholar]
- Maheswaran S, Sequist LV, et al. Detection of mutations in EGFR in circulating lung-cancer cells. N Engl J Med. 2008;359(4):366–377. doi: 10.1056/NEJMoa0800668. [DOI] [PMC free article] [PubMed] [Google Scholar]
- Meng S, Tripathy D, et al. uPAR and HER-2 gene status in individual breast cancer cells from blood and tissues. PNAS. 2006;103(46):17361–17365. doi: 10.1073/pnas.0608113103. [DOI] [PMC free article] [PubMed] [Google Scholar]
- Nagrath S, Sequist LV, et al. Isolation of rare circulating tumour cells in cancer patients by microchip technology. Nature. 2007;450(7173):1235–U10. doi: 10.1038/nature06385. [DOI] [PMC free article] [PubMed] [Google Scholar]
- Pantel K, Brakenhoff RH. Dissecting the metastatic cascade. Nat Rev Cancer. 2004;4(6):448–456. doi: 10.1038/nrc1370. [DOI] [PubMed] [Google Scholar]
- Pantel K, Brakenhoff RH, et al. Detection, clinical relevance and specific biological properties of disseminating tumour cells. Nat Rev Cancer. 2008;8(5):329–340. doi: 10.1038/nrc2375. [DOI] [PubMed] [Google Scholar]
- Pinzani P, Salvadori B, et al. Isolation by size of epithelial tumor cells in peripheral blood of patients with breast cancer: correlation with real-time reverse transcriptase-polymerase chain reaction results and feasibility of molecular analysis by laser microdissection. Hum Pathol. 2006;37(6):711–718. doi: 10.1016/j.humpath.2006.01.026. [DOI] [PubMed] [Google Scholar]
- Racila E, Euhus D, et al. Detection and characterization of carcinoma cells in the blood. Proc Natl Acad Sci USA. 1998;95(8):4589–4594. doi: 10.1073/pnas.95.8.4589. [DOI] [PMC free article] [PubMed] [Google Scholar]
- Reya T, Morrison SJ, et al. Stem cells, cancer, and cancer stem cells. Nature. 2001;414(6859):105–111. doi: 10.1038/35102167. [DOI] [PubMed] [Google Scholar]
- Riethdorf S, Fritsche H, et al. Detection of circulating tumor cells in peripheral blood of patients with metastatic breast cancer: a validation study of the cell search system. Clin Cancer Res. 2007;13(3):920–928. doi: 10.1158/1078-0432.CCR-06-1695. [DOI] [PubMed] [Google Scholar]
- Rostagno P, Moll JL, et al. Detection of rare circulating breast cancer cells by filtration cytometry and identification by DNA content: sensitivity in an experimental model. Anticancer Res. 1997;17(4A):2481–2485. [PubMed] [Google Scholar]
- Sahai E. Illuminating the metastatic process. Nat Rev Cancer. 2007;7(10):737–749. doi: 10.1038/nrc2229. [DOI] [PubMed] [Google Scholar]
- Seal SH. A sieve for the isolation of cancer cells and other large cells from the blood. Cancer. 1964;17(5):637–642. doi: 10.1002/1097-0142(196405)17:5<637::aid-cncr2820170512>3.0.co;2-i. [DOI] [PubMed] [Google Scholar]
- Smerage JB, Hayes DF. The measurement and therapeutic implications of circulating tumour cells in breast cancer. Br J Cancer. 2006;94(1):8–12. doi: 10.1038/sj.bjc.6602871. [DOI] [PMC free article] [PubMed] [Google Scholar]
- Steeg PS. Tumor metastasis: mechanistic insights and clinical challenges. Nat Med. 2006;12(8):895–904. doi: 10.1038/nm1469. [DOI] [PubMed] [Google Scholar]
- Stingl J, Caldas C. Opinion—Molecular heterogeneity of breast carcinomas and the cancer stem cell hypothesis. Nat Rev Cancer. 2007;7(10):791–799. doi: 10.1038/nrc2212. [DOI] [PubMed] [Google Scholar]
- Tan S, Yobas L, et al. Microdevice for the isolation and enumeration of cancer cells from blood. Biomed Microdevices. 2009;11(4):883–892. doi: 10.1007/s10544-009-9305-9. [DOI] [PubMed] [Google Scholar]
- Vona G, Sabile A, et al. Isolation by size of epithelial tumor cells—A new method for the immunomorphological and molecular characterization of circulating tumor cells. Am J Pathol. 2000;156(1):57–63. doi: 10.1016/S0002-9440(10)64706-2. [DOI] [PMC free article] [PubMed] [Google Scholar]
- Vona G, Beroud C, et al. Enrichment, immunomorphological, and genetic characterization of fetal cells circulating in maternal blood. Am J Pathol. 2002;160(1):51–58. doi: 10.1016/S0002-9440(10)64348-9. [DOI] [PMC free article] [PubMed] [Google Scholar]
- Vona G, Estepa L, et al. Impact of cytomorphological detection of circulating tumor cells in patients with liver cancer. Hepatology. 2004;39(3):792–797. doi: 10.1002/hep.20091. [DOI] [PubMed] [Google Scholar]
- Weinberg RA. The biology of cancer. Garland Science, Talyor & Francis Group, LLC; New York: 2007. [Google Scholar]
- Weiss L, Schmidschonbein GW. Biomechanical interactions of cancer-cells with the microvasculature during metastasis. Cell Biophys. 1989;14(2):187–215. doi: 10.1007/BF02797133. [DOI] [PubMed] [Google Scholar]
- Wicha MS, Liu SL, et al. Cancer stem cells: an old idea—A paradigm shift. Cancer Res. 2006;66(4):1883–1890. doi: 10.1158/0008-5472.CAN-05-3153. [DOI] [PubMed] [Google Scholar]
- Zabaglo L, Ormerod MG, et al. Cell filtration-laser scanning cytometry for the characterisation of circulating breast cancer cells. Cytom A. 2003;55A(2):102–108. doi: 10.1002/cyto.a.10071. [DOI] [PubMed] [Google Scholar]
- Zheng S, Lin H, et al. Membrane microfilter device for selective capture, electrolysis and genomic analysis of human circulating tumor cells. J Chromatogr A. 2007;1162(2):154–161. doi: 10.1016/j.chroma.2007.05.064. [DOI] [PubMed] [Google Scholar]