

Abstract
The mechanism of isomerization (basepair openings) during transcription initiation by RNA polymerase at the galP1 promoter of Escherichia coli was investigated by 2-aminopurine (2,AP) fluorescence. The fluorescence of 2,AP is quenched in DNA duplex and enhanced when the basepair is distorted or deformed. The increase of 2,AP fluorescence was used to monitor basepair distortion at several individual positions in the promoter. We observed that basepair distortions during isomerization are a multi-step process. Three distinct hitherto unresolved steps in kinetic terms were observed, where significant fluorescence change occurs: a fast step with a half-life of around 1 s, which is followed by two slower steps occurring with a half-life in the range of minutes at 25°C. Contrary to commonly held expectations, basepairs at different positions opened by 2,AP assays without any obvious pattern, suggesting that basepair opening is an asynchronous multi-step process. cAMP·CRP, which activates transcription at galP1, enhanced the rate-limiting step.
Keywords: activation; 2,aminopurine; fluorescence; intermediate; kinetics; transcription
Introduction
Both activation and repression of transcription of initiation are most often achieved by DNA-binding gene-regulatory proteins (activators and repressors), which act by modulating the activity of RNA polymerase through contact(s). Such contacts may involve a single activator or repressor bound to a specific DNA site at or near the promoter, as in many prokaryotic genes (Gralla and Collado-Vides, 1996), or one or more components of a conglomerate of proteins assembled at a DNA site that could be kilobase pairs away from the promoter, as is frequently found in eukaryotic systems (Ptashne and Gann, 1997; Carey, 1998). In the latter examples, the protein–protein contact between a DNA–multiprotein complex and RNA polymerase results in a DNA loop. The core question, which remains unresolved, is how such physical contacts transpire into transcription regulation at the level of RNA polymerase binding, or a later step. A common concept assumes that the contact affects transcription initiation by modifying the structure of RNA polymerase allosterically. Although allosteric mechanisms may contribute to the regulatory processes, a regulator–RNA polymerase contact may act by a different mechanism, that is, by differential energetic stabilization of one or more of the intermediate states and/or transition states of the RNA polymerase–promoter-initiating complex (Roy et al, 1998). Thus, it is important to identify and characterize all the intermediates in the transcription initiation pathway (Chamberlin, 1974; deHaseth and Helmann, 1995; Gussin, 1996; Record et al, 1996).
Recently, the determination of structures produced a great deal of information with respect to the RNA polymerase holoenzyme and some complexes with DNA (Murakami et al, 2002a, 2002b). However, a comprehensive identification of all intermediates still remains elusive. The nature of the intervening transition states is even more difficult to study in the absence of direct kinetic methods. A direct real-time method to study the transcription initiation pathway and its regulation is the use of the fluorescent base analog 2,aminopurine (2,AP) to study the basepair-opening steps of the promoter by RNA polymerase (Jia et al, 1996; Újvári and Martin, 1996; Sullivan et al, 1997). In this report, we used a direct real-time spectroscopic method to probe the steps of isomerization by using 2,AP in the galP1 promoter of Escherichia coli. We followed the fluorescence of 2,AP put in different positions of the promoter to dissect isomerization, and studied how its activator, CRP, affects the steps. Our results showed that isomerization of galP1 is a multi-step process with a rate-limiting one, and that CRP acts by enhancing the rate-limiting step.
Results
The gal operon of E. coli is under the control of two promoters, galP1 and galP2 (Figure 1), belonging to the so-called ex–10 family, in which the −35 region does not play any role (Bown et al, 1997). We introduced several mutations in the ex–10 region of the galP2 promoter to eliminate its interaction of the RNA polymerase (Bingham et al, 1986; see Materials and methods). Single basepair substitution experiments demonstrated that each of these mutations severely decrease galP2 activity while having almost no effect on galP1 activity (DEA Lewis and S Adhya, unpublished results). A combination of these mutations is expected to abolish completely the galP2 activity with only a modest down effect, if any, on galP1. In vitro transcription results using this template were in agreement with this expectation (see below). galP1 templates carrying these galP2− mutations were used in all experiments that follow.
Figure 1.

Top: Relevant region of the gal promoter of E. coli showing galP1 and galP2 (mutated) and depicted by dotted lines, and the CRP-binding site (green). RNA polymerase is schematically drawn in yellow. The two blue arrows are the PCR primers for generating DNA templates for transcription. The blue box indicates a transcription stop signal for the purpose of generating transcript of defined size in vitro. Bottom: DNA sequence of the 106-basepair galP1 promoter fragment. Transcription starts at position +1. cAMP·CRP binding region centered at position −41.5 is shown in green. The shaded segment is the presumed region of basepair distortion. The basepairs indicated by downward arrows around position −10 show mutations in the P1− DNA used as a control (see Figure 4). The positions from −19 through −14 have mutational alterations (not shown) that inactivate RNA polymerase binding to the galP2 promoter.
Measurement of basepair opening in the galP1 promoter containing 2,AP
It is generally believed that about a 15-basepair segment becomes single stranded (referred to as ‘opened') in the isomerized, that is, open, complex (Gamper and Hearst, 1982; McClure, 1985; Amouyal and Buc, 1987; Attey et al, 1994; deHaseth and Helmann, 1995). However, little data exist as to the basepair-opening process and whether the latter is a stepwise process. 2,AP is an adenine analog that pairs with thymine, with only a slightly weaker basepair affinity compared to an A:T basepair in the DNA duplex (Sowers et al, 1986; Nordlund et al, 1989; Wu et al, 1990; Law et al, 1996). 2,AP-containing DNA is in the B-form and does not show any major structural alteration (McLaughlin et al, 1987; Xu et al, 1994). Unlike the normal DNA bases, 2,AP displays fluorescence at neutral pH, which is significantly quenched in the DNA duplex. Consequently, any disruption or unstacking of the 2,AP:T basepair leads to enhancement of fluorescence (Guest et al, 1991; Bloom et al, 1993; Raney et al, 1994; Xu et al, 1994), although a correlation of the disrupted structure with fluorescence properties remains difficult because of the potential effect of RNA polymerase on 2,AP quantum yield. However, the rate of fluorescence increase of 2,AP can be quantitatively linked to the rate of opening or distortion of the double helix, and offers a powerful tool to study the process of basepair opening. As the distortion of the helix during the transcription initiation pathway occurs in the −10 region, we prepared templates, each containing 2,AP replacing an adenine in either strand at positions from −12 to +3. Two different-sized templates containing 2,AP were prepared: (i) 106-basepair-long duplexes of two completely chemically synthesized strands, and (ii) PCR-generated 358-basepair-long templates. Both kinds of templates gave similar results, although the quality of fluorescence data appeared to be better in the latter ones. The transcriptional competency of these templates was judged by electrophoretic mobility shift assay (EMSA) of RNA polymerase binding using the 106-basepair long duplexes, as well as by in vitro transcription assays using the 358-basepair-long DNA. Figure 2 shows the EMSA and the in vitro transcription results for the wild type and several 2,AP-containing DNA templates. The incorporation of 2,AP into the templates made no difference in the binary complex formation as measured by EMSA. Similarly, in vitro transcription experiments showed that the galP1 RNA synthesis and its stimulation by CRP from the 2,AP-containing templates, except the one with the analog at position −11, were comparable to that from the wild-type template. We previously showed that substitution of the adenine by 2,AP at −11 made galP1 defective (Lim et al, 2001).
Figure 2.

(A) EMSA of RNA polymerase binding to the 106-basepair galP1 DNA duplex containing 2,AP at the positions indicated. (B) In vitro synthesis of galP1 RNA in the absence and presence of CRP with 358-basepair gal DNA templates containing 2,AP at the positions indicated. WT indicates galP1 DNA containing no 2,AP.
A distortion in the double helix as a discrete early event during isomerization was suggested recently (Saecker et al, 2002). A rapid component of 2,AP fluorescence increase in the lacP1 promoter E. coli was also detected (Liu et al, 2003). This observation led us to examine the changes in 2,AP fluorescence by stopped-flow methods. Figure 3 shows the kinetics of fluorescence increase of a 358-basepair DNA containing galP1 with 2,AP substituted at the +3 position upon RNA polymerase binding. The fluorescence increase showed saturation behavior and can be fitted to a single exponential with an average rate constant of 0.9 s−1. The 106-basepair template containing 2,AP at +3 also gave a similar profile with an average pseudo-first-order average rate constant of 0.85 s−1 (data not shown). Of the other 2,AP-containing templates tested with 2,AP at −6, −5, −4, −3, −2, +1 or +2, only the one with 2,AP at position +2 showed significant fluorescence increase by stopped-flow assays. The derived average rate constant was 0.69 s−1, suggesting that a helix distortion occurs very early around the +2/+3 region. Given the uncertainties of the stopped-flow measurements, it is unlikely that the values 0.85 and 0.69 s−1 are really different.
Figure 3.
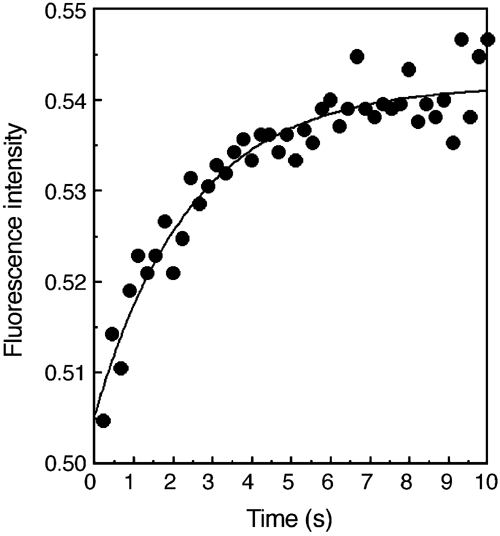
2,AP fluorescence intensity changes (in arbitrary units) of the 358-basepair DNA template containing 2,AP at the +3 position of the galP1 promoter as a function of time (0–10 s) upon rapid mixing with RNA polymerase using a stopped-flow device. A typical run is shown. A derived rate constant for this run may differ from the average rate constant mentioned in the text. See Materials and methods for experimental details.
Asynchrony in basepair opening
In order to observe the basepair openings at a later stage of the transcription initiation, we performed manual mixing experiments. In these experiments, the 106-basepair 2,AP-containing DNA duplexes were mixed with RNA polymerase at a final concentration of 1 μM each, which is at least an order of magnitude higher than the dissociation constant of the galP1 promoter–RNA polymerase closed complex (Goodrich and McClure, 1992). As the on-rates for promoters are very fast, the initial binary closed-complex formation (Knaus and Bujard, 1990) at such concentrations should be over within the mixing time of about 15 s, and hence any change in fluorescence should reflect the step(s) at which significant quantum yield change occurs. Figure 4 shows the fluorescence increase with 2,AP at the −2 position. The rate increase was fitted well to a single exponential, suggesting that the fluorescence increase occurred predominantly in one step. In contrast, the 2,AP fluorescence of the control galP1− DNA with 2,AP at the same −2 position did not increase upon mixing with RNA polymerase. We assume that the fluorescence increase in the wild type is mostly due to basepair openings at the galP1 promoter. We conjecture that the observed initial decrease of the fluorescence before reaching a plateau in the mutant template in the absence of specific promoter binding was caused by quenching of fluorescence when RNA polymerase makes nonspecific interactions with the DNA template that is devoid of any active promoter.
Figure 4.
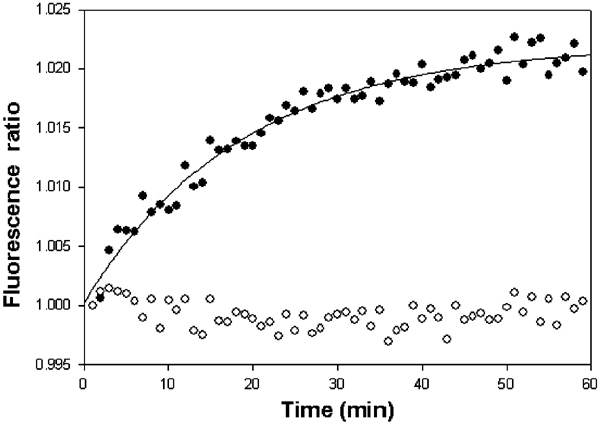
2,AP fluorescence changes in 106-basepair DNA templates containing 2,AP at the −2 position of the galP1 promoter as a function of time upon manual mixing with RNA polymerase in a Perkin-Elmer spectrofluorometer, and expressed as a ratio of two channels. The 2,AP fluorescence increased with time when the promoter was galP1+ (filled circles), and decreased initially and reached a plateau when the promoter was galP1− (open circles).
Figure 5 shows the kinetics of 2,AP fluorescence increase by manual mixing when the label was present at the +3 position in both +358-basepair-long PCR-generated (panel A) and the 106-basepair-long synthetic (panel B) templates. The rate constants (kapp) were determined to be very similar, 2.1 × 10⁻³ and 1.34 × 10⁻³ s−1, respectively, justifying the use of the two types of templates interchangeably. Figure 6 lists the rate constants of fluorescence increase (interpreted as basepair openings) obtained by the manual mixing method for galP1 DNA with 2,AP at different positions from −12 to +3, as derived from the corresponding single exponential curves (see Materials and methods). It is clear that the forward rate constants for the templates containing 2,AP at different positions vary considerably, in some cases by an order of magnitude. At first inspection, the rate constants determined by manual mixing may be grouped into three different categories: rapid basepair opening at positions −12, −10, −4, −2, +1 and +3; moderate openings at positions −12, −10 and +1; and slow openings at positions −7, −5 and +2. It is known that single basepair substitutions at −12, −10 and +1 have moderate down effects on transcription (DEA Lewis and S Adhya, in preparation). Thus, it is very likely that the second group of positions actually belongs to the rapid opening group and shows a moderate rate due to the mutational effects of 2,AP substitutions at these locations. Thus, we classify the basepair openings determined by manual mixing into two classes, pending further exploration of 2,AP mutational effects: rapid (−12, −10, −4, −2, +1 and +3) and slow (−7, −5 and +2). Two of the slow positions (−5 and +2) show no mutational effect in single base substitution experiments (DEA Lewis and S Adhya, in preparation).
Figure 5.
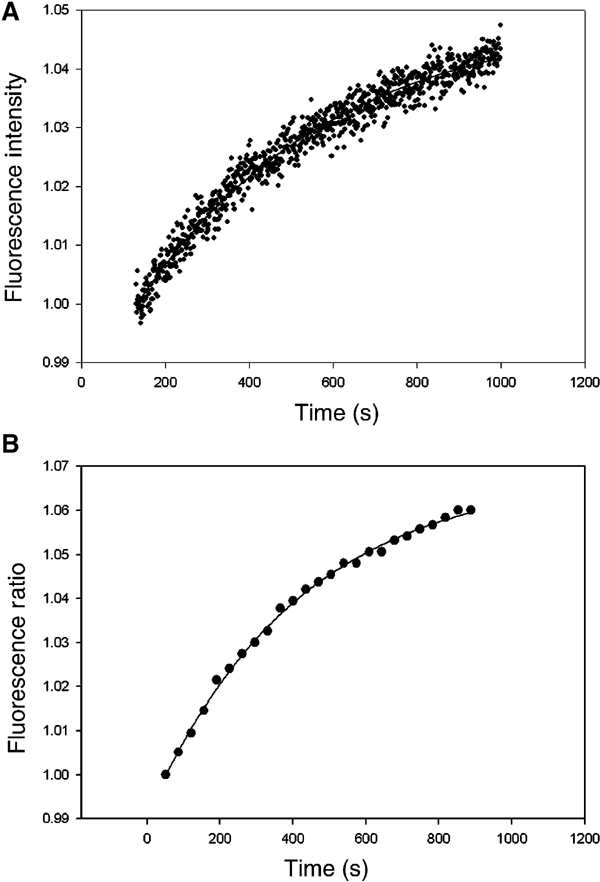
2,AP fluorescence increase with (A) 358-basepair PCR-generated templates in a single-channel PTI spectrofluorometer expressed in normalized fluorescence intensity, and (B) 106-basepair synthetic templates in a Perkin-Elmer LS50B spectrofluorometer with alternate scans as described in Materials and methods. Hence, the Y-axis is expressed as a ratio of two channels. In both cases, 2,AP was present at the +3 position. Details are given in Materials and methods.
Figure 6.
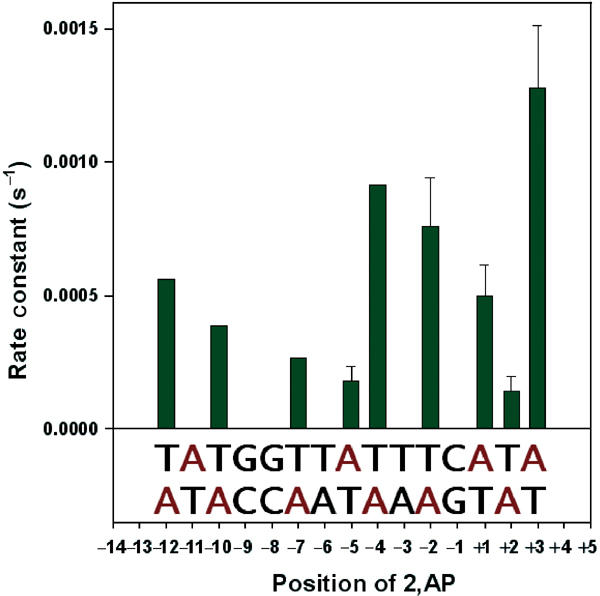
Rate constants of basepair openings at different positions of galP1 upon RNA polymerase binding as measured by 2,AP fluorescence increase shown in bar graphs. The DNA sequence of the −14 to +5 region of the promoter is shown at the bottom of the bar graphs. The positions of the adenines, which were individually probed by 2,AP in either strand, are shown in red. Error bars are not given for cases in which experiments are carried out only two to three times. Only averages are shown for them.
Enhancement of basepair opening by CRP
As previously proposed, a regulator of transcription initiation can act by modulating the energetics on one or more steps of the initiation pathway by making differential contact(s) with DNA-bound RNA polymerase, whose conformation, depending on the DNA sequence of the promoter, constantly changes during the course of the reaction (Roy et al, 1998). By differential contacts, a DNA-bound regulator lowers the free energy of and stabilizes one or more of the intermediates during the course of the reaction. An activator that establishes contacts during the transition state of the slowest step of isomerization would lower its activation energy and enhance the overall isomerization. From the abortive initiation assays, it was suggested that CRP activates galP1 by enhancing mostly the isomerization step (Herbert et al, 1986; Goodrich and McClure, 1992). We used the 2,AP fluorescence-increase experiments to study the effects of CRP on various basepair-opening rates. We emphasize, as mentioned before, that the rate of fluorescence increase is the important parameter, and not the quantum yield, in assessing the activator effect. Figure 7 shows the effect of CRP on the deformation rate of DNA templates substituted with 2,AP at different positions. It is clear that CRP had little effect on the faster basepair-opening positions as was observed by following 2,AP fluorescence increase at positions +1 and +3. However, CRP accelerated the slower rate constants significantly. There was a 4–10-fold increase in the rate constants as observed by following 2,AP fluorescence increase at positions −7, −5 and +2. The rates of the +1 and +2 groups were comparable in the presence of CRP. If an activator enhances one or more steps of the initiation pathway, it must at least enhance the rate-limiting step. This is exactly what was observed. The magnitude of the CRP effect on the isomerization as obtained from abortive initiation assays was similar to that obtained above (Herbert et al, 1986; Goodrich and McClure, 1992).
Figure 7.
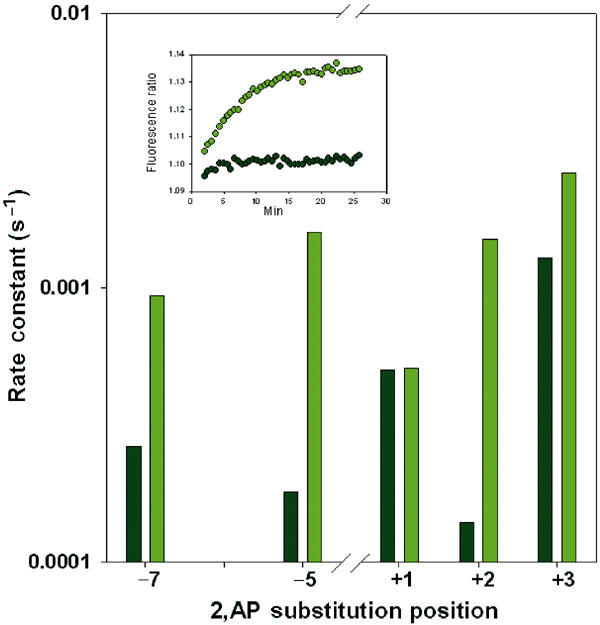
Effect of CRP on the rate constants at five different positions of adenine as probed by 2,AP. Without CRP (gray); with CRP (green). The inset shows, as an example, the fluorescence data for the +2 position.
Discussion
Study of the transient intermediate populations in the process of transcription initiation in real time is crucial for a mechanistic understanding of basal transcription as well as its regulation. The use of 2,AP as a fluorescence probe allowed us to dissect the isomerization step of transcription initiation in greater detail than hitherto possible, both from structural and kinetic viewpoints.
Isomerization is a multi-step process
Our results discussed above demonstrated different steps of isomerization. It was previously shown that the A:T basepair, called the ‘master' basepair, at the −11 position plays a crucial role in initiating the basepair-opening process (Lim et al, 2001). Even a small change of shift of the amino group from the 6 (in adenine) to the 2 position (in 2,AP) blocked the basepair opening at −11. As the 2,AP:T basepair is energetically similar to an A:T basepair, it is likely that this stringent specificity is due to an interaction of −11A with RNA polymerase. It was suggested that −11A interacts with aromatic residues of RNA polymerase (Fenton et al, 2000; Tsujikawa et al, 2002). It was also suggested that the distortion of the duplex at the master position triggers further destabilization of the helix. A significant increase of 2,AP fluorescence, placed at +2 and +3, determined by stopped flow, indicates, however, that +2/+3 destabilization takes place either simultaneously or immediately following the −11A interaction. Whether these two steps are identical or consecutive is not known at this point. It was previously proposed that a contact of the RNA polymerase β–β′ jaw with DNA basepairs occurs relatively early around the start site during isomerization (Saecker et al, 2002). The fluorescence change observed with 2,AP labeled at the +2/+3 regions in the stopped flow may be related to this event.
The slower basepair-opening steps in galP1, as detected by manual mixing, can be divided into two phases. In the first phase, most of the basepairs in the −10 region became distorted. It appears that in the other phase, basepairs at −7, −5 and +2 opened significantly slowly. The slow steps are unlikely to be side reactions because they become faster in the presence of CRP, commensurate with the CRP-mediated enhancement of transcription at galP1 (see later). Based on the information presented above, we propose the following multi-step kinetic scheme of open complex formation at the galP1 promoter:
interaction of −11A with RNA polymerase and very fast destabilization of the +2/+3 region;
fast opening of the basepairs as in positions −4, −2 and +3;
slow opening of the remaining basepairs.
Thus, the basepair-opening process in galP1 is asynchronous.
It is interesting to compare the two open complexes, RPO1 and RPO2, demonstrated by Record and co-workers in the λPR promoter (Suh et al, 1992, 1993). RPO2 showed significantly enhanced permanganate and hydroxy-radical reactivities compared to RPO1 in the −4 to +2 region of PR, including a large permanganate reactivity of the +2 base. This may be compared to the fluorescence change in the slowest phase in galP1 (–5 and +2). We also note that −7T permanganate reactivity is affected inversely between RPO1 and RPO2 (Suh et al, 1993).
CRP enhances the rate-limiting step
In principle, the slow step described above could be a side reaction. However, we assign this last slow step to the generation of the catalytically competent open complex for the following reasons: (i) The step is activated by CRP (Figure 7). (ii) Addition of NTPs clears the promoter of RNA polymerase, which was observed by decrease of the 2,AP fluorescence, presumably because of the restoration of the helix structure (data not shown). The rate constants measured by abortive initiation assays also strongly support that this step is the last rate-determining step of open complex formation (Lavigne et al, 1992). A rate constant of isomerization of 1.4 × 10⁻³ s−1 was obtained for P1 by the abortive RNA synthesis measurements with a 113-basepair linear DNA template carrying a mutation in the P2 promoter (−16A to C change). The average rate constant (average of the 2,AP experiments at positions −7, −5 and +2) of the slowest basepair-opening step was about 8 × 10⁻⁴ s−1. The latter experiments were carried out at 25°C, whereas the abortive initiation assays were performed at 37°C. We observed an approximately five-fold enhancement of the slowest 2,AP basepair-opening step at 37°C when compared to 25°C (S Roy and S Adhya, unpublished results), making the two rate constants very close.
Basepairs open asynchronously
Our results suggest that basepair openings at a promoter do not occur uniformly throughout the region but follow different rates depending on the position of the basepair in the −10 region, and imply that individual basepair openings may be somewhat independent events. This is contrary to the commonly held belief that starting with a nucleation point the DNA duplex becomes single stranded in a sequential fashion during isomerization. How can a basepair at a particular position in the helix open up if its two immediate neighbors have not yet done so? Our results of individual ‘stand-alone' basepair openings, that is, opening of one basepair without simultaneous opening of one or both neighboring pairs at the same time as reflected by 2,AP fluorescence assays, are consistent with the idea of base flipping (Streisinger and Owen, 1985; Roberts, 1995). In fact, base flipping has been invoked for the interaction between −11A and aromatic residues in RNA polymerase (Fenton et al, 2000; Tsujikawa et al, 2002).
Materials and methods
Materials
E. coli RNA polymerase holoenzyme was purchased from Epicentre Technologies. CRP, purified to 98% homogeneity by FPLC (Pharmacia) from an E. coli strain carrying the crp gene in a multicopy plasmid (pHA5), was a gift from S Garges (NCI). Synthetic oligodeoxynucleotides containing 2,AP substitutions either as primers or as 106-nt-long chains were purchased from Sigma-Genosys or Trilink BioTechnologies. The 106-nt-long polymers were purified by polyacrylamide gel electrophoresis.
Preparations of DNA templates containing 2,AP
DNA duplexes (−75 to +30) for fluorescence measurements were prepared fresh before use. They were made by mixing 10 μl of each complementary oligo (10 μM) with 10 μl of 500 mM Tris–HCl, pH 7.5, containing 100 mM MgCl2 and 1 M NaCl. The total volume was adjusted to 100 μl with water. Hybridization was carried out by raising the temperature of the mixture to 95°C for 5 min and slowly lowering the temperature (1°C/100 s) to 25°C using a PCR machine. DNA templates for the electrophoretic mobility shift assays were further purified after hybridization by 8% polyacrylamide gel electrophoresis. The 2,AP-containing DNA templates were also prepared by PCR, in which one of the primers was the 2,AP-containing synthetic oligomer. The second primer corresponded to the segment downstream to a transcription terminator (Figure 1). The DNA templates for PCR reactions were plasmid pSA509 containing a 288-basepair segment of the gal control region (−197 to +91; Figure 1) followed by a transcription terminator (Choy and Adhya, 1993). After the PCR reaction, the 358-basepair DNA fragments were purified by electroelusion (BioRad) followed by ethanol precipitation. The 358-basepair-long PCR DNA templates generated a 125-nt-long RNA transcript from the galP1 promoter in in vitro transcription reactions. All DNA templates contained the following changes to inactivate the P2 promoter: −16A→T, −17G →T, −18T→C and −19G→T.
In vitro transcriptions
In vitro transcription reactions were performed at 25°C in a 50 μl volume. The initial reaction mixture (45 μl) contained 10 nM DNA template, 20 nM RNA polymerase, 20 mM Tris-acetate, pH 7.5, 10 mM magnesium acetate, 200 mM potassium glutamate and 40 U rRNasin (Promega). CRP, when present, was added to the initial reaction mixture at 50 nM. cAMP concentration was 1 μM. The initial mixtures were incubated at 25°C for 20 min, and 5 μl of NTP (2 mM of ATP, GTP and CTP, 0.2 mM UTP and 5 μCi α 32P-UTP) was added. The mixtures were further incubated for 10 min at 25°C, and the reaction was terminated by the addition of 50 μl of the STOP solution (BRL). Samples were boiled for 2 min and 3 μl of each sample was loaded onto 8% polyacrylamide-urea sequencing gels to analyze the RNA. Quantitation of the transcripts was done by PhosphorImager.
EMSA
A volume of 1 μl of appropriately diluted RNA polymerase was mixed with 2 μl of 32P-labeled DNA fragments (200 pM) and 2 μl of the binding buffer (100 mM Tris-acetate, pH 7.5, 50 mM magnesium acetate and 1 M potassium glutamate) in a total reaction volume of 10 μl. The reaction mixtures were incubated at 37°C for 10 min, followed by the addition of 1 μl of heparin (0.5 mg/ml). The entire reaction volume was loaded onto 4% polyacrylamide gel for electrophoresis.
2,AP fluorescence measurements by stopped-flow mixing
For rapid fluorescence measurements of base opening, a stopped-flow spectrometer with fluorescence detection (Applied Photophysics, SX 18MV) was used. A volume of 500 μl each of RNA polymerase (200 nM) and DNA template (600 nM) in 2 × transcription buffer was set up in separate syringes. In all, 25 μl of each reagent was rapidly mixed (6.0 ml/s) in the reaction chamber at a time. Upon the loading of each reagent onto the stopped-flow device, 10 measurements were performed consecutively. The reaction was excited with 315 nm and emission at 370 nm was measured for 10 s. Reactions were prepared and measured at 25°C. The kinetic data of fluorescence were automatically processed, analyzed and saved onto a hard disk of the computer connected to the spectrofluorometer.
2,AP fluorescence measurements by manual mixing
Fluorescence measurements were performed in a Perkin-Elmer Luminescence Spectrometer LS 50B and a, RTC-2000/SE spectrofluorometer from Photon Technology International. Samples were excited at 320 nm (10 nm slit width) and the emission spectra of 370 nm (15 mm slit width) were measured. Prior to the measurements, the temperatures of all the reaction components and instruments were equilibrated at 25°C. The fluorescence measurement and the binary complex formation were executed at 25°C. The binary complex formation between the promoter and RNA polymerase was initiated by mixing 50 μl DNA template (1 μM) and 10 μl RNA polymerase (5 μM). The buffer was 0.05 M Tris–HCl, pH 7.5, containing 0.1 M NaCl and 10 mM MgCl2. As a control, 50 μl of the same DNA (1 μM) was mixed with 10 μl of the RNA polymerase storage buffer. Immediately after the mixing (time 0), both reactions were transferred to cuvettes (Hellma Cells, 0.300). The emission spectra from both samples were recorded alternately every 15 s for 2000 to 4000 s by employing a motorized 4-position turret cuvette holder. To compensate for the machine error, such as machine drift, the fluorescent values of the experiment (DNA+RNA polymerase) were divided by those of the control (DNA+RNA polymerase storage buffer) to calculate the fluorescence ratios. We assumed that the kinetics of binary complex formation is very rapid at the concentrations used (Knaus and Bujard, 1990). This is likely to be the case as the concentration of RNA polymerase and DNA is several-fold greater than a KB−1 value of 2.5 × 10⁻⁷ obtained from abortive initiation experiments (Lavigne et al, 1992), and the on-rate measured for most promoters is around 108 M−1 s−1 (Knaus and Bujard, 1990). Under these conditions, there is a rapid formation of the initial complex that then isomerizes by the first-order kinetics. Sigma plot 4.0 was used to fit the fluorescence data. The rate constants of the open-complex formation were calculated by fitting the fluorescence ratio to the equation f=y0+a(1−e−bt), where f is the ratio at time t, y0 is the initial ratio, a is the observed amplitude and b is the apparent first-order rate constant (kapp) of basepair opening. The rate constant kapp is related to the true first-order rate constant (k) by the relationship kapp=kKaDT/(1+KaDT)+βk, where Ka is the association constant and DT is the total DNA concentration. This relationship was obtained because of a rapid equilibrium between free DNA and the closed complex, the total DNA concentration being greater than that of total RNA polymerase. Although the formal concentrations of DNA and RNA polymerase were the same, the active fraction of RNA polymerase used was only 20% fulfilling the above condition. The value of β was determined by carrying out the reaction at two different DNA concentrations for three different templates. The obtained values for different templates were remarkably close. The average value and standard error obtained was 0.295±0.057. This value for β was used to obtain the value of the forward rate constant for all the templates from kapp.
Acknowledgments
We thank Susan Garges for the gift of CRP and a critical reading of the manuscript, and Anna Mazzuca for editing.
References
- Amouyal M, Buc H (1987) Topological unwinding of strong and weak promoters by RNA polymerase, A comparison between the lac wild-type and the UV5 sites of Escherichia coli. J Mol Biol 195: 795–808 [DOI] [PubMed] [Google Scholar]
- Attey A, Belyaeda T, Savery N, Hoggett J, Fujita N, Ishihama A, Busby S (1994) Interactions between the cyclic AMP receptor protein and the alpha subunit of RNA polymerase at the Escherichia coli galactose operon P1 promoter. Nucleic Acids Res 22: 4375–4380 [DOI] [PMC free article] [PubMed] [Google Scholar]
- Bingham AH, Ponnambalam S, Chan B, Busby S (1986) Mutations that reduce expression from the P2 promoter of the Escherichia coli galactose operon. Gene 41: 67–74 [DOI] [PubMed] [Google Scholar]
- Bloom L, Otto MR, Beechem JM, Goodman MF (1993) Influence of 5′-nearest neighbors on the insertion kinetics of the fluorescent nucleotide analog 2-aminopurine by Klenow fragment. Biochemistry 32: 11247–11248 [DOI] [PubMed] [Google Scholar]
- Bown J, Barne K, Minchin S, Busby S (1997) Extended −10 promoters. Nucleic Acids Mol Biol 11: 41–52 [Google Scholar]
- Carey M (1998) The enhanceosome and transcriptional synergy. Cell 92: 5–8 [DOI] [PubMed] [Google Scholar]
- Chamberlin MJ (1974) The selectivity of transcription. Annu Rev Biochem 43: 721–725 [DOI] [PubMed] [Google Scholar]
- Choy HE, Adhya S (1993) RNA polymerase idling and clearance in gal promoters: use of supercoiled minicircle DNA template made in vivo. Proc Natl Acad Sci USA 90: 472–476 [DOI] [PMC free article] [PubMed] [Google Scholar]
- deHaseth PL, Helmann JD (1995) Open complex formation by Escherichia coli RNA polymerase: the mechanism of polymerase-induced strand separation of double helical DNA. Mol Microbiol 16: 817–824 [DOI] [PubMed] [Google Scholar]
- Fenton MS, Lee SJ, Gralla JD (2000) Escherichia coli promoter opening and −10 recognition: mutational analysis of sigma 70. EMBO J 19: 1130–1137 [DOI] [PMC free article] [PubMed] [Google Scholar]
- Gamper HB, Hearst JE (1982) A topological model for transcription based on unwinding angle analysis of E. coli RNA polymerase binary, initiation and ternary complexes. Cell 29: 81–90 [DOI] [PubMed] [Google Scholar]
- Goodrich JA, McClure WR (1992) Regulation of open complex formation at the Escherichia coli galactose operon promoters. Simultaneous interaction of RNA polymerase, gal repressor and CAP/cAMP. J Mol Biol 224: 15–29 [DOI] [PubMed] [Google Scholar]
- Gralla JD, Collado-Vides J (1996) Organization and function of transcription regulatory elements. In Escherichia coli and Salmonella, Neidhardt FC (ed), pp 1232–1245. Washington, DC: ASM Press [Google Scholar]
- Guest CR, Hochstrasser RA, Sowers LC, Miller DP (1991) Dynamics of mismatched base pairs in DNA. Biochemistry 30: 3271–3279 [DOI] [PubMed] [Google Scholar]
- Gussin GN (1996) Kinetic analysis of RNA polymerase–promoter interactions. Methods Enzymol 273: 45–59 [DOI] [PubMed] [Google Scholar]
- Herbert M, Kolb A, Buc H (1986) Overlapping promoters and their control in Escherichia coli: the gal case. Proc Natl Acad Sci USA 83: 2807–2811 [DOI] [PMC free article] [PubMed] [Google Scholar]
- Jia Y, Kumar A, Patel SS (1996) Equilibrium and stopped-flow kinetic studies of interaction between T7 RNA polymerase and its promoters measured by protein and 2-aminopurine fluorescence changes. J Biol Chem 71: 30451–30458 [DOI] [PubMed] [Google Scholar]
- Knaus R, Bujard H (1990) Principles governing the activity of E. coli promoters. In Nucleic Acids and Molecular Biology, Eckenstein F, Lilley DMJ (eds), Vol. 4, pp 110–112. Berlin: Springer-Verlag [Google Scholar]
- Lavigne M, Herbert M, Kolb A, Buc H (1992) Upstream curved sequences influence the initiation of transcription at the Escherichia coli galactose operon. J Mol Biol 224: 293–306 [DOI] [PubMed] [Google Scholar]
- Law SM, Eritja R, Goodman MF, Breslauer KJ (1996) Spectroscopic and calorimetric characterizations of DNA duplexes containing 2-aminopurine. Biochemistry 35: 12329–12337 [DOI] [PubMed] [Google Scholar]
- Lim HM, Lee HJ, Roy S, Adhya S (2001) A ‘master' in base unpairing during isomerization of a promoter upon RNA polymerase binding. Proc Natl Acad Sci USA 98: 14849–14852 [DOI] [PMC free article] [PubMed] [Google Scholar]
- Liu M, Gupta G, Roy S, Bandujar RP, Patel SS, Garges S (2003) Kinetics of transcription initiation at lacP1. Multiple roles of cyclic AMP receptor protein. J Biol Chem 278: 39755–39761 [DOI] [PubMed] [Google Scholar]
- McClure WR (1985) Mechanism and control of transcription initiation in prokaryotes. Ann Rev Biochem 54: 171–204 [DOI] [PubMed] [Google Scholar]
- McLaughlin L, Benseler F, Graser E, Piel N, Scholtissek S (1987) Effects of functional group changes in the EcoRI recognition site on the cleavage reaction catalyzed by the endonuclease. Biochemistry 26: 7238–7245 [DOI] [PubMed] [Google Scholar]
- Murakami KS, Masuda S, Campbell EA, Muzzin O, Darst SA (2002a) Structural basis of transcription initiation: an RNA polymerase holoenzyme–DNA complex. Science 296: 1285–1290 [DOI] [PubMed] [Google Scholar]
- Murakami KS, Masuda S, Darst SA (2002b) Structural basis of transcription initiation: RNA polymerase holoenzyme at 4 A resolution. Science 296: 1280–1284 [DOI] [PubMed] [Google Scholar]
- Nordlund TM, Anderson S, Nilsson L, Rigearler R, Graslund A, McLaughlin LW (1989) Structure and dynamics of a fluorescent DNA oligomer containing the EcoRI recognition sequence: fluorescence, molecular dynamics, and NMR studies. Biochemistry 28: 9095–9103 [DOI] [PubMed] [Google Scholar]
- Ptashne M, Gann A (1997) Transcriptional activation by recruitment. Nature 386: 569–577 [DOI] [PubMed] [Google Scholar]
- Raney KD, Sowers LC, Millar DP, Benkovic SJ (1994) A fluorescence-based assay for monitoring helicase activity. Proc Natl Acad Sci USA 91: 6644–6648 [DOI] [PMC free article] [PubMed] [Google Scholar]
- Record MT Jr, Reznikoff WS, Craig ML, McQuade KL, Schlax PJ (1996) Escherichai coli RNA polymerase (σ70), promoters, and the kinetics of the steps of transcription initiation. In Escherichia coli and Salmonella, Neidhardt FC (ed), p p 792–820. Washington, DC: ASM Press [Google Scholar]
- Roberts RJ (1995) On base flipping. Cell 82: 9–12 [DOI] [PubMed] [Google Scholar]
- Roy S, Garges S, Adhya S (1998) Activation and repression of transcription by differential contact: two sides of a coin. J Biol Chem 273: 14059–14062 [DOI] [PubMed] [Google Scholar]
- Saecker RM, Tsodikov OV, McQuade KL, Schlax PE, Capp MW, Record MT (2002) Kinetic studies and structural models of the association of E. coli σ70 RNA polymerase with the λPR promoter: large scale conformational changes in forming the kinetically significant intermediates. J Mol Biol 319: 649–671 [DOI] [PubMed] [Google Scholar]
- Sowers LC, Fazakerley GV, Eritja R, Kaplan BE, Goodman MF (1986) Base pairing and mutagenesis: observation of a protonated base pair between 2-aminopurine and cytosine in an oligonucleotide by proton NMR. Proc Natl Acad Sci USA 83: 5434–5438 [DOI] [PMC free article] [PubMed] [Google Scholar]
- Streisinger G, Owen J (1985) Mechanisms of spontaneous and induced frameshift mutation in bacteriophage T4. Genetics 109: 633–659 [DOI] [PMC free article] [PubMed] [Google Scholar]
- Suh WC, Leirmo S, Record MT Jr (1992) Roles of Mg2+ in the mechanism of formation and dissociation of open complexes between Escherichia coli RNA polymerase and the lambda PR promoter: kinetic evidence for a second open complex requiring Mg2+. Biochemistry 31: 7815–7825 [DOI] [PubMed] [Google Scholar]
- Suh WC, Ross W, Record MT Jr (1993) Two open complexes and a requirement for Mg2+ to open the lambda PR transcription start site. Science 259: 358–361 [DOI] [PubMed] [Google Scholar]
- Sullivan JJ, Bjornson KP, Sowers LC, deHaseth PL (1997) Spectroscopic determination of open complex formation at promoters for Escherichia coli RNA polymerase. Biochemistry 36: 8005–8012 [DOI] [PubMed] [Google Scholar]
- Tsujikawa L, Strainic MG, Watrob H, Barkley MD, deHaseth PL (2002) RNA polymerase alters the mobolity of an A-residue crucial to polymerase-induced melting of promoter DNA. Biochemistry 41: 15334–15341 [DOI] [PubMed] [Google Scholar]
- Újvári A, Martin CT (1996) Thermodynamic and kinetic measurements of promoter binding by T7 RNA polymerase. Biochemistry 35: 14574–14582 [DOI] [PubMed] [Google Scholar]
- Wu P, Nordlund TM, Gildea B, McLaughlin LW (1990) Base stacking and unstacking as determined from a DNA decamer containing a fluorescent base. Biochemistry 29: 6508–6514 [DOI] [PubMed] [Google Scholar]
- Xu D, Evans KO, Nordlund TM (1994) Melting and premelting transitions of an oligomer measured by DNA base fluorescence and absorption. Biochemistry 33: 9592–9599 [DOI] [PubMed] [Google Scholar]