Abstract
Vasopressin regulates water excretion, in part, by controlling the abundances of the water channel aquaporin-2 (AQP2) protein and regulatory proteins in the renal collecting duct. To determine whether vasopressin-induced alterations in protein abundance result from modulation of protein production, protein degradation, or both, we used protein mass spectrometry with dynamic stable isotope labeling in cell culture to achieve a proteome-wide determination of protein half-lives and relative translation rates in mpkCCD cells. Measurements were made at steady state in the absence or presence of the vasopressin analog, desmopressin (dDAVP). Desmopressin altered the translation rate rather than the stability of most responding proteins, but it significantly increased both the translation rate and the half-life of AQP2. In addition, proteins associated with vasopressin action, including Mal2, Akap12, gelsolin, myosin light chain kinase, annexin-2, and Hsp70, manifested altered translation rates. Interestingly, desmopressin increased the translation of seven glutathione S-transferase proteins and enhanced protein S-glutathionylation, uncovering a previously unexplored vasopressin-induced post-translational modification. Additional bioinformatic analysis of the mpkCCD proteome indicated a correlation between protein function and protein half-life. In particular, processes that are rapidly regulated, such as transcription, endocytosis, cell cycle regulation, and ubiquitylation are associated with proteins with especially short half-lives. These data extend our understanding of the mechanisms underlying vasopressin signaling and provide a broad resource for additional investigation of collecting duct function (http://helixweb.nih.gov/ESBL/Database/ProteinHalfLives/index.html).
Vasopressin controls water excretion by regulating the molecular water channel aquaporin-2 (AQP2) in two fundamental ways: (1) regulated trafficking,1 seen in a time frame of 40 seconds to about 40 minutes,2 and (2) regulation of AQP2 protein abundance, typically seen after many hours of exposure to vasopressin.3,4 Studies in animal models of various water balance disorders have revealed that most clinically important water balance abnormalities are associated with dysregulation of AQP2 abundance rather than trafficking.5 High levels of circulating vasopressin for periods of hours to days in animals are associated with increases in AQP2 mRNA in the kidney.6,7 Such observations have led to the widely accepted view that vasopressin regulates AQP2 abundance by transcriptional mechanisms.8–11 However, recent studies in cultured inner medullary collecting duct (IMCD) cells by Nedvetsky et al.12 have shown rapid short-term increases in AQP2 abundance in response to vasopressin.12 Within 30 minutes of vasopressin exposure, Nedvetsky et al.12 observed a 60% increase in AQP2 abundance, with no demonstrable change in its mRNA level. This observation implies post-transcriptional regulation of AQP2 abundance, which could theoretically be caused by altered half-life of AQP2 or translational regulation. Nedvetsky et al.12 favored the former possibility but did not measure AQP2 half-life.
Recent studies in a cultured mouse cell line called “mpkCCD” established that vasopressin regulates the abundances of many proteins in collecting duct cells in the absence of altered mRNA abundances.13 This finding implies that post-transcriptional regulation of protein abundances in response to vasopressin in collecting duct cells is not unique to AQP2. Recent advances in protein mass spectrometry using a technique called dynamic stable isotope labeling by amino acids in cell culture (SILAC) allow proteome-wide measurement of protein half-lives14 and relative translation rates.15 Here, we use the dynamic SILAC approach in mpkCCD cells to carry out large-scale measurements of protein half-lives and translation rates with and without vasopressin. This study provides the first proteome-wide profile of protein half-lives in a non-neoplastic epithelial cell and presents a database of protein half-lives for 4403 proteins expressed in mpkCCD cells. The results indicate that vasopressin regulates the translation rate of many more proteins than it does half-life. However, one of the proteins in which half-life was increased by vasopressin was AQP2. The results are compatible with dual regulation of AQP2 abundance in response to vasopressin, consisting of increases in both protein half-life and translation rate.
Results and Discussion
Steady State Half-Life Determination
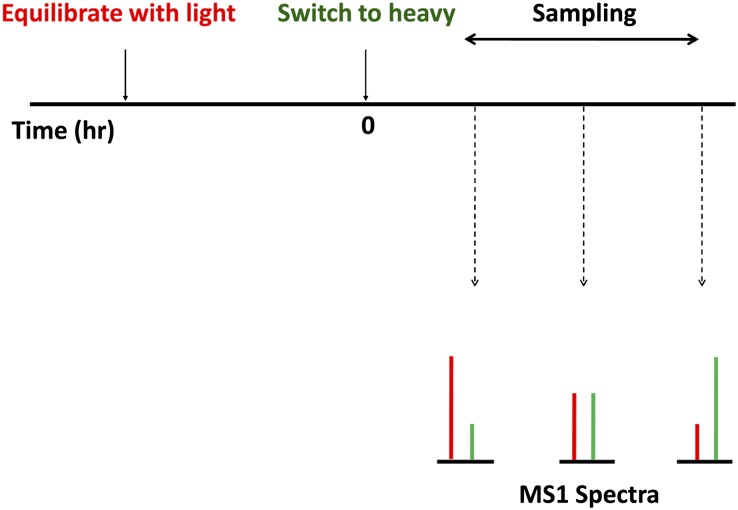
The half-life (t1/2) measurements use SILAC in dynamic mode (Concise Methods) and substitute amino acids arginine and lysine with corresponding heavy amino acids (with 13C and 15N substitutions) at time 0 (or vice versa) (Figure 1). With this approach,14 heavy proteins progressively replace light proteins after the substitution, and the replacement rate can be measured using the relative heavy-to-light peak height ratios for individual tryptic peptides in the pre-fragmentation (MS1) spectra, whereas the peptide sequences can be identified by fragmentation (MS2). Note that translational inhibitors, such as cycloheximide, are not used in this protocol, consistent with the requirement for steady state conditions.
Figure 1.
Timeline of method. Cells, prelabeled with light amino acids, are switched at time 0 to heavy amino acids. Cells are sampled at various times for MS1-level quantification of relative heavy to light peak height ratios for individual peptides. In some experiments, cells were prelabeled with heavy amino acids, and medium was switched to light amino acids at time 0.
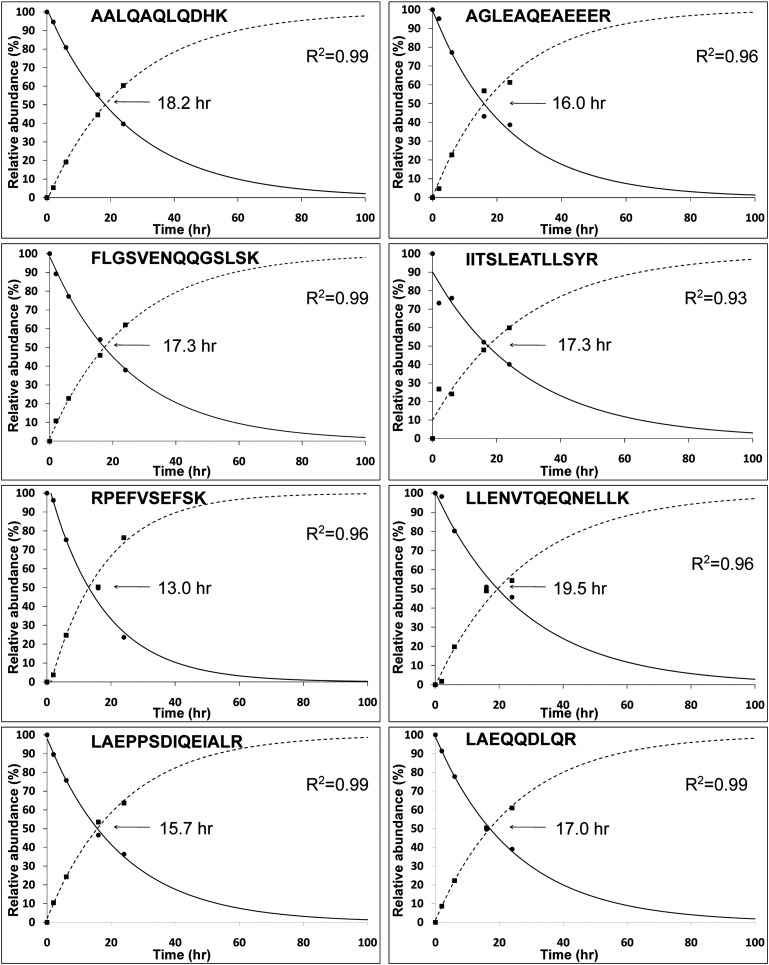
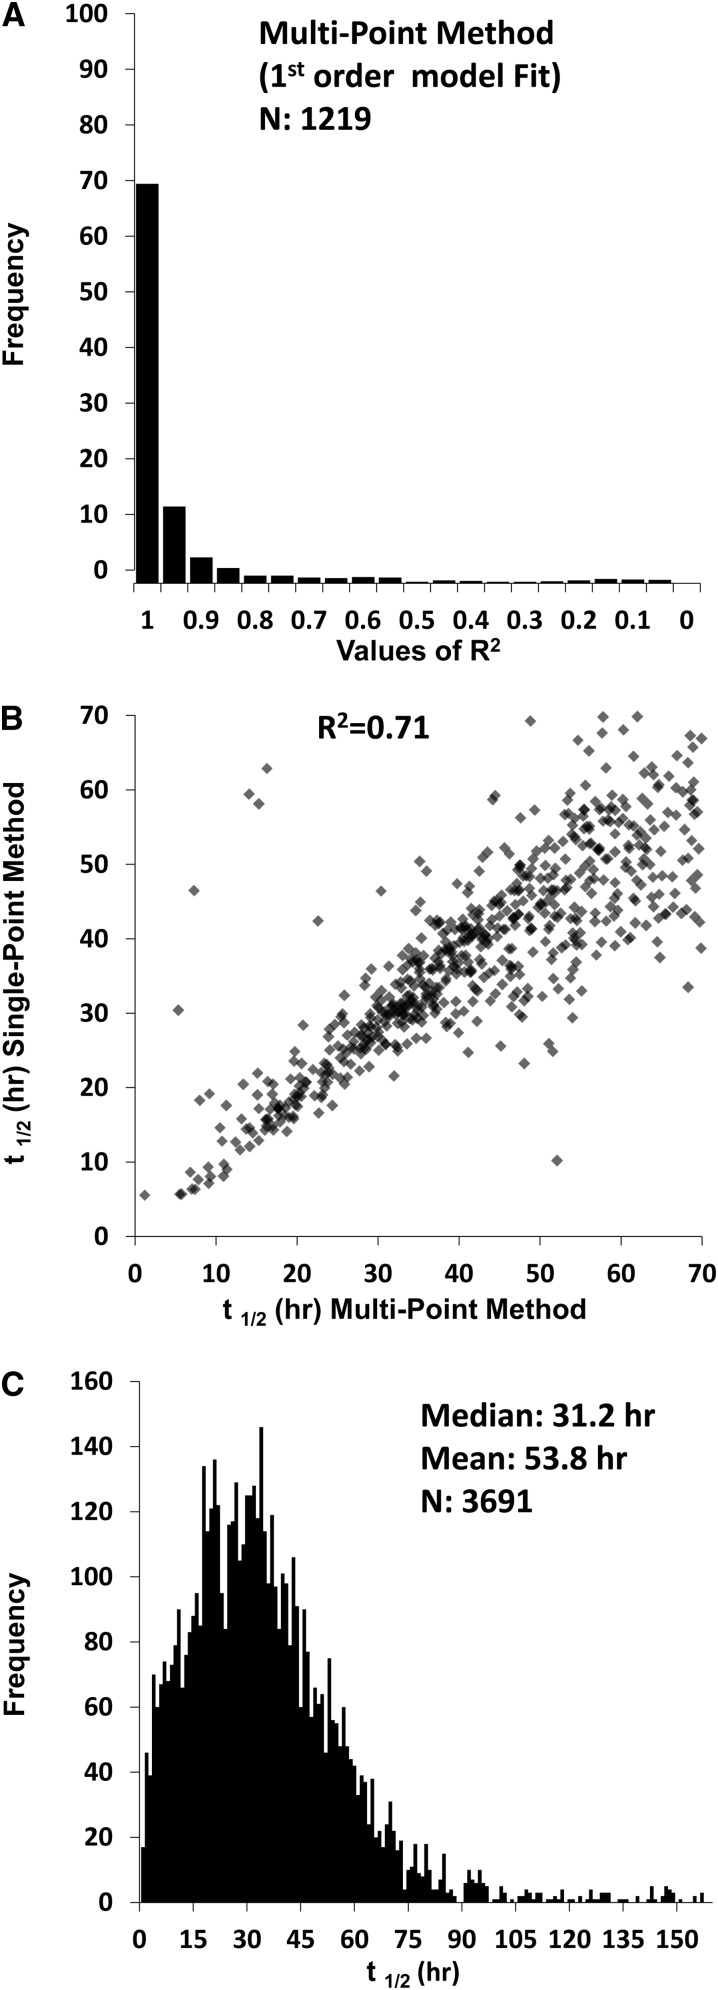
Cells were collected at four time points after the amino acid substitution: viz. 2, 6, 16, and 24 hours. Data were plotted for each peptide as illustrated for the protein Syne-2 in Figure 2. Typically, independent estimates can be made for multiple peptides per protein, giving a high degree of redundancy in the t1/2 determinations. Plots corresponding to 1219 peptides are presented on a public data site at http://helixweb.nih.gov/ESBL/Database/ProteinHalfLives/multipoint.html. Almost all such curves fit a first-order kinetic model, which is reflected by the distribution of correlation coefficients (R2) for linear regression of log-transformed heavy to light ratios versus time (Figure 3A).
Figure 2.
Half-life calculations for different Syne2 (Nesprin2) peptides show a high degree of reproducibility and reveal first-order kinetics.
Figure 3.
Half-lives can be quantified for thousands of proteins using dynamic SILAC and LC-MS/MS. (A) Distribution of R2 values for fit of first-order equation to multipoint data (peptides with values at more than two time points); 89% of peptides had R2>0.8. (B) Correlation between protein half-lives (t1/2) with multi- versus single-point method. (C) Distribution of protein t1/2 obtained with single-point method.
Single-Point Method
Given the consistent first-order nature of degradation kinetics and the high precision of the measurements, we asked whether a single-point method would be capable of yielding high-quality protein t1/2 estimates. Calculations for the single-point method use a mathematical model (Supplemental Material) representing steady state mass balance for each individual protein species in terms of its production rate (translation) and degradation rate. The degradation rate is modeled as first order with respect to the total amount of a given protein in accordance with the above findings. The translation rate is modeled as zeroth order (i.e., independent of protein abundance). Using this model, half-lives can be calculated as
 |
where t1/2 is the half-life of a given protein, ts is the sampling time after the exchange from light-to-heavy amino acids, and Ψ is the light-to-heavy abundance ratio at time ts. The multipoint method was successful in quantifying t1/2 in 745 proteins, whereas 4403 proteins were quantified with the single-point method. Figure 3B shows that there was a high degree of correlation between values determined with the single- versus multipoint method, confirming the fidelity of the single-point approach. Applying the single-point method to untreated mpkCCD cells (3691 proteins), we found a median value of 31.2 hours for all proteins, with skewing to high values, and therefore, the mean is even higher (53.8 hours) (Figure 3C). All t1/2 values obtained in mpkCCD cells using the single-point method have been made available online (http://helixweb.nih.gov/ESBL/Database/ProteinHalfLives/index.html).
Effect of Vasopressin on Protein Half-Lives
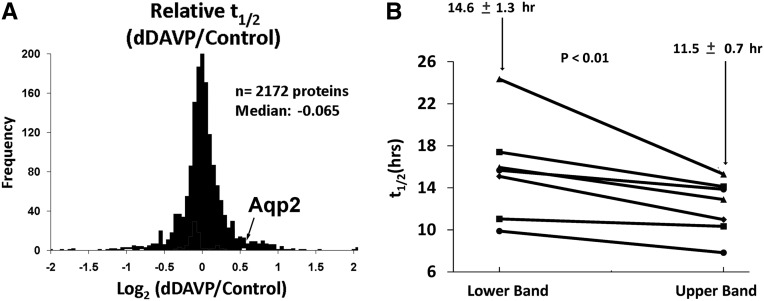
We applied the single-point dynamic SILAC method to identify proteins in mpkCCD cells with half-lives that are regulated by vasopressin. (Note that the cells are maintained in the vasopressin analog 1-desamino-8-D-arginine vasopressin [dDAVP] or vehicle for 5 days before the isotopic label switch to establish the required steady state conditions.) Figure 4A summarizes the effect of the vasopressin analog dDAVP on steady state t1/2 in mouse mpkCCD cells (Supplemental Dataset 1). Interestingly, half-lives for only 5 of 2172 proteins quantified were statistically increased or decreased (Table 1), but one of these proteins was AQP2, with a 45% increase in steady state t1/2. Prior studies using biochemical methods found similar AQP2 t1/2 values (6–12 hours) in mpkCCD cells (parent line for our cells)16 and Madin-Darby Canine Kidney (MDCK) cells stably transfected with AQP2.17 An increase in AQP2 protein half-life was predicted by the work of Nedvetsky et al.,12 which showed an increase in AQP2 protein abundance within 30 minutes of vasopressin exposure in cultured IMCD cells in the absence of changes in AQP2 mRNA abundance.12
Figure 4.
Protein half-lives in mpkCCD cells. All t1/2 values are based on at least three peptides per protein. (A) Distribution dDAVP to vehicle t1/2 ratios; t1/2 for AQP2 was significantly increased. (B) t1/2 of AQP2 protein from lower (nonglycosylated) and upper bands (glycosylated). Results from seven sample pairs show that the mean t1/2 was significantly different between glycosylated (upper band) and nonglycosylated (lower band) forms (P<0.01).
Table 1.
Proteins with half-lives that were significantly altered by vasopressin analog dDAVP
| Name | Gene Symbol | t1/2 Vehicle (Mean ± SEM) | t1/2 dDAVP (Mean ± SEM) |
|---|---|---|---|
| Nischarin | Nisch | 4.4±0.1 | 11.4±4.9 |
| Nuclear RNA export factor 1 | Nxf1 | 33.3±1.3 | 20.5±6.7 |
| Unannotated | Gtl3 | 21.4±4.7 | 34.8±4.6 |
| AQP2 | Aqp2 | 9.8±1.3 | 14.2±1.1 |
| 17-βHSD 4 | Hsd17b4 | 72.0±13.3 | 36.6±9.9 |
Proteins with t1/2 that was measured by dynamic SILAC in at least three distinct peptides showed a mean change of at least |log2((dDAVP/vehicle)|>0.5 and P<0.05. 17-βHSD 4, 17-beta hydroxysteroid dehydrogenase 4.
In immunoblotting, AQP2 is seen as two bands, representing the nonglycosylated and mature glycosylated forms.3 We determined the t1/2 for both forms by cutting them separately out of gels before MS analysis. The results (Figure 4B) show that the glycoslated form (upper band) has a shorter half-life than the nonglycosylated form (lower band), supporting the view that N-linked glycosylation is not necessary for the stability of AQP2.17,18 Typically, in collecting duct cells, less than one half of AQP2 molecules are glycosylated, and inhibition of glycosylation does not prevent delivery of AQP2 to the plasma membrane in response to agents that increase cAMP.18 AQP2 assembles as tetramers, and it is likely that much of the unglycosylated AQP2 that reaches the plasma membrane under normal conditions does so as part of tetrameric complexes with one or more nonglycosylated AQP2 molecules.
Effect of Vasopressin on Translation Rates
As described in Figure 2, the dynamic SILAC data provide information on both protein degradation and production. These two measures are equal at steady state. Relative production rate (RdDAVP/RVeh) for dDAVP versus vehicle can be calculated using
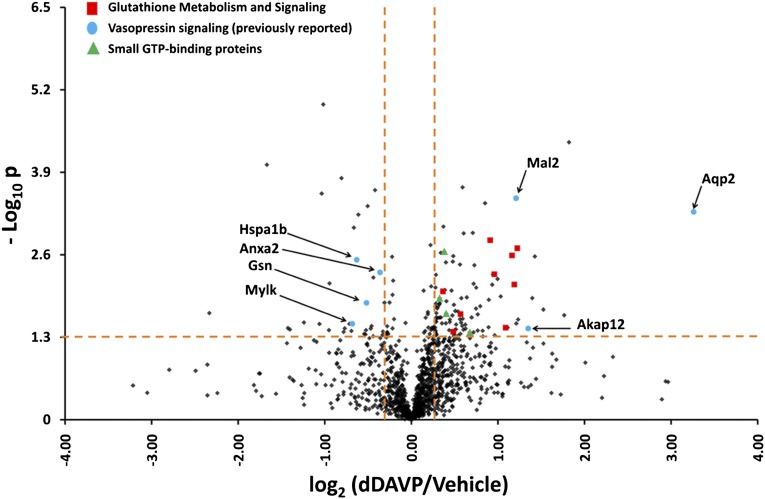
 |
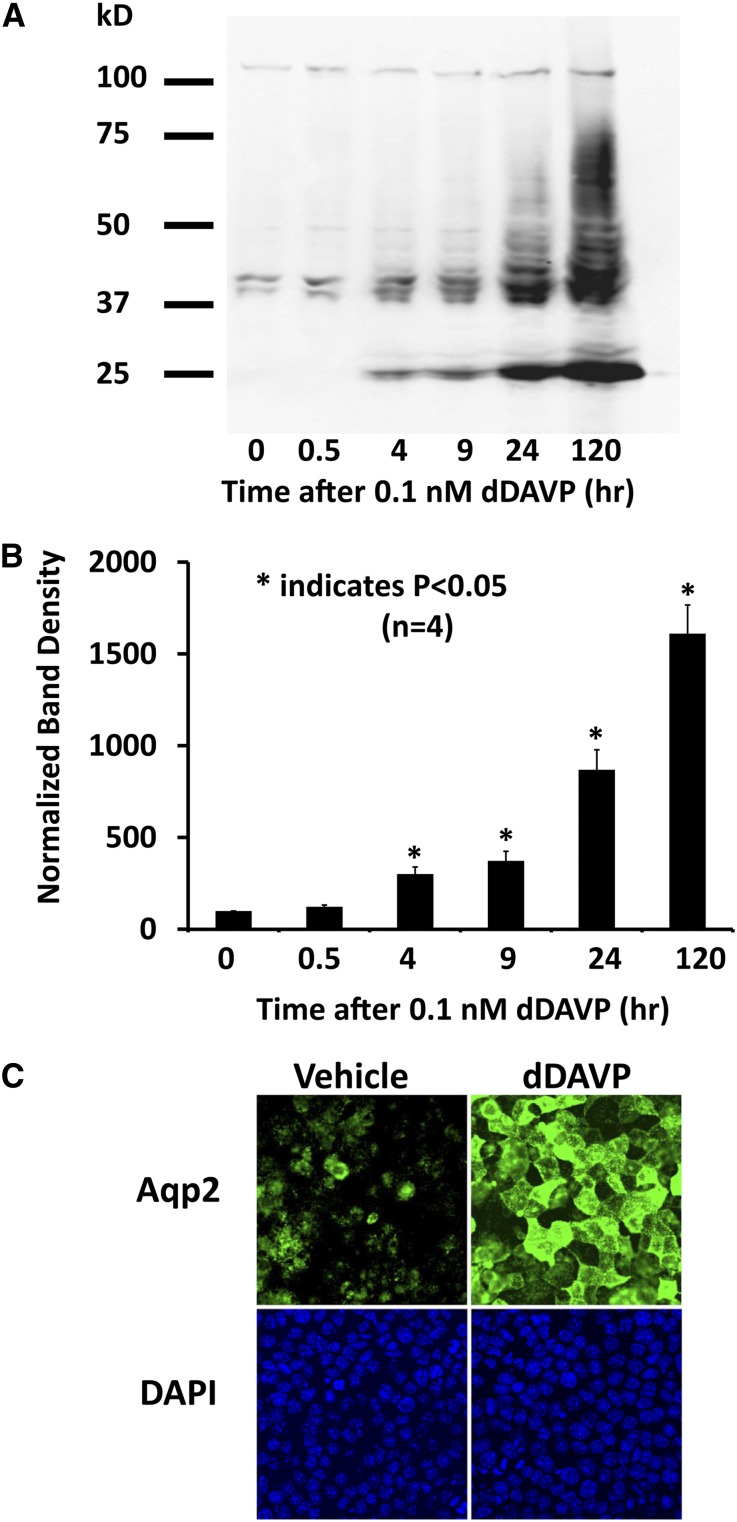
(Supplemental Material), where XdDAVP/XVeh is the relative abundance of a given protein (dDAVP versus vehicle) determined by independent SILAC experiments (standard mode). (Note that measured changes in translation rate could theoretically be caused by changes in mRNA abundances or intrinsic changes in the translation process, and our methodology does not distinguish between these two mechanisms.) The distribution of relative translation rates for 1620 proteins is shown in Figure 5 in the form of a volcano plot (http://helixweb.nih.gov/ESBL/Database/ProteinHalfLives/GeneSymbolATR.html) (Supplemental Dataset 8). In all, 151 of 1620 proteins showed vasopressin-induced changes in translation rate. One of them was AQP2, which showed an increase in translation rate of ∼10-fold (Figure 5). Thus, both half-life and translation rate are regulated for the AQP2 protein. The increase in translation rate is, in part (if not solely), caused by an increase in the cellular abundance of AQP2 mRNA.8–11,13 The increase in half-life predicts increases in AQP2 protein abundance within a few hours of the vasopressin stimulus. To test this result, we carried out immunoblotting for AQP2 (Figure 6A), revealing a significant increase in AQP2 after 4 hours. However, the ultimate increase in AQP2 abundance seen after 120 hours of vasopressin exposure (likely caused by increased translation) dwarfed the changes seen at 4 and 9 hours (Figure 6B). Immunofluorescence labeling of AQP2 after long-term vasopressin exposure (120 hours) confirmed the large increase in AQP2 abundance seen by immunoblotting (Figure 6C).
Figure 5.
Vasopressin analog changes the translation rate of many proteins in mpkCCD cells. One hundred fifty-one proteins were in the upper right or upper left quadrants, indicative of significant changes. Several proteins that have been shown to be involved in vasopressin signaling are labeled. Additional groups include proteins involved in glutathione metabolism and several small guanosine triphosphate (GTP) binding proteins.
Figure 6.
The vasopressin analog dDAVP significantly increases levels of the AQP2. mpkCCD cells were incubated in the absence or presence of 0.1 nM dDAVP for different times from 0.5 to 120 hours. (A) A representative immunoblot showing the levels of AQP2. (B) Quantification of band densities from replicate immunoblots (n=4) shows a significant increase of AQP2 levels after 4 hours. P values were calculated using ANOVA. (C) AQP2 immunofluorescence confirms this increase in abundance after 120 hours of dDAVP treatment, showing strong apical membrane localization. *P<0.05. DAPI, 4',6-diamidino-2-phenylindole.
A small rapid increase in AQP2 protein abundance in response to vasopressin was also seen in the work by Nedvetsky et al.12 in cultured IMCD cells. In that study, a significant increase was seen within 0.5 hours, which implies that the protein half-life of AQP2 must have been much shorter in the cells studied by Nedvestsky et al.12 versus our study. The data from both studies correlate well with the observation that a reduction in vasopressin signaling, mimicked by washout of forskolin, results in an increase in AQP2 ubiquitylation,19 a well known signal for protein degradation.
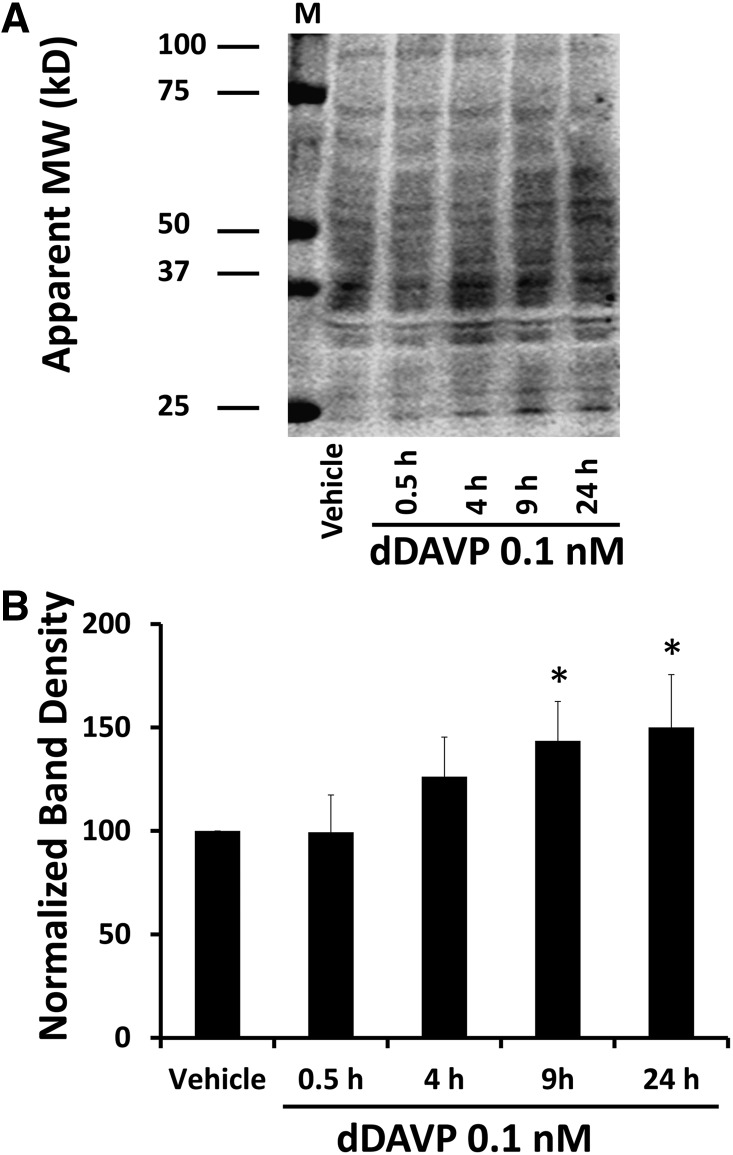
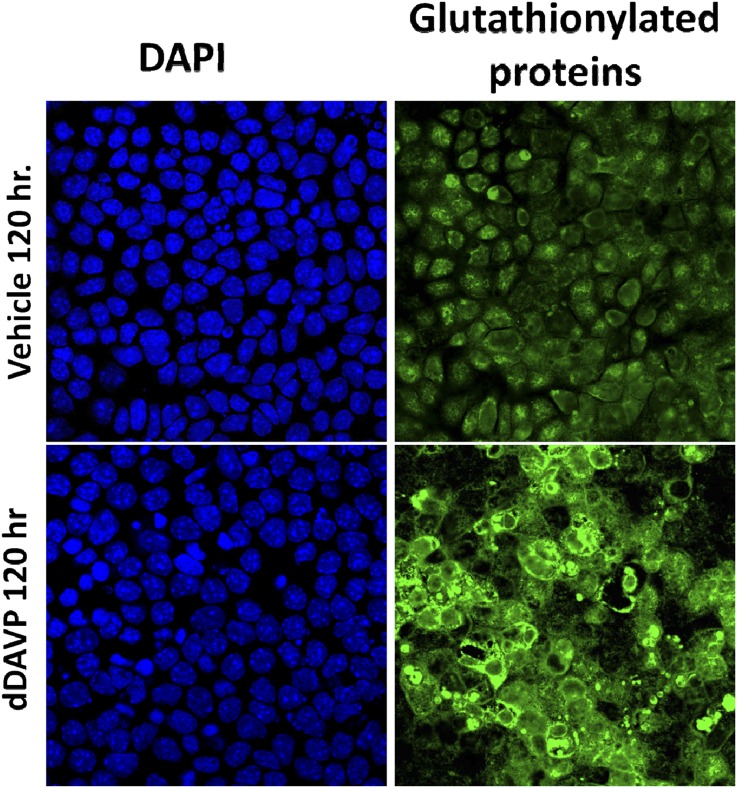
Figure 5 also shows several additional proteins with translation rates that change in response to dDAVP that are potentially involved in vasopressin signaling and/or AQP2 regulation: Mal2, Akap12, gelsolin, myosin light chain kinase, annexin-2, and Hsp70 (Supplemental Dataset 8). Also of interest is the finding that seven glutathione S-transferase (GST) proteins show increased translation (Figure 5). These proteins are GST-ζ1, GST-α4, GST-θ2, GST-θ3, GST-μ1, GST-μ2, and GST-π1. GST proteins function to conjugate the tripeptide glutathione to a variety of substrates, including cysteines present in proteins. Based on this result, we hypothesized that vasopressin may increase protein glutathionylation in mpkCCD cells. To test this hypothesis, we carried out immunoblotting using an antibody that recognizes glutathione covalently linked to proteins (Figure 7A). Treatment for 9 hours or more resulted in significant increases in protein glutathionylation (Figure 7B). Immunofluorescence labeling of glutathionylated proteins in mpkCCD cells confirmed the increase, showing greater GST labeling in response to dDAVP for 72 hours (Figure 8). Several of the upregulated GST genes are known to be regulated transcriptionally through a so-called antioxidant regulatory element, which binds the transcription factor Nrf2.20 In addition, the translation rate for another antioxidant regulatory element-regulated protein was significantly increased, namely glutamate-cysteine ligase regulatory subunit Gclm.21
Figure 7.
dDAVP significantly increases levels of the glutathionylated proteins. mpkCCD cells were incubated in the absence or presence of 0.1 nM dDAVP for different times from 0.5 to 24 hours. Immunoblots were probed with antibody that recognizes glutathione conjugates. (A) A representative immunoblot showing labeled glutathionylated proteins. (B) Quantification of densities over entire lanes from replicate immunoblots (n=5) shows a significant increase of glutathionylated proteins after 9 hours. P values were calculated using ANOVA. M, molecular weight markers; MW, molecular weight. *P<0.05.
Figure 8.
The vasopressin analog dDAVP increases abundance of glutathionylated proteins. Immunofluorescence labeling using an antibody that recognizes glutathione that is covalently linked to proteins (green) shows an increase in glutathionylation in response to dDAVP after 3 days; 4',6-diamidino-2-phenylindole (DAPI) indicates location of nuclei in the same microscopic fields.
Subpopulations of Proteins with Short or Long Half-Lives
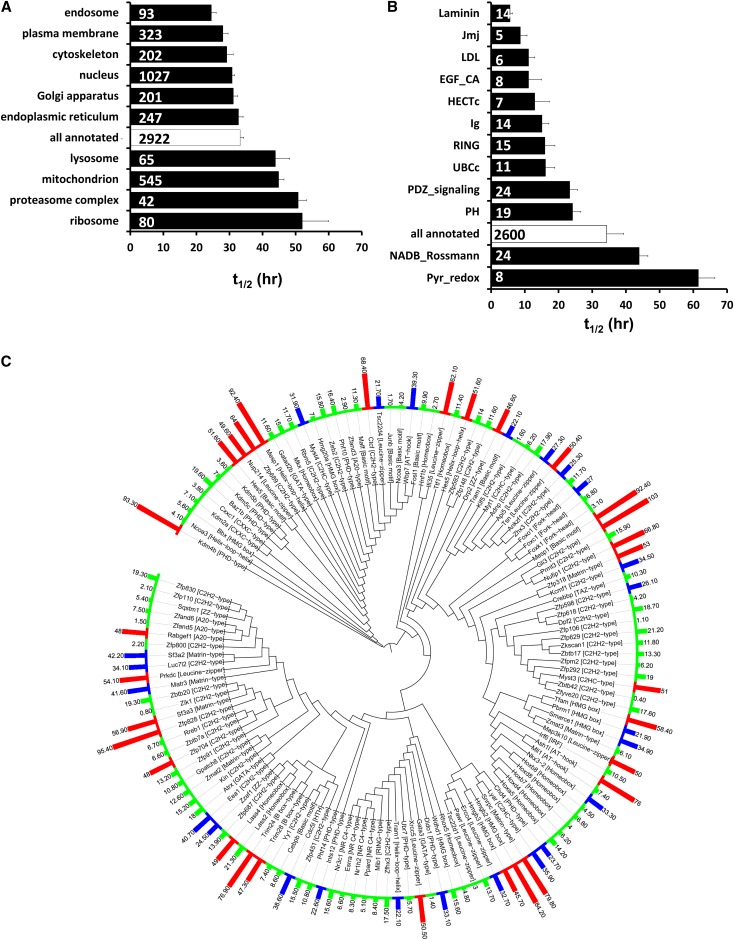
Aside from the question of what proteins are regulated by vasopressin, the comprehensive determination of protein half-lives throughout the mpkCCD cell proteome provides a substantial resource that is useful to understanding regulatory processes in epithelia. These data provide insight into the turnover of many proteins involved in vasopressin trafficking or vasopressin-mediated transcriptional regulation and also provide information useful for design of experiments addressing mechanisms of vasopressin action. Accordingly, we next analyzed the relationship between protein half-life and protein properties to address the determinants of protein half-life in these epithelial cells. Figure 9A shows mean half-lives for subpopulations of proteins segregated on the basis of Gene Ontology (GO) cellular component terms (Supplemental Dataset 2). Subpopulations associated with t1/2 values lower than the general mean (all annotated) include those subpopulations with the GO terms “endosome” and “plasma membrane,” pointing to a possible association between plasma membrane trafficking and short t1/2. It seems possible that proteins processed in the endoplasmic reticulum possess relatively low t1/2 values because of the highly stringent quality control mechanisms there.22 In contrast, GO terms with long t1/2 include several organelles, including “ribosome,” “mitochondrion,” and “peroxisome” structures that turn over by autophagy.23 Note that proteins intrinsic to the lysosome and proteasome have relatively long t1/2, suggesting that autodegradation of these structures is effectively avoided. We propose that each of several mechanisms of protein removal from cells may be associated with a characteristic range of half-lives, forming a spectrum from short (endosomal targeting to lysosomes, regulated intramembrane proteolysis, and secretion) through intermediate (proteasomal degradation) to long t1/2 proteins (autophagy).
Figure 9.
Half-lives of proteins vary according to structural and functional groupings. (A) t1/2 of proteins in selected GO cellular component groups. Number inside of bars indicates the number of proteins in that group. Additional GO cellular component terms with exceptionally low t1/2 not shown include “nuclear body” (13.8±3.2 hours), “lateral plasma membrane” (18.7±3.8), “cell–cell adherens junction“ (21.7±2.8), “spindle microtubule” (20.7±3.6), and “prefoldin complex” (18.9±3.9) (Supplemental Dataset 2). Additional GO cellular component terms with high t1/2 not shown include proteins contained in large protein complexes involved in nucleic acid regulation, including ”ribonucleoprotein complex“ (51.5±4.7) and “nucleosome“ (87.4±14.1) (Supplemental Dataset 2). (B) t1/2 of proteins in selected conserved domain groups. Values are compared with t1/2 for all proteins with annotations in the respective databases (all annotations). Number inside of bars indicates the number of proteins in that group. (C) Dendrogram showing t1/2 of transcription factors. Proteins are clustered according to sequence similarity of DNA binding domains. Short t1/2 (first quartile of all proteins) is indicated by green bars. Long t1/2 (fourth quartile) is indicated by red bars. Generated using Interactive Tree of Life software (http://itol.embl.de).39
Many proteins contain specialized domains that play roles in degradation. Figure 9B shows mean t1/2 calculated for subpopulations of proteins segregated on the basis of protein domains extracted from the Conserved Domain Database and Swiss-Prot protein records (Supplemental Dataset 3). Domains with short t1/2 include many associated with protein ubiquitylation, including two domains integral to ubiquitin E3 ligases (HECT and RING) as well as the UBCc domain characteristic of E2 ligases. E3 ligases may have low t1/2 values, because they undergo autoubiquitylation.24 Other domains associated with short t1/2 proteins include laminin domain (secreted proteins associated with basement membrane) and several domains of integral membrane proteins with large extracellular regions, namely the LDL, EGF_CA, and Ig domains. The Jmj domain, present in a family of histone demethylases,25 is also associated with low t1/2 values.
Some additional groups of proteins not shown in Figure 9 have very short half-lives, including (1) proteins documented to be modified by regulated intramembrane proteolysis (9.6±1.8 hours),26 viz. Sdc1, Sorl1, Cdh1, Epcam, Lrp1, Lrp2, Itm2b, and App; and (2) transcription factors (25.6±1.3 hours) (Supplemental Dataset 4). Figure 9C shows t1/2 values for all transcription factors clustered by DNA binding domain sequences. Some groups of transcription factors have exceptionally low t1/2 (<10 hours), including Hox proteins, nuclear receptors, and some subclasses of zinc finger proteins. The low half-lives of these transcription factors presumably are necessary to allow rapid transcriptional regulation.
GO biologic process terms with short t1/2 (<21.3 hours) include those terms associated with cell adhesion, endosomal trafficking, cell cycle regulation, transcriptional regulation, and protein ubiquitylation (Supplemental Dataset 5). All of these processes can be rapidly modulated. Short half-life is a prerequisite for regulatory mechanisms that are dependent on rapid changes in protein abundance by either altered production or degradation.27
N-Terminal Sequence and Protein Half-Life
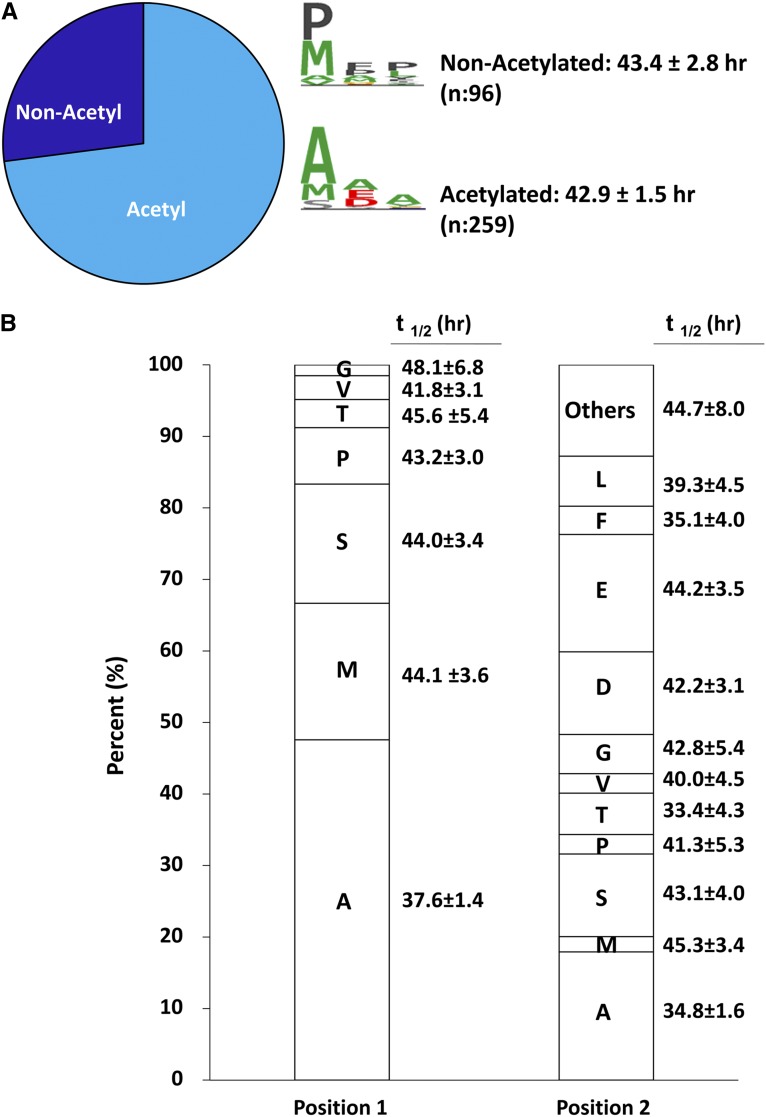
A role for the N-terminal structure of proteins as a determinant of half-lives has been proposed in the form of the N-end rule.28 Using the eukaryotic N-end rule, certain amino acids (V, M, G, P, and I) in position 1 predict a long half-life. Any of the other amino acids in position 1 predict a short half-life if there is at least one lysine in positions 8–20 that can act as a target for ubiquitylation.29 Furthermore, N-terminal acetylation has been proposed to be a determinant of protein stability.30 To identify N-terminal peptides in mpkCCD cells, we carried out additional mass spectrometry experiments in untreated cells (without SILAC labeling) and identified peptides that correspond to annotated N termini with or without the added mass of an acetyl group and with or without an intact initial methionine (Figure 10 and Supplemental Dataset 6). As shown in Figure 10A, acetylated N-terminal peptides outnumbered nonacetylated N-terminal peptides, and the presence of acetylation was not associated with a difference in t1/2. AQP2 was one of the proteins identified with N-terminal acetylation. The distribution of amino acids in positions 1 and 2 of the identified N-terminal peptides is shown in Figure 10B. Note that the initiator methionine was cleaved in ∼80% of the identified N termini. Aside from a tendency to lower t1/2 for proteins with N termini with alanine in positions 1 and 2, there was not a strong relationship between the amino acids in these positions and t1/2.
Figure 10.
There is little relationship between protein N-terminal structure and protein half-life. (A) Of 310 N-terminal peptides found by shotgun profiling, about three quarters had N-terminal acetylation, but mean t1/2 of N-acetylated versus nonacetylated proteins did not differ. Consensus N-terminal amino acid sequences for both groups of proteins are shown in middle. (B) Percentage of amino acids in positions 1 and 2 of MS-identified N-terminal peptides with associated t1/2.
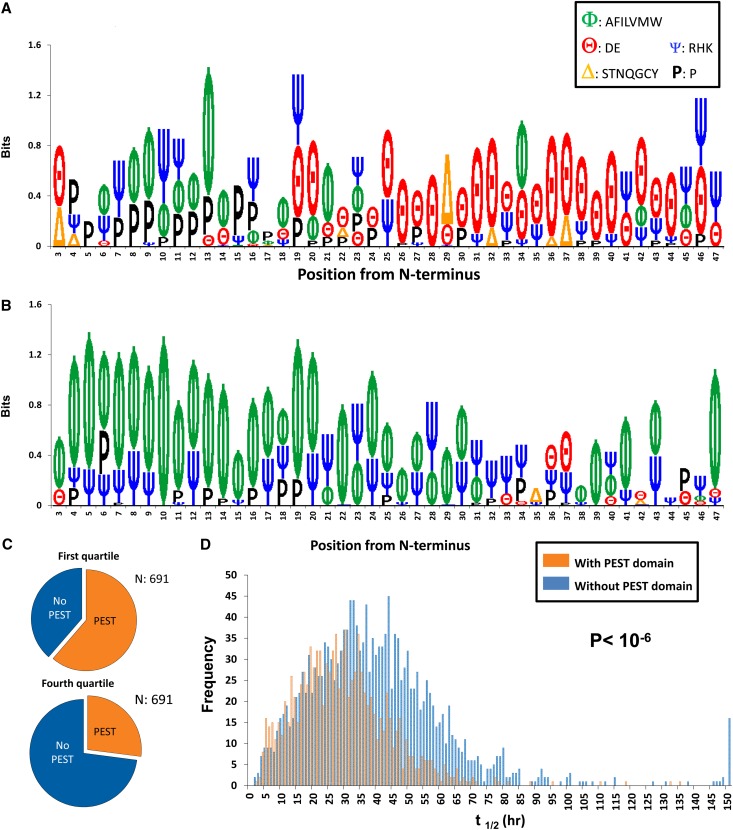
To apply an unbiased search for N-terminal sequences that correlate with t1/2, we have generated sequence logos using an informatin-theoretic model (Supplemental Material) to show over-represented amino acids in the N-terminal regions of proteins in the first quartile of t1/2 (<21.3 hours) (Figure 11A) versus the last quartile of t1/2 (>45.6 hours) (Figure 11B). There was a stark difference. The logo for the short t1/2 population showed a predominance of acidic amino acids (red θ in positions 17–45 downstream from the N terminus). There was also an enrichment of prolines (black P) upstream from the acidic region. In contrast, long t1/2 proteins had a predominance of hydrophobic amino acids (green Φ [A, F, I, L, V, M, and W]) in the initial 17 amino acids.
Figure 11.
Presence of PEST motif correlates with protein half-life. (A) Sequence logo showing position-specific enrichment of amino acid classes in low t1/2 proteins (<21.3 hours; first quartile of all values). Generated using Phosphologo software (http://helixweb.nih.gov/PhosphoLogo/).40 (B) Sequence logo showing position-specific enrichment of amino acid classes in high t1/2 proteins (>45.6 hours; fourth quartile). (Supplemental Figure 2 shows all four quartiles.) (C) Fraction of proteins with computationally identified PEST domains in first and fourth quartiles. (D) The t1/2 distributions for proteins with or without computationally identified PEST domains.
The pattern shown in Figure 11A suggests a role for PEST domains as a determinant of protein t1/2.31 They are tracts of at least 12 amino acids that completely lack positively charged amino acids and are enriched in P, E, D, S, and T. (“PEST” domains are named for four of their most abundant amino acids P, E, S, and T.) We used the algorithm in the work by Rogers et al.31 (recoded in Java for large-scale implementation) (Supplemental Material) to identify PEST domains in all proteins with measured t1/2 (Figure 11C). Approximately 61% of proteins in the short t1/2 quartile (<21.3 hours) had predicted PEST domains anywhere in their sequences, whereas predicted PEST domains were found in only 27% of the proteins in the long t1/2 quartile (>45.6 hours). Figure 11D shows a strong rightward shift in the t1/2 distribution for all proteins without predicted PEST domains relative to those proteins with predicted PEST domains. PEST domains are believed to be important signals for the targeting protein ubiquitylation to particular lysines,31 providing a potential explanation for their relationship to t1/2.
Concise Methods
Cell Culture and Dynamic SILAC
Cultured mouse mpkCCD (clone 11) cells11 were grown as described.13 Protein t1/2 was measured using a dynamic SILAC technique similar to the technique described by Doherty et al.14 (Figure 1). After initial growth in flasks (at least 3 days) containing complete medium (advanced DMEM/F12 medium; 12634–010; Invitrogen, Carlsbad, CA) containing 2% dialyzed serum plus light amino acids (91 mg/ml 12C-lysine and 147 mg/L [12C, 14N] arginine, supplied with MS10033; Invitrogen), cells were transferred to permeable supports (Transwell), grown until confluency, documented by transepithelial resistance measurements (Epithelial Volt ohmmeter; WPI). At that point, the serum was removed, and cells were maintained for 7 more days in light medium before switching to a serum-free medium containing heavy stable isotopes (the same DMEM/F12 medium plus heavy amino acids [91 mg/L 13C6 lysine, supplied with MS10033; Invitrogen] and 147 mg/L [13C6, 15N4] arginine [MS10009; Invitrogen]). In some cases, the order was switched. Peptides labeled with heavy isotopes possess an extra mass of either 10.008269 kDa (arginine) or 6.020129 kDa (lysine). Cells were harvested at various time points after the light to heavy switch for liquid chromatography-tandem mass spectrometry (LC-MS/MS) quantification. When the V2 receptor-selective vasopressin analog dDAVP was included (0.1 nM), it was present in the basolateral medium continuously starting 5 days before switching from light to heavy amino acids. The apical and basolateral media were changed daily.
Standard SILAC for Determination of Vasopressin Effects on Steady State Protein Abundances
Measurements of vasopressin effects on translation rates require measurements of the ratios of abundances of individual proteins at steady state. This measurement was achieved by independent parallel experiments using steady state SILAC labeling as described.13
Mass Spectrometry
A full description is given in Supplemental Material. Briefly, the cells were harvested and separated by one-dimensional SDS-PAGE followed by gel slicing, in-gel trypsinization, and LC-MS/MS analysis (LTQ-Orbitrap; Thermo-Finnigan). MS spectra were matched to peptide sequences using a combination of SEQUEST,32 InsPecT,33 and OMSSA.34 Peak masses were searched against the most current version of the Mouse RefSeq Database (National Center for Biotechnology Information). For isotopic labeling, variable modifications of 10.008269 Da for arginine and 6.020129 Da for lysine were included. Target-decoy analysis was used to limit peptide false discovery rate to <1%.35 Peptides that matched more than one protein were labeled as ambiguous using ProMatch software36 and were not used in any additional analysis.
Relative quantification of peptides was performed using QUIL software.37 K-means clustering of peak intensities throughout the MS run was used to define a characteristic value for background noise. Based on this result, the minimal intensity threshold was 3500 (i.e., all peaks below this value were considered noise).
Additional mpkCCD cells grown under identical conditions, except for the stable isotope labeling, were profiled by MS as above, and the resulting spectral dataset was analyzed using Mascot to identify N-terminal peptides, whether the initiator methionine was cleaved, and whether the N-terminal amino acid was acetylated.
Immunoblotting
Samples were diluted in Laemmli buffer (10 mM Tris, pH 6.8, 1.5% SDS, 6% glycerol, 0.05% bromophenol blue, and 40 mM dithiothreitol) and subjected to SDS-PAGE. Immunoblot analysis using nitrocellulose membranes was performed as described previously.38 Both blocking buffer and infrared dye-coupled secondary antibodies were obtained from LI-COR (Lincoln, NE). Fluorescence signals from discrete bands were read out using the LI-COR Odyssey System. The anti-AQP2 antibody was from Hoffert et al.38 A mouse monoclonal antibody recognizing glutathionylated proteins (antiglutathione; 101-A) was purchased from Virogen (Boston, MA) and used at nonreducing conditions following the manufacturer's protocol. Paired t tests or ANOVAs followed by the appropriate post-test were performed for each dataset.
Immunofluorescence Microscopy
Immunofluorescence labeling was done as described in the work by Yu et al.,11 except that the blocking agent was 0.2% gelatin plus 0.5% BSA. Anti-AQP2 and antiglutathione antibodies were used at 1:500 and 1:100, respectively. Confocal fluorescence micrographs were obtained using a Zeiss LSM 510 microscope (Carl Zeiss; National Heart, Lung and Blood Institute, Light Microscopy Core Facility).
Disclosures
None.
Supplementary Material
Acknowledgments
Mass spectrometry was conducted in the National Heart, Lung and Blood Institute (NHLBI) Proteomics Core Facility (director, Marjan Gucek). Immunofluorescence microscopy was carried out in the NHLBI Light Microscopy Core Facility (director, Christian Combs). The authors thank Kelli Luginbuhl, Markus Rinschen, and Jae Song for technical help.
This work was funded by the operating budget of the Division of Intramural Research, NHLBI (Project ZO1-HL001285; to M.A.K.).
Footnotes
Published online ahead of print. Publication date available at www.jasn.org.
This article contains supplemental material online at http://jasn.asnjournals.org/lookup/suppl/doi:10.1681/ASN.2013030279/-/DCSupplemental.
References
- 1.Nielsen S, Chou CL, Marples D, Christensen EI, Kishore BK, Knepper MA: Vasopressin increases water permeability of kidney collecting duct by inducing translocation of aquaporin-CD water channels to plasma membrane. Proc Natl Acad Sci U S A 92: 1013–1017, 1995 [DOI] [PMC free article] [PubMed] [Google Scholar]
- 2.Wall SM, Han JS, Chou CL, Knepper MA: Kinetics of urea and water permeability activation by vasopressin in rat terminal IMCD. Am J Physiol 262: F989–F998, 1992 [DOI] [PubMed] [Google Scholar]
- 3.DiGiovanni SR, Nielsen S, Christensen EI, Knepper MA: Regulation of collecting duct water channel expression by vasopressin in Brattleboro rat. Proc Natl Acad Sci U S A 91: 8984–8988, 1994 [DOI] [PMC free article] [PubMed] [Google Scholar]
- 4.Kishore BK, Terris JM, Knepper MA: Quantitation of aquaporin-2 abundance in microdissected collecting ducts: Axial distribution and control by AVP. Am J Physiol 271: F62–F70, 1996 [DOI] [PubMed] [Google Scholar]
- 5.Nielsen S, Frøkiaer J, Marples D, Kwon TH, Agre P, Knepper MA: Aquaporins in the kidney: From molecules to medicine. Physiol Rev 82: 205–244, 2002 [DOI] [PubMed] [Google Scholar]
- 6.Hayashi M, Sasaki S, Tsuganezawa H, Monkawa T, Kitajima W, Konishi K, Fushimi K, Marumo F, Saruta T: Role of vasopressin V2 receptor in acute regulation of aquaporin-2. Kidney Blood Press Res 19: 32–37, 1996 [DOI] [PubMed] [Google Scholar]
- 7.Ecelbarger CA, Nielsen S, Olson BR, Murase T, Baker EA, Knepper MA, Verbalis JG: Role of renal aquaporins in escape from vasopressin-induced antidiuresis in rat. J Clin Invest 99: 1852–1863, 1997 [DOI] [PMC free article] [PubMed] [Google Scholar]
- 8.Yasui M, Zelenin SM, Celsi G, Aperia A: Adenylate cyclase-coupled vasopressin receptor activates AQP2 promoter via a dual effect on CRE and AP1 elements. Am J Physiol 272: F443–F450, 1997 [DOI] [PubMed] [Google Scholar]
- 9.Hozawa S, Holtzman EJ, Ausiello DA: cAMP motifs regulating transcription in the aquaporin 2 gene. Am J Physiol 270: C1695–C1702, 1996 [DOI] [PubMed] [Google Scholar]
- 10.Furuno M, Uchida S, Marumo F, Sasaki S: Repressive regulation of the aquaporin-2 gene. Am J Physiol 271: F854–F860, 1996 [DOI] [PubMed] [Google Scholar]
- 11.Yu MJ, Miller RL, Uawithya P, Rinschen MM, Khositseth S, Braucht DW, Chou CL, Pisitkun T, Nelson RD, Knepper MA: Systems-level analysis of cell-specific AQP2 gene expression in renal collecting duct. Proc Natl Acad Sci U S A 106: 2441–2446, 2009 [DOI] [PMC free article] [PubMed] [Google Scholar]
- 12.Nedvetsky PI, Tabor V, Tamma G, Beulshausen S, Skroblin P, Kirschner A, Mutig K, Boltzen M, Petrucci O, Vossenkämper A, Wiesner B, Bachmann S, Rosenthal W, Klussmann E: Reciprocal regulation of aquaporin-2 abundance and degradation by protein kinase A and p38-MAP kinase. J Am Soc Nephrol 21: 1645–1656, 2010 [DOI] [PMC free article] [PubMed] [Google Scholar]
- 13.Khositseth S, Pisitkun T, Slentz DH, Wang G, Hoffert JD, Knepper MA, Yu MJ: Quantitative protein and mRNA profiling shows selective post-transcriptional control of protein expression by vasopressin in kidney cells. Mol Cell Proteomics 10: 004036, 2011 [DOI] [PMC free article] [PubMed] [Google Scholar]
- 14.Doherty MK, Hammond DE, Clague MJ, Gaskell SJ, Beynon RJ: Turnover of the human proteome: Determination of protein intracellular stability by dynamic SILAC. J Proteome Res 8: 104–112, 2009 [DOI] [PubMed] [Google Scholar]
- 15.Schwanhäusser B, Gossen M, Dittmar G, Selbach M: Global analysis of cellular protein translation by pulsed SILAC. Proteomics 9: 205–209, 2009 [DOI] [PubMed] [Google Scholar]
- 16.Hasler U, Mordasini D, Bens M, Bianchi M, Cluzeaud F, Rousselot M, Vandewalle A, Feraille E, Martin PY: Long term regulation of aquaporin-2 expression in vasopressin-responsive renal collecting duct principal cells. J Biol Chem 277: 10379–10386, 2002 [DOI] [PubMed] [Google Scholar]
- 17.Hendriks G, Koudijs M, van Balkom BW, Oorschot V, Klumperman J, Deen PM, van der Sluijs P: Glycosylation is important for cell surface expression of the water channel aquaporin-2 but is not essential for tetramerization in the endoplasmic reticulum. J Biol Chem 279: 2975–2983, 2004 [DOI] [PubMed] [Google Scholar]
- 18.Baumgarten R, Van De Pol MH, Wetzels JF, Van Os CH, Deen PM: Glycosylation is not essential for vasopressin-dependent routing of aquaporin-2 in transfected Madin-Darby canine kidney cells. J Am Soc Nephrol 9: 1553–1559, 1998 [DOI] [PubMed] [Google Scholar]
- 19.Kamsteeg EJ, Hendriks G, Boone M, Konings IB, Oorschot V, van der Sluijs P, Klumperman J, Deen PM: Short-chain ubiquitination mediates the regulated endocytosis of the aquaporin-2 water channel. Proc Natl Acad Sci U S A 103: 18344–18349, 2006 [DOI] [PMC free article] [PubMed] [Google Scholar]
- 20.Nguyen T, Sherratt PJ, Pickett CB: Regulatory mechanisms controlling gene expression mediated by the antioxidant response element. Annu Rev Pharmacol Toxicol 43: 233–260, 2003 [DOI] [PubMed] [Google Scholar]
- 21.Solis WA, Dalton TP, Dieter MZ, Freshwater S, Harrer JM, He L, Shertzer HG, Nebert DW: Glutamate-cysteine ligase modifier subunit: Mouse Gclm gene structure and regulation by agents that cause oxidative stress. Biochem Pharmacol 63: 1739–1754, 2002 [DOI] [PubMed] [Google Scholar]
- 22.Brodsky JL: Cleaning up: ER-associated degradation to the rescue. Cell 151: 1163–1167, 2012 [DOI] [PMC free article] [PubMed] [Google Scholar]
- 23.Kirkin V, McEwan DG, Novak I, Dikic I: A role for ubiquitin in selective autophagy. Mol Cell 34: 259–269, 2009 [DOI] [PubMed] [Google Scholar]
- 24.Rotin D, Kumar S: Physiological functions of the HECT family of ubiquitin ligases. Nat Rev Mol Cell Biol 10: 398–409, 2009 [DOI] [PubMed] [Google Scholar]
- 25.Hou H, Yu H: Structural insights into histone lysine demethylation. Curr Opin Struct Biol 20: 739–748, 2010 [DOI] [PMC free article] [PubMed] [Google Scholar]
- 26.Lal M, Caplan M: Regulated intramembrane proteolysis: Signaling pathways and biological functions. Physiology (Bethesda) 26: 34–44, 2011 [DOI] [PubMed] [Google Scholar]
- 27.Schwanhäusser B, Busse D, Li N, Dittmar G, Schuchhardt J, Wolf J, Chen W, Selbach M: Global quantification of mammalian gene expression control. Nature 473: 337–342, 2011 [DOI] [PubMed] [Google Scholar]
- 28.Bachmair A, Finley D, Varshavsky A: In vivo half-life of a protein is a function of its amino-terminal residue. Science 234: 179–186, 1986 [DOI] [PubMed] [Google Scholar]
- 29.Bachmair A, Varshavsky A: The degradation signal in a short-lived protein. Cell 56: 1019–1032, 1989 [DOI] [PubMed] [Google Scholar]
- 30.Hwang CS, Shemorry A, Varshavsky A: N-terminal acetylation of cellular proteins creates specific degradation signals. Science 327: 973–977, 2010 [DOI] [PMC free article] [PubMed] [Google Scholar]
- 31.Rogers S, Wells R, Rechsteiner M: Amino acid sequences common to rapidly degraded proteins: The PEST hypothesis. Science 234: 364–368, 1986 [DOI] [PubMed] [Google Scholar]
- 32.Eng JK, McCormack AL, Yates JR, III: An approach to correlate tandem mass spectral data of peptides with amino acid sequences in a protein database. J Am Soc Mass Spectrom 5: 976–989, 1994 [DOI] [PubMed] [Google Scholar]
- 33.Tanner S, Shu H, Frank A, Wang LC, Zandi E, Mumby M, Pevzner PA, Bafna V: InsPecT: Identification of posttranslationally modified peptides from tandem mass spectra. Anal Chem 77: 4626–4639, 2005 [DOI] [PubMed] [Google Scholar]
- 34.Geer LY, Markey SP, Kowalak JA, Wagner L, Xu M, Maynard DM, Yang X, Shi W, Bryant SH: Open mass spectrometry search algorithm. J Proteome Res 3: 958–964, 2004 [DOI] [PubMed] [Google Scholar]
- 35.Elias JE, Gygi SP: Target-decoy search strategy for increased confidence in large-scale protein identifications by mass spectrometry. Nat Methods 4: 207–214, 2007 [DOI] [PubMed] [Google Scholar]
- 36.Tchapyjnikov D, Li Y, Pisitkun T, Hoffert JD, Yu MJ, Knepper MA: Proteomic profiling of nuclei from native renal inner medullary collecting duct cells using LC-MS/MS. Physiol Genomics 40: 167–183, 2010 [DOI] [PMC free article] [PubMed] [Google Scholar]
- 37.Wang G, Wu WW, Pisitkun T, Hoffert JD, Knepper MA, Shen RF: Automated quantification tool for high-throughput proteomics using stable isotope labeling and LC-MSn. Anal Chem 78: 5752–5761, 2006 [DOI] [PubMed] [Google Scholar]
- 38.Hoffert JD, Fenton RA, Moeller HB, Simons B, Tchapyjnikov D, McDill BW, Yu MJ, Pisitkun T, Chen F, Knepper MA: Vasopressin-stimulated increase in phosphorylation at Ser269 potentiates plasma membrane retention of aquaporin-2. J Biol Chem 283: 24617–24627, 2008 [DOI] [PMC free article] [PubMed] [Google Scholar]
- 39.Letunic I, Bork P: Interactive Tree Of Life (iTOL): An online tool for phylogenetic tree display and annotation. Bioinformatics 23: 127–128, 2007 [DOI] [PubMed] [Google Scholar]
- 40.Douglass J, Gunaratne R, Bradford D, Saeed F, Hoffert JD, Steinbach PJ, Knepper MA, Pisitkun T: Identifying protein kinase target preferences using mass spectrometry. Am J Physiol Cell Physiol 303: C715–C727, 2012 [DOI] [PMC free article] [PubMed] [Google Scholar]
Associated Data
This section collects any data citations, data availability statements, or supplementary materials included in this article.


