Abstract
A reaction strategy involving functional group selective modification of the O-alkenyl-ether double bond within plasmenyl ether containing lipids using iodine and methanol, in conjunction with functional group selective derivatization of amine-containing lipids using a novel 13C1-S,S′-dimethylthiobutanoylhydroxysuccinimide ester (13C1-DMBNHS) reagent, is shown to improve the capabilities of ‘shotgun’ high resolution/accurate mass spectrometry for comprehensive lipidome analysis. Importantly, the characteristic mass shifts introduced as a result of these derivatization reactions enables the resolution and unambiguous identification of isobaric mass plasmenyl- and plasmanyl-ether containing lipid species from within crude complex lipid extracts, without need for chromatographic fractionation or additional lipid extraction steps prior to analysis. Additionally, the positive ionization mode tandem mass spectrometry fragmentation behavior of the derivatized plasmenyl ether containing glycerophosphocholine and glycerophosphoethanolamine lipids are shown to yield abundant characteristic product ions that directly enable the assignment of their molecular lipid identities.
Keywords: plasmalogen lipid, ether lipid, aminophospholipid, iodine/methanol derivatization, sulfonium ion derivatization, high resolution ESI-MS, CID-MS/MS
INTRODUCTION
Plasmenyl (i.e., 1-O-alkenyl-ether or plasmalogen) and plasmanyl (i.e., 1-O-alkyl-ether) linked glycerophospholipids are known to play a role in the regulation of several cellular membrane functions such as fusion, fission and fluidity, regulating the activity of membrane-bound proteins, and protection against oxidative degradation.1–5) Furthermore, aberrant levels of these lipids within cellular membranes, particularly with respect to decreased plasmenyl glycerophosphoethanolamine (PE) and increased plasmanyl glycerophosphocholine (PC) species, have previously been correlated with the onset and progression of several diseases,6,7) including cancer.8–11) Therefore, the development of methods to enable the identification, characterization and quantification of these biologically relevant molecules could lead to broader knowledge regarding the functional role of ether lipid metabolism in the pathogenesis of disease.
Recently, mass spectrometry (MS) and tandem mass spectrometry (MS/MS) methods have been established as attractive tools for rapid lipidome analysis from complex biological mixtures.12) However, the ability of mass spectrometry to identify, characterize and quantify the individual species present within a complex lipid mixture, even with high resolving power and accurate mass,13,14) can be limited due to the potential for many isobaric mass lipids to be present at the same m/z values. For example, protonated PE lipids containing an even number of total carbons within their fatty acyl or alkyl chains can have the same exact m/z values as the ammoniated adducts of glycerophosphatidic acid (PA) lipids containing two additional carbons and one double bond, as well as with odd chain length PC lipids containing three fewer carbons (e.g., [PE(32 : 0)+H]+=[PA(34 : 1)+NH4]+=[PC(29 : 0)+H]+), while protonated glycerophosphoserine (PS) lipids can overlap in exact m/z with the ammoniated adducts of glycerophosphoglycerol (PG) lipids containing two additional double bonds (e.g. [PS(36 : 0)+H]+=[PG(36 : 2)+NH4]+). Furthermore, plasmenyl-ether containing lipids are observed at identical m/z values to plasmanyl-ether containing lipids containing the same headgroup when both species contain the same total number (but different sites) of unsaturation (e.g., [PE(P-36 : 0)+H]+=[PE(O-36 : 1)+H]+). Typically, to differentiate between these species using mass spectrometry methods, MS/MS and -MS3 has been required.15) However, these approaches are not always practical for the characterization of low abundance lipids, particularly when present within complex mixtures. Alternatively, ozone induced dissociation (OzID) has also been reported as a means of locating double bonds in fatty acid chains, and therefore distinguishing between an unsaturated alkyl and a saturated alkenyl.16)
The differentiation of ether lipid species has also previously been achieved by taking advantage of the susceptibility of the alkenyl ether linkage of the plasmenyl lipids to acid hydrolysis compared to alkyl ether or acyl linked lipid species,17) with subsequent separation of the reaction products by HPLC.18) Recently, we described the development and application of a method involving functional group selective chemical modification of PE and PS lipids within crude cellular lipid extracts using a ‘fixed charge’ sulfonium ion containing d6-S,S′-dimethylthiobutanoylhydroxysuccinimide ester (d6-DMBNHS) reagent, followed by mild formic acid hydrolysis of the plasmenyl ether containing lipids, where mass spectrometric analysis before and after the hydrolysis reaction was used to monitor for the disappearance of the plasmenyl ether lipids within the mixture.11) By eliminating the possibility of isobaric mass overlap of PE and PS lipids with the precursor ions of all other lipids in crude lipid extracts, and by differentiating the presence of plasmenyl lipids from isobaric mass plasmanyl lipids, and when combined with MS/MS and/or MS3 for characterization of the individual ‘molecular lipid’ species that were present at each of the ‘sum composition’19) lipid mass values observed in the high resolution mass spectra, this method enabled the unambiguous assignment and differential quantification of over 600 lipid species between a primary colorectal cancer (CRC) cell line, SW480, and its isogenic lymph node metastasized derivative, SW620.11) However, this approach requires the acquisition of two MS spectra, i.e., prior to and following the acid hydrolysis step, thereby increasing instrument and data analysis time. Therefore, it would be beneficial to further develop this analysis strategy to remove the requirement for sample degradation (i.e., acid hydrolysis) and duplicate analyses.
In 1946, Siggia and Edsberg described a simple method for labeling vinyl alkyl ether bonds with iodine and methanol, with quantification by titration.20) The method was later adapted for the quantification of plasmenyl ether lipids by back titration21) and, later, potentiometry.22) Although this reaction results in specific labeling of plasmenyl lipids, which would displace these species from isobaric plasmanyl lipids present in a crude mixture, and would therefore allow identification and quantification of both species by the acquisition of a single mass spectrum when used in conjunction with an aminophospholipid labeling strategy, the chemistry has not yet been adapted for application in a mass spectrometric analysis workflow. Here, therefore, we have adapted the plasmenyl ether specific iodine and methanol derivatization method, in conjunction with the use of a novel 13C1-labelled version of our S,S′-dimethylthiobutanoylhydroxysuccinimide ester reagent (i.e., 13C1-DMBNHS) for functional group selective derivatization of amine-containing lipids, to further improve the capabilities of our ‘shotgun’ high resolution/accurate mass spectrometry workflow for comprehensive lipidome analysis. Additionally, the positive ionization mode tandem mass spectrometry fragmentation behavior of the derivatized plasmenyl ether containing PC and PE lipids have been examined, to demonstrate the utility of this chemical derivatization strategy for improved molecular lipid characterization of plasmenyl ether lipids.
Materials and Methods
Reagents: SW480 cells were purchased from American Type Culture Collection (ATCC) (Manassas, VA). Synthetic lipid standards were from Avanti Polar Lipids, Inc. (Alabaster, AL). RPMI 1640 medium, penicillin and streptomycin antibiotic mix and 0.25% Trypsin-EDTA were obtained from Invitrogen (Carlsbad, CA). LC grade water, methanol (CH3OH), chloroform (CHCl3) and ACS grade isopropanol (IPA) were purchased from Macron Chemicals (Center Valley, PA). Iodine, N,N-dimethylformamide (DMF) and triethylamine (TEA) were from Jade Scientific (Westland, MI). Dichloromethane (DCM) was from Mallinckrodt Chemicals (Phillipsburg, NJ, USA). Acetonitrile (CH3CN) was purchased from EMD Chemicals (San Diego, CA, USA). Ammonium formate was obtained from Alfa Aesar (Ward Hill, MA). Ammonium bicarbonate was from J.T. Baker (Phillipsburg, NJ, USA). 13C-iodomethane (99% 13C) was obtained from Sigma Aldrich (St. Louis, MO, USA). 1H NMR spectra were performed on a Varian Inova 500 MHz instrument and recorded in parts per million (ppm) referenced to the solvent resonances (δ), with coupling constants (J) in hertz (Hz).
Synthesis of 13C1-S,S′-dimethylthiobutanoylhydroxysuccinimide ester (13C1-DMBNHS): Methylthiobutyric hydroxysuccinimide ester (0.231 g, 1 mmol) prepared as described previously,23) and 13C-iodomethane (0.71 g, 5 mmol) were dissolved in 2 mL of CH3CN followed by stirring in the dark at room temperature for 2 days. The resulting solution was then concentrated under reduced pressure. The resultant yellow solid was washed with 10 mL of DCM then dried in vacuo to give 0.28 g (76%) of product as yellow crystals. The product was stored in the dark until further use. 1H NMR (500 MHz, CD3CN): δ 2.67, 2.97 (d, 3H, J=146.0), 2.77 (s, 4H), 2.82, 2.83 (d, 3H, J=4), 2.85 (t, 2H, J=7.0), 3.31 (m, 2H, 3JC–H=3.0, JH–H=7.5).
Cell culture: SW480 cells were routinely cultured in RPMI1640 medium supplemented with 10% FBS, 100 unit/mL penicillin and 100 μg/mL streptomycin at 37°C and 5% CO2 atmosphere. Approximately 2×10⁶ cells were seeded into 75 cm2 culture flask containing 10 mL of the culture medium and cultured until cell density reached 80% confluence. The cells were washed three times with PBS and lifted off the culture plates with 0.25% Trypsin-EDTA. Cell suspensions were centrifuged at 1000 rpm and the cell pellets were washed once with PBS prior to lipid extraction.
Lipid extraction: Extraction of lipids from 2×10⁷ SW480 cells was performed using a modified Folch method, as previously described.11,24,25) Stock solutions were prepared by dissolving the crude lipid extracts in 600 μL of 4 : 2 : 1 IPA/CH3OH/CHCl3. Lipid extracts were stored in 2 mL glass vials with PTFE lined caps (Fisher Scientific, Fairlawn, NJ) at −80°C prior to further analysis.
Derivatization of plasmenyl vinyl ether bonds with iodine and methanol: 10 μL each of 100 μM lipid standards (PE(P-18 : 0/22 : 6), PC(P-18 : 0/22 : 6), PE(14 : 0/14 : 0), PE(18 : 0/22 : 6), PC(14 : 0/14 : 0), PC(18 : 1/18 : 1), PC(18 : 2/18 : 2), TG(14 : 0/16 : 1/14 : 0), TG(16 : 0/16 : 0/18 : 1), TG(18 : 1/16 : 0/18 : 1) and TG(18 : 0/18 : 0/18 : 1)) were dried under a stream of nitrogen then redissolved in 60 μL ice cold 2 : 1 CHCl3/CH3OH with 2 mM ammonium bicarbonate and 0.167 mM iodine (i.e., a 5 fold molar excess with respect to the total plasmenyl lipid concentration). For cell extract reactions, 5 μL of the stock SW480 lipid extract and 10 μL each of 10 μM PC(14 : 0/14 : 0) and PE(14 : 0/14 : 0) were combined then dried under a stream of nitrogen, then redissolved in 60 μL ice cold 2 : 1 CHCl3/CH3OH with 2 mM ammonium bicarbonate and 1.33 mM iodine (estimated to be a 10 fold molar excess with respect to the total plasmenyl lipid concentration). The solutions were reacted in an ice bath for 5 min and dried under a stream of nitrogen. The resulting products were then re-dissolved in 200 μL 4 : 2 : 1 IPA/CH3OH/CHCl3 containing 20 mM ammonium formate for immediate analysis by MS.
Derivatization of aminophospholipids with 13C1-S,S′-dimethylthiobutanoylhydroxysuccinimide ester (13C1-DMBNHS): 5 μL of the stock SW480 lipid extract and 10 μL each of 10 μM PC(14 : 0/14 : 0) and PE(14 : 0/14 : 0) were combined then dried under a stream of nitrogen, then redissolved in 40 μL of 39 : 1.1 CHCl3/0.00625 M TEA and vortexed for 30 s. 1 μL of 0.00625 M 13C1-DMBNHS in DMF was then added to the lipid mixture and vortexed for 30 min. The reactions were quenched by drying under a stream of nitrogen then re-dissolved in 200 μL 4 : 2 : 1 IPA/CH3OH/CHCl3 containing 20 mM ammonium formate for immediate analysis by MS, or were subjected to iodine/CH3OH derivatization of vinyl ether bonds prior to MS analysis, as described above.
Mass spectrometry analysis: Samples were loaded into a Whatman multichem 96-well plate (Sigma Aldrich, St. Louis, MO) and sealed with Teflon Ultra Thin Sealing Tape (Analytical Sales and Services, Prompton Plains, NJ). The samples were then introduced into a high resolution/accurate mass Thermo Scientific model LTQ Orbitrap Velos mass spectrometer equipped with a dual pressure ion trap and an HCD multipole collision cell (San Jose, CA) with an inlet temperature of 100°C and S-Lens value of 50% using an Advion Triversa Nanomate nano-electrospray ionization (nESI) source (Advion Ithaca, NY) with a spray voltage of 1.4 kV and a gas pressure of 0.3 psi. Mass spectra were acquired in positive ionization mode using the FT analyzer operating at 100,000 resolving power and were signal averaged for 2 min. External calibration of the instrument was performed using the standard Thermo LTQ calibration mixture. All product ion MS/MS experiments were acquired in positive ionization mode on monoisotopically isolated precursor ions with default activation times using the FT analyzer (100,000 resolving power) for 30 s. Higher-energy Collision induced Dissociation (HCD-MS/MS) product ion spectra were acquired with a low m/z limit of 150, while conventional ion trap Collision Induced Dissociation (CID)-MS/MS and -MS3 product ion spectra were acquired with a q-value of 0.17.
RESULTS
Selective derivatization and high-resolution/accurate mass spectrometry of plasmenyl lipids
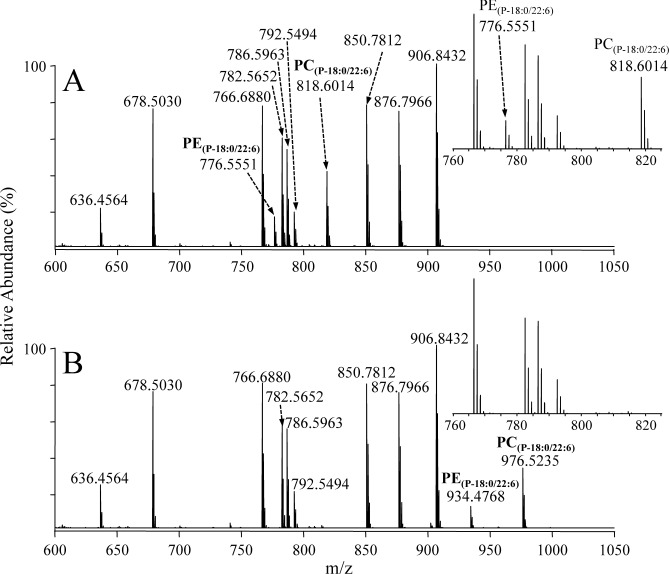
To demonstrate the selectivity and completeness of the iodine and methanol reaction conditions described above for the derivatization of plasmenyl ether lipids, the positive ion mode high-resolution mass spectra acquired from a mixture of synthetic lipid standards (PE(18 : 0/22 : 6), m/z 792.5494, PC(18 : 1/18 : 1), m/z 786.5963, PC(18 : 2/18 : 2), m/z 782.5652, TG(14 : 0/16 : 1/14 : 0), m/z 766.6880, TG(16 : 0/16 : 0/18 : 1), m/z 850.7812, TG(18 : 1/16 : 0/18 : 1), m/z 876.7966, and TG(18 : 0/18 : 0/18 : 1), m/z 906.8432), including two plasmenyl ether glycerophospholipids (PE(P-18 : 0/22 : 6), m/z 776.5551 and PC(P-18 : 0/22 : 6), m/z 818.6014), before and after reaction with iodine/CH3OH, are shown in Figs. 1A and 1B, respectively. From these spectra, it can be seen that complete and selective reaction of the plasmenyl ether lipids within the mixture had occurred, with new ions corresponding to the derivatized plasmenyl PE and PC lipids appearing at m/z 934.4768 (i.e., the addition of 157.9217 Da) and m/z 976.5235 (i.e., the addition of 157.92221 Da), respectively, consistent with the addition of I+OCH3 (calculated mass 157.9229 Da). A low abundance ion at m/z 902.4502 corresponding to the in-source loss of methanol from the [PE(P-18 : 0/22 : 6)+H+I+OCH3]+ ion was also observed. Importantly, despite the presence of numerous mono- and poly-unsaturated fatty acids within the other lipids in the standard mixture, no reaction of these lipids was observed. Furthermore, no change in the relative sensitivity was observed for any of the underivatized or derivatized lipids following the reaction. Note that the reaction was performed at 0°C to ensure that the reaction occurred exclusively with the plasmenyl lipid species. Furthermore, 2 mM ammonium bicarbonate was added to the reaction solution as a buffer to avoid the possibility of acid hydrolysis of the plasmenyl lipids due to the formation of hydriodic acid during the reaction.
Fig. 1. Positive ionization mode ESI high-resolution mass spectrometric analysis of a mixture of PC, PE and TG synthetic lipid standards, including two plasmenyl ether containing PC and PE lipids (A) without derivatization and (B) after reaction with iodine and methanol. The insets to each panel show an expanded region (m/z 760–825) of the mass spectra containing the underivatized plasmenyl PC and PE lipids.
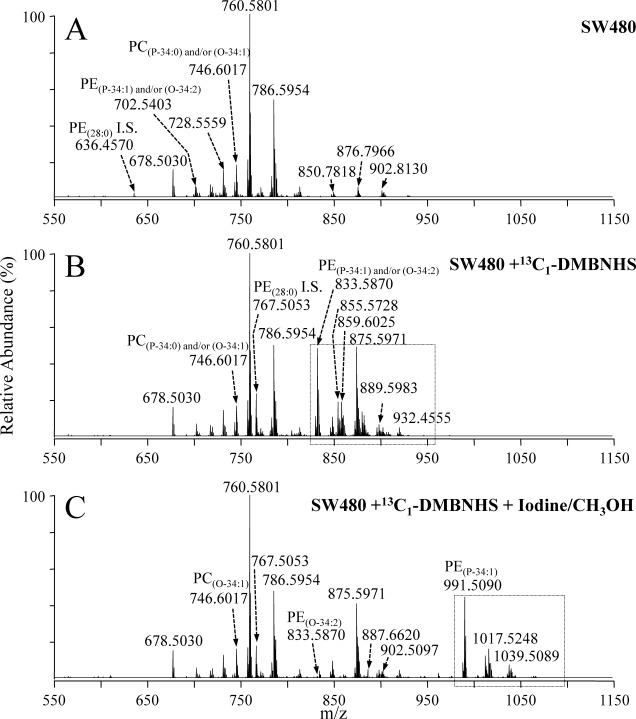
The selective iodine/CH3OH plasmalogen derivatization method was then applied to a crude lipid extract from a colon adenocarcinoma cell line, SW480, that had first been subjected to functional group selective derivatization of the PE and PS aminophospholipids within the mixture using the novel 13C1-S,S′-dimethylthiobutanoylhydroxysuccinimide ester (13C1-DMBNHS) reagent, similar to that recently described.11) The positive ion mode high-resolution mass spectrum of the crude underivatized extract is shown in Fig. 2A, while the spectra obtained following reaction with the 13C1-DMBNHS reagent is shown in Fig. 2B. From a comparison of these spectra, numerous ions in Fig. 2B are observed to appear at m/z values 131.0486 Da higher than that of the underivatized spectra, indicating the presence of 13C1-DMBNHS derivatized PE and PS lipids. For example, m/z 767.5053 in Fig. 2B corresponds to the derivatized form of the PE(28 : 0) internal standard (m/z 636.4570) from Fig. 2A, while m/z 833.5870 in Fig. 2B corresponds to the derivatized form of m/z 702.5403 from Fig. 2A, indicating the presence of a PE(P-34 : 1) and/or PE(O-34 : 2) lipid within the extract.
Fig. 2. Positive ionization mode ESI high-resolution mass spectrometric analysis of a crude lipid extract from the SW480 human adenocarcinoma cell line (A) without derivatization, (B) after reaction with the amine-specific derivatization reagent, 13C1-DMBNHS, and (C) after reaction with 13C1-DMBNHS followed by reaction with iodine and methanol. The boxed regions in panels B and C show the major regions of the spectra in which the derivatized aminophospholipids (+131.0486 Da) and the derivatized plasmenyl lipids (+157.9229 Da) appear, following their respective derivatization reactions.
Upon further treatment of the 13C1-DMBNHS labeled lipid extract with methanol and iodine, numerous lipids appeared at m/z values shifted by 157.9229 Da, indicating the presence of plasmenyl lipids via the addition of I+OCH3. For example, m/z 833.5870 in Fig. 2B had largely shifted to m/z 991.5090 (Fig. 2C) indicating the presence of PE(P-34 : 1), while the residual ion abundance at m/z 833.5870 indicated the presence of PE(O-34 : 2). Consistent with the results from the standard lipid mixture, no change in abundances were observed for any of the other diacyl or alkyl ether containing ions in the crude lipid extract (e.g., m/z 875.5971 corresponding to the 13C1-DMBNHS derivatized diacyl PE(36 : 2), and m/z 746.6017 corresponding to the protonated plasmanyl PC(O-34 : 1)). Interestingly, no in-source fragmentation corresponding to the loss of methanol from the 13C1-DMBNHS derivatized PE plasmenyl lipids derivatized with iodine and methanol were observed, suggestive of an improved stability of the DMBNHS derivatized lipid ions. Notably, from an analysis of the mass spectra in Fig. 2C using the Lipid Mass Spectrum Analysis (LIMSA) v.1.0 software linear fit isotope correction algorithm26) (data not shown), a similar number of lipids were identified compared to our previous report11) indicating that this approach could be successfully employed for the analysis of crude cellular lipid extracts. The results from the application of this improved method, for the identification and quantification of differences in lipid abundances between various colon cancer cell lines, will be reported elsewhere.
MS/MS structural characterization of derivatized plasmenyl PC lipids
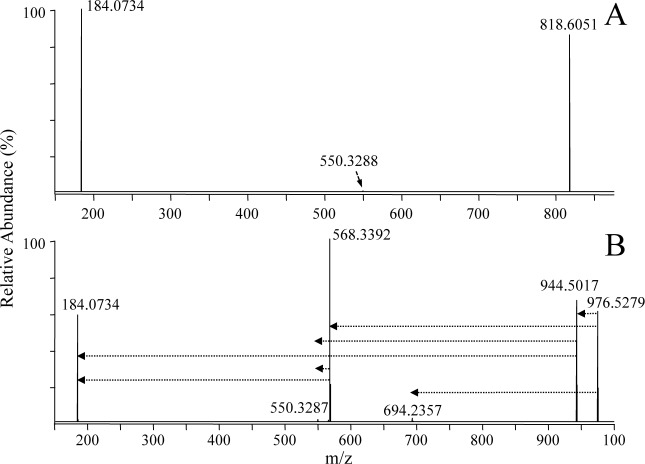
CID-MS/MS of protonated plasmenyl ether PC lipids in positive ionization mode results in the formation of a dominant product ion fragment at m/z 184.0739, corresponding to the phosphocholine headgroup (Scheme 1, pathway a), while the product ion corresponding to characteristic loss of the plasmenyl chain as a neutral alkenyl alcohol (note that an analogous loss is not observed for plasmanyl ether containing PC lipids) (Scheme 1, pathway b),27) is observed only at very low abundance. An example is shown in Fig. 3A for HCD-MS/MS of the PC(P-18 : 0/22 : 6) lipid from Fig. 1A. In negative ionization mode, CID-MS/MS of the acetate or formate adducts of plasmenyl PC lipids results in initial loss of methyl acetate or methyl formate, followed by the formation of a low abundance product ion corresponding to neutral loss of the 2-sn fatty acid. However, as this dissociation behavior does not allow the differentiation of plasmenyl or plasmanyl ether chains, further dissociation by MS3 is typically required.15) Thus, the low abundance of the characteristic product ion in positive ion mode MS/MS, and the necessity for MS3 in negative ion mode, can severely limit the applicability of these methods for the analysis of very low abundant plasmalogen PC lipids that may be present within a complex crude lipid extract.
Scheme 1. Proposed CID-MS/MS fragmentation mechanisms for the plasmenyl ether containing PC(P-18 : 0/22 : 6) lipid, prior to and following reaction with iodine and methanol. The m/z values shown correspond to the calculated masses of the various product ions.
Fig. 3. Positive ionization mode ESI high-resolution HCD-MS/MS analysis of the synthetic lipid standard PC(P-18 : 0/22 : 6) (A) without derivatization and (B) after reaction with iodine and methanol. The horizontal arrows in panel B indicate the fragmentation pathways that were observed upon performing ion trap multistage CID-MSn of the derivatized PC precursor ion.
In contrast, positive ion mode HCD-MS/MS of the iodine/CH3OH derivatized plasmenyl PC lipid (i.e., [PC(P-18 : 0/22 : 6)+I+OCH3+H]+ (m/z 976.5279) from Fig. 1B) (Fig. 3B), resulted in the formation of a dominant product ion corresponding to characteristic cleavage of the derivatized plasmenyl ether chain with neutral loss of a characteristic R1′CICHOCH3 alkene (m/z 568.3392), that directly enabled assignment of the molecular lipid identity (i.e., PC(P-18 : 0/22 : 6) rather than PC(O-18 : 1/22 : 6)), as well as an abundant product ion at m/z 944.5017 corresponding to the loss of methanol, both of which also underwent further dissociation to yield the abundant PC headgroup specific ion at m/z 184.0734. Mechanistic proposals for formation of each of these product ions, supported by the high resolution/accurate mass performance of the Orbitrap mass spectrometer, and data acquired via ion trap multistage CID-MSn experiments (the sequential fragmentation pathways observed from these experiments are shown as dotted lines in the figures), are shown in Scheme 1, pathways c and d, respectively. Note that the low abundance ion at m/z 694.2357 in Fig. 3B, corresponding to loss of the 1-sn alkenyl chain as a neutral R′CHCHOCH3 alkene via the pathway proposed in Scheme 1, pathway e, is likely to be observed only for C22 : 6 fatty acyl chain containing plasmenyl lipids, due to the specific sites of unsaturation located within this particular acyl chain.
MS/MS structural characterization of derivatized plasmenyl PE lipids
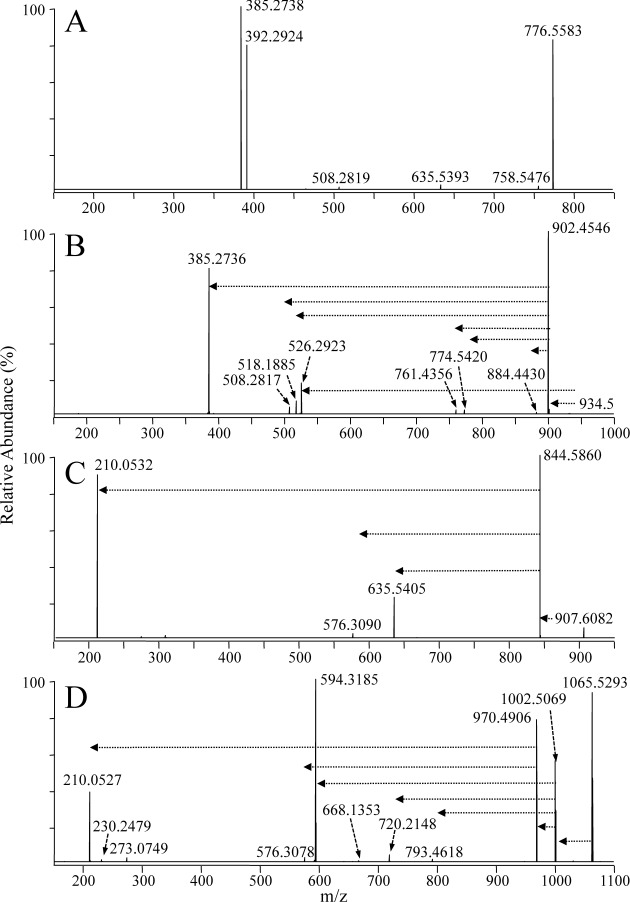
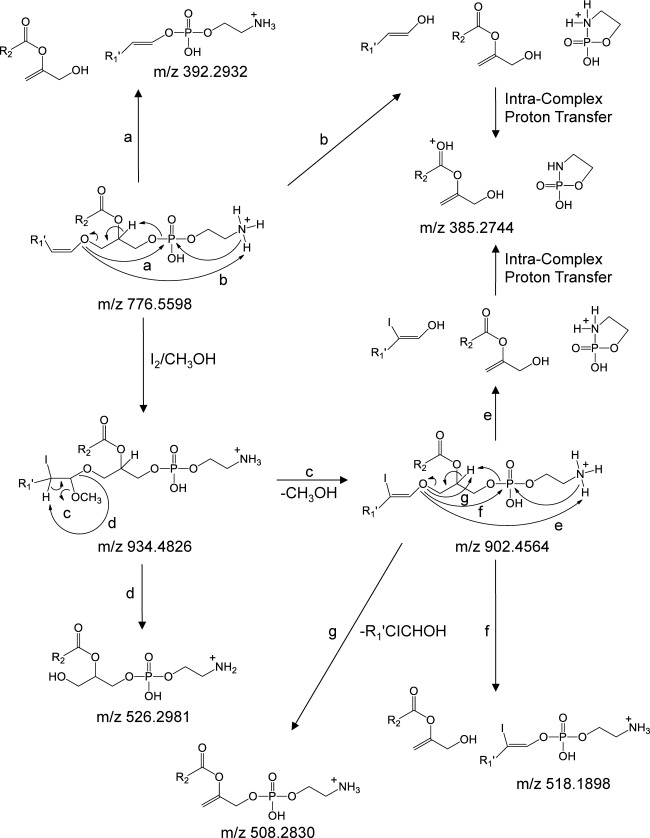
A comparison of the HCD-MS/MS spectra acquired from the protonated, iodine/CH3OH derivatized, 13C1-DMBNHS derivatized, and sequentially 13C1-DMBNHS and iodine/CH3OH derivatized plasmenyl ether PE(P-18 : 0/22 : 6) lipid precursor ions, are shown in Figs. 4A–D, respectively. The abundant product ions at m/z 385.2738 and m/z 392.2924 observed upon dissociation of the underivatized protonated plasmenyl PE lipid from Fig. 1A (Fig. 4A), corresponding to loss of the 2-sn acyl and 1-sn alkenyl chains, respectively, directly enable assignment of the molecular lipid identity. These products are consistent with those previously reported by Zemski Berry and Murphy, who also provided a sound mechanistic rationale for their formation28) (Scheme 2, pathways a and b).
Fig. 4. Positive ionization mode ESI high-resolution HCD-MS/MS analysis of the synthetic lipid standard PE(P-18 : 0/22 : 6) (A) without derivatization, (B) after reaction with iodine and methanol, (C) after derivatization with 13C1-DMBNHS, and (D) after derivatization with 13C1-DMBNHS followed by reaction with iodine and methanol. The horizontal arrows in panels B–D indicate the fragmentation pathways that were observed upon performing ion trap multistage CID-MSn of the derivatized PE precursor ions.
Scheme 2. Proposed CID-MS/MS fragmentation mechanisms for the plasmenyl ether containing PE(P-18 : 0/22 : 6) lipid, prior to and following reaction with iodine and methanol. The m/z values shown correspond to the calculated masses of the various product ions.
In contrast, the primary fragmentation pathway for the iodine/CH3OH derivatized plasmenyl ether PE(P-18 : 0/22 : 6) lipid from Fig. 1B (Fig. 4B) corresponded to the loss of methanol (m/z 902.4546) (Scheme 2, pathway c). A lower abundance product ion formed via the neutral loss of the characteristic R1′CICHOCH3 alkene (m/z 526.2923) (Scheme 2, pathway d) was also observed, analogous to that proposed in Scheme 1, pathway c for the iodine/CH3OH derivatized plasmenyl PC lipid, from which the molecular lipid identity could be directly assigned (i.e., PE(P-18 : 0/22 : 6) rather than PE(O-18 : 1/22 : 6)). Further dissociation of the m/z 902.4546 product ion during HCD-MS/MS (or by CID-MS3) resulted in the formation of product ions similar to those observed for the underivatized PE lipid (e.g., compare Scheme 2, pathways e and f for the formation of m/z 385.2736 and m/z 518.1885, with Scheme 2, pathways b and a, respectively). Several other minor products were also observed, including m/z 508.2817, formed via the pathway proposed in Scheme 2 pathway g, as well as m/z 884.4430, m/z 774.5420 and m/z 761.4356 formed via the losses of H2O, HI and the phosphoethanolamine head group, respectively.
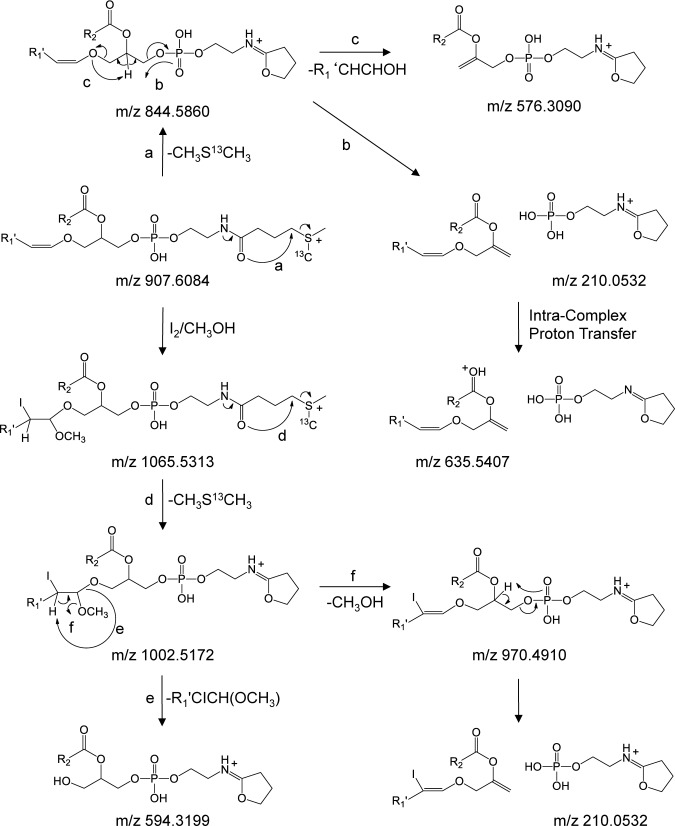
Derivatization of the plasmenyl PE lipid with the 13C1-DMBNHS reagent, resulting in the introduction of a ‘fixed charge’ sulfonium ion, significantly altered the gas-phase fragmentation behavior (Fig. 4C). Here, the dominant initial product ion at m/z 844.5860 was formed via the neutral loss of 63.0024 Da (i.e., 13C1-dimethylsulfide), resulting in a 5 membered protonated iminohydrofuran ring on the headgroup (Scheme 3, pathway a). This was followed by further dissociation similar to that seen for the plasmenyl PC lipid in Fig. 3A, yielding a dominant product ion corresponding to the derivatized phosphoethanolamine headgroup at m/z 210.0532, its complementary 209 Da neutral loss product at m/z 635.5407 formed via intra-complex proton transfer (Scheme 3, pathway b), as well as a low abundance product ion at m/z 576.3090 formed via characteristic loss of the plasmenyl chain as a neutral alkenyl alcohol (Scheme 3, pathway c) from which direct assignment of the molecular lipid identity (i.e., PE(P-18 : 0/22 : 6) rather than PE(O-18 : 1/22 : 6)) could be achieved, albeit with poor detection sensitivity.
Scheme 3. Proposed CID-MS/MS fragmentation mechanisms for the 13C1-DMBNHS derivatized plasmenyl ether containing PE(P-18 : 0/22 : 6) lipid, prior to and following reaction with iodine and methanol. The m/z values shown correspond to the calculated masses of the various product ions.
Finally, the spectrum acquired upon HCD-MS/MS of the sequentially 13C1-DMBNHS and iodine/CH3OH derivatized plasmenyl ether PE(P-18 : 0/22 : 6) lipid is shown in Fig. 4D. Similar to the plasmenyl PE lipid derivatized only with 13C1-DBMNHS, the dominant neutral loss of 13C1-dimethylsulfide (m/z 1002.5069) was observed as the primary fragmentation pathway (Scheme 3, pathway d). Then, further dissociation of this initial product ion was found to be essentially identical to that observed from the iodine/CH3OH derivatized plasmenyl PC lipid in Fig. 3B, with the major product ion formed via neutral loss of the characteristic R1′CICHOCH3 alkene (m/z 594.3185), that directly enabled assignment of the molecular lipid identity (i.e., PC(P-18 : 0/22 : 6) rather than PC(O-18 : 1/22 : 6)) (Scheme 3, pathway e), as well as an abundant product ion corresponding to the loss of methanol (m/z 970.4906) that also underwent further dissociation to yield the abundant derivatized PE headgroup specific ion at m/z 210.0527 (Scheme 3, pathway f) and its low abundance complementary 209 Da neutral loss product at m/z 793.4618. Interestingly, the minor product ion at m/z 720.2148, corresponding to loss of the 1-sn alkenyl chain as a neutral R′CHCHOCH3 alkene via a pathway the same as that proposed in Scheme 1, pathway e for the iodine/CH3OH derivatized plasmenyl PC lipid, was not observed for the plasmenyl PE lipid that had only been derivatized with iodine/CH3OH (i.e., no 13C1-DMBNHS), suggesting that this reaction pathway is only energetically competitive under ‘non-mobile’ protonation conditions.
CONCLUSION
The results shown herein indicate that sequential functional group specific lipid derivatization reactions can be successfully developed and applied to fully resolve, identify the presence of, and characterize the molecular lipid compositions of plasmenyl ether containing lipid species from within crude complex lipid extracts based on the characteristic mass shifts observed upon ‘shotgun’ high resolution/accurate mass spectrometry, and/or the characteristic product ions formed upon tandem mass spectrometry analysis of their mass selected precursor ions. The reactions are simple, fast, and proceed to completion without non-specific modification of other lipids that may be present within a given mixture. Coupled with its ability to significantly reduce or eliminate the need for chromatographic fractionation or additional lipid extraction steps prior to analysis, this approach represents an attractive strategy for use in future studies aimed at developing an improved understanding of the structures and functions of plasmenyl and plasmanyl ether lipids in health and disease.
Acknowledgments
Support for this work was provided by funding from the National Institutes of Health to GER (GM103508).
References
- 1) R. C. Murphy. Free-radical-induced oxidation of arachidonoyl plasmalogen phospholipids: Antioxidant mechanism and precursor pathway for bioactive eicosanoids. Chem. Res. Toxicol. 14: 463–472, 2001 [DOI] [PubMed] [Google Scholar]
- 2) P. V. Escribá, J. M. González-Ros, F. M. Goñi, P. K. Kinnunen, L. Vigh, L. Sánchez-Magraner, A. M. Fernández, X. Busquets, I. Horváth, G. Barceló-Coblijn. Membranes: A meeting point for lipids, proteins and therapies. J. Cell. Mol. Med. 12: 829–875, 2008 [DOI] [PMC free article] [PubMed] [Google Scholar]
- 3) G. van Meer, D. R. Voelker, G. W. Feigenson. Membrane lipids: Where they are and how they behave. Nat. Rev. Mol. Cell Biol. 9: 112–124, 2008 [DOI] [PMC free article] [PubMed] [Google Scholar]
- 4) P. E. Glaser, R. W. Gross. Plasmenylethanolamine facilitates rapid membrane fusion: A stopped-flow kinetic investigation correlating the propensity of a major plasma membrane constituent to adopt an HII phase with its ability to promote membrane fusion. Biochemistry 33: 5805–5812, 1994 [DOI] [PubMed] [Google Scholar]
- 5) T. P. Thai, C. Rodemer, A. Jauch, A. Hunziker, A. Moser, K. Gorgas, W. W. Just. Impaired membrane traffic in defective ether lipid biosynthesis. Hum. Mol. Genet. 10: 127–136, 2001 [DOI] [PubMed] [Google Scholar]
- 6) N. E. Braverman, A. B. Moser. Functions of plasmalogen lipids in health and disease. Biochim. Biophys. Acta1822: 1442–1452, 2012 [DOI] [PubMed] [Google Scholar]
- 7) T. F. da Silva, V. F. Sousa, A. R. Malheiro, P. Brites. The importance of ether-phospholipids: A view from the perspective of mouse models. Biochim. Biophys. Acta1822: 1501–1508, 2012 [DOI] [PubMed] [Google Scholar]
- 8) R. E. Smith, P. Lespi, M. Di Luca, C. Bustos, F. A. Marra, M. J. T. de Alaniz, C. A. Marra. A reliable biomarker derived from plasmalogens to evaluate malignancy and metastatic capacity of human cancers. Lipids 43: 79–89, 2008 [DOI] [PubMed] [Google Scholar]
- 9) T. E. Merchant, J. N. Kasimos, P. W. de Graaf, B. D. Minsky, L. W. Gierke, T. Glonek. Phospholipid profiles of human colon cancer using 31P magnetic resonance spectroscopy. Int. J. Colorectal Dis. 6: 121–126, 1991 [DOI] [PubMed] [Google Scholar]
- 10) D. A. Dueck, M. Chan, K. Tran, J. T. Wong, F. T. Jay, C. Littman, R. Stimpson, P. C. Choy. The modulation of choline phosphoglyceride metabolism in human colon cancer. Mol. Cell. Biochem. 162: 97–103, 1996 [DOI] [PubMed] [Google Scholar]
- 11) C. J. Fhaner, S. Liu, H. Ji, R. J. Simpson, G. E. Reid. Comprehensive lipidome profiling of isogenic primary and metastatic colon adenocarcinoma cell lines. Anal. Chem.84: 8917–8926, 2012 [DOI] [PMC free article] [PubMed] [Google Scholar]
- 12) X. Han, K. Yang, R. W. Gross. Multi-dimensional mass spectrometry-based shotgun lipidomics and novel strategies for lipidomic analyses. Mass Spectrom. Rev. 31: 134–178, 2012 [DOI] [PMC free article] [PubMed] [Google Scholar]
- 13) C. S. Ejsing, J. L. Sampaio, V. Surendranath, E. Duchoslav, K. Ekroos, R. W. Klemm, K. Simons, A. Shevchenko. Global analysis of the yeast lipidome by quantitative shotgun mass spectrometry. Proc. Natl. Acad. Sci. U.S.A. 106: 2136–2141, 2009 [DOI] [PMC free article] [PubMed] [Google Scholar]
- 14) D. Schwudke, K. Schuhmann, R. Herzog, S. R. Bornstein, A. Shevchenko. Shotgun lipidomics on high resolution mass spectrometers. Cold Spring Harb. Perspect. Biol. 3: a004614, 2011 [DOI] [PMC free article] [PubMed] [Google Scholar]
- 15) F. F. Hsu, J. Turk. Differentiation of 1-O-alk-1′-enyl-2-acyl and 1-O-alkyl-2-acyl glycerophospholipids by multiple-stage linear ion-trap mass spectrometry with electrospray ionization. J. Am. Soc. Mass Spectrom. 18: 2065–2073, 2007 [DOI] [PMC free article] [PubMed] [Google Scholar]
- 16) J. M. Deeley, M. C. Thomas, R. J. W. Truscott, T. W. Mitchell, S. J. Blanksby. Identification of abundant alkyl ether glycerophospholipids in the human lens by tandem mass spectrometry techniques. Anal. Chem. 81: 1920–1930, 2009 [DOI] [PubMed] [Google Scholar]
- 17) R. M. C. Dawson. A hydrolytic procedure for the identification and estimation of individual phospholipids in biological samples. Biochem. J. 75: 45–53, 1960 [DOI] [PMC free article] [PubMed] [Google Scholar]
- 18) E. J. Murphy, R. Stephens, M. Jurkowitz-Alexander, L. A. Horrocks. Acidic hydrolysis of plasmalogens followed by high-performance liquid chromatography. Lipids 28: 565–568, 1993 [DOI] [PubMed] [Google Scholar]
- 19) K. Ekroos. Lipidomics perspective: From molecular lipidomics to validated clinical diagnostics. In Lipidomics, Technologies and Applications. Wiley-VCH, Weinheim, Germany, 2012, Chapter 1.
- 20) S. Siggia, R. L. Edsberg. Iodometric determination of vinyl alkyl ethers. Anal. Chem. 20: 762–763, 1948 [Google Scholar]
- 21) M. M. Rapport, B. Lerner. The structure of plasmalogens. Biochim. Biophys. Acta 33: 319–325, 1959 [DOI] [PubMed] [Google Scholar]
- 22) W. T. Norton. Potentiometric iodometric determination of plasmalogen. Biochim. Biophys. Acta 38: 340–342, 1960 [DOI] [PubMed] [Google Scholar]
- 23) X. Zhou, Y. Lu, W. Wang, B. Borhan, G. E. Reid. ‘Fixed charge’ chemical derivatization and data dependant multistage tandem mass spectrometry for mapping protein surface residue accessibility. J. Am. Soc. Mass Spectrom. 21: 1339–1351, 2010 [DOI] [PubMed] [Google Scholar]
- 24) J. Folch, M. Lees, G. H. Sloane Stanley. A simple method for the isolation and purification of total lipides from animal tissues. J. Biol. Chem. 226: 497–509, 1957 [PubMed] [Google Scholar]
- 25) T. A. Lydic, J. V. Busik, W. J. Esselman, G. E. Reid. Complementary precursor ion and neutral loss scan mode tandem mass spectrometry for the analysis of glycerophosphatidylethanolamine lipids from whole rat retina. Anal. Bioanal. Chem. 394: 267–275, 2009 [DOI] [PMC free article] [PubMed] [Google Scholar]
- 26) P. Haimi, A. Uphoff, M. Hermansson, P. Somerharju. Software tools for analysis of mass spectrometric lipidome data. Anal. Chem. 78: 8324–8331, 2006 [DOI] [PubMed] [Google Scholar]
- 27) S. P. Hui, H. Chiba, T. Kurosawa. Liquid chromatography-mass spectrometric determination of plasmalogens in human plasma. Anal. Bioanal. Chem. 400: 1923–1931, 2011 [DOI] [PubMed] [Google Scholar]
- 28) K. A. Zemski Berry, R. C. Murphy. Electrospray ionization tandem mass spectrometry of glycerophosphoethanolamine plasmalogen phospholipids. J. Am. Soc. Mass Spectrom. 15: 1499–1508, 2004 [DOI] [PubMed] [Google Scholar]


