Abstract
Purpose
The impact of diagnostic genito-urinary imaging (GUI) on patients and families is poorly understood. We study sought to measure patient and family reaction to commonly performed GUI studies, using a standardized measurement tool.
Methods
We surveyed families undergoing GUI (renal ultrasound (RUS), voiding cystourethrography (VCUG), radionuclide cystogram (RNC), static renal scintigraphy (DMSA), and diuretic renal scintigraphy (MAG3)), using a Likert-scaled 11-item survey to assess impact across four domains (pain, anxiety, time, satisfaction). Survey scores were analyzed using ANOVA and linear regression.
Results
263 families were surveyed (61 RUS, 52 VCUG, 55 RNC, 47 MAG3, 48 DMSA). Mean age was 2.1 years. 45% were male. 77% were white. Patient age, gender, and prior GUI experience varied by study type. Study type was significantly associated with both total and weighted scores on the GUI survey (both p<0.0001). RUS was better and MAG3 was worse than VCUG, RNC, and DMSA, which did not differ from each other. Other factors associated with worse total scores included patient age 1–3 years (p<0.001) and non-white race (p=0.04). Gender, prior testing history, wait time, and parent education were not associated with total scores. In the multivariate model, RUS remained the best and MAG3 the worst (p<0.0001). Compared directly, DMSA and VCUG total scores did not differ (p=0.59).
Conclusion
There are significant differences among GUI studies regarding the patient/family experience, but there was no overall difference between DMSA and VCUG. These findings may be useful to aid decision-making when considering GUI for children.
Keywords: imaging studies, genitourinary, satisfaction survey, pediatrics
Introduction
Evaluation and management of many pediatric urological conditions involves use of diagnostic imaging. Patients with both congenital and acquired conditions commonly require imaging studies, and a wide range of functional and anatomic tests are available to the pediatric urologist. However, the impact of diagnostic genito-urinary imaging (GUI) studies on patients and families with respect to discomfort, bother, anxiety, time commitment, and other factors is poorly understood. Decisions about testing may be influenced in part by physician perceptions about the relative discomfort, bother, or invasiveness of various tests, but these perceptions are based on few reliable data and are largely anecdotal. This study sought to measure the relative effects of several commonly performed diagnostic GUI tests on patients and families using a standardized impact measurement tool, with the hypothesis that there will be significant differences among GUI tests.
Methods
Patient Sample
With approval of the IRB, we surveyed families of patients age 6 years and younger who were undergoing GUI studies at our institution for 1 year. The assessed tests were renal ultrasound (RUS), voiding cystourethrography (VCUG), radionuclide cystogram (RNC), static renal scintigraphy (DMSA), and diuretic renal scintigraphy (MAG-3). None of the tests were performed with sedation. Eligible families were approached prior to the GUI test and asked to participate. Surveys were conducted at the conclusion of the imaging test in question (same day), and were limited to patients undergoing only that test on that day. Parents completed the survey privately on paper and returned the form to the research assistant when completed. All surveys were de-identified. Exclusion criteria include age > 6 years, unwillingness to consent, non-English speaking family, or undergoing multiple GUI tests on the same day.
Survey Instrument
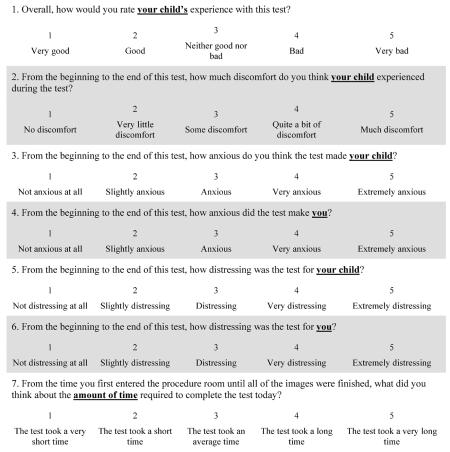
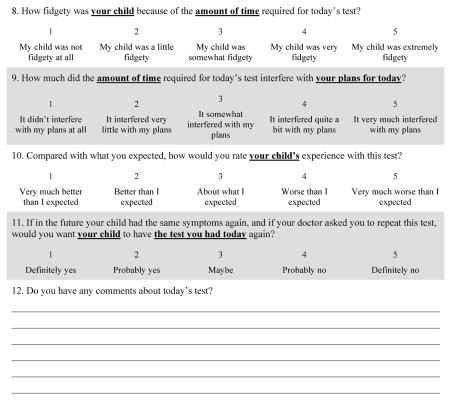
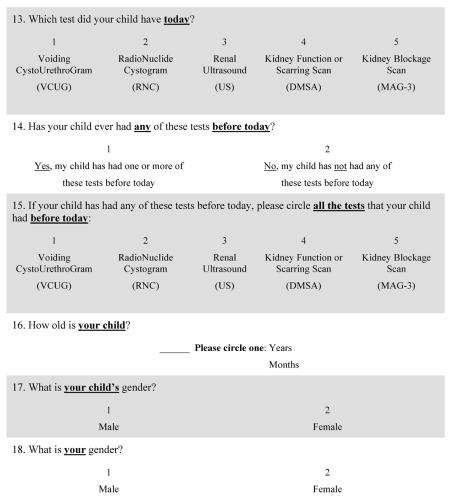
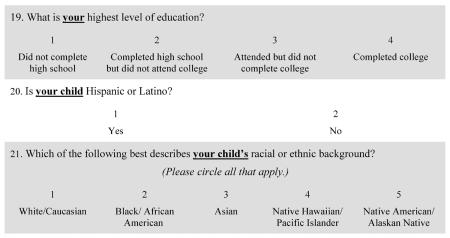
As no brief, validated instrument currently exists to assess the all of the specific domains we wished to address for pediatric GUI tests, we developed a survey instrument to assess reaction to, and satisfaction with, the GUI test among families of patients undergoing these studies (Appendix A). Parents reported their own reactions and, via parental report, the reactions of their child to the GUI test. The instrument was developed in collaboration with a survey methodologist (SZ) and assessed for readability and clarity. The face and content validity of the initial instrument were assessed by expert review by radiology and urology faculty. After revision, the final instrument contained 11 five-point Likert-scale items covering 4 domains (pain/discomfort (1 item), psychological impact (4 items), time/work disruption (3 items), and overall test satisfaction (3 items)). Survey responses were transformed into numeric scales, with lower numeric scores reflecting a more favorable responses. We calculated a raw total score (raw sum of scores of each item, range: 11–55); surveys with incomplete or missing individual item responses were excluded from the total score calculation. We also calculated a domain-weighted total score to adjust for the varying number of items in each domain; the item scores for each domain were summed and then divided by the number of items in that domain to provide an individual domain mean, and the weighted total score was the sum of these individual domain means (range: 4–20).
We collected demographic data, history of prior GUI testing (both history of same test and history of any GUI test), and wait times (arrival to study start, and study start to study end).
Statistical Methods
Bivariate associations between predictor variables and the domain-specific, raw total, and domain-weighted total scores were assessed. ANOVA tests and t-tests were used for predictor variables with greater > 2 categories and 2 categories, respectively. When appropriate, post hoc comparisons were performed using Duncan's test.
We developed multivariable linear regression models to assess the relationships between GUI test and domain-specific scores, raw total scores, and domain-weighted total scores while adjusting for other significant predictors of scores. We chose a priori to include predictor variables with a p-value of < 0.15 on bivariate analysis. The multivariable model was then modified using a sequential “backwards” technique, stopping when all covariates had p<0.1. The final model was determined by the combination of covariates with p<0.1 producing the highest r-squared value. Model diagnostics revealed no significant violations of regression assumptions. All analyses were performed using SAS 9.2 (SAS Institute Inc, Cary, NC). All tests were 2-sided with significance defined as a p-value of less than or equal to 0.05.
Results
We surveyed 263 families, of whom 248 (94%) completed all survey responses. Data were collected on 61 RUS, 52 VCUG, 55 RNC, 47 MAG-3, and 48 DMSA studies. Characteristics of the sample are shown in Table 1. Mean age was 2.1 years; 37% were < 1 yr, 42% were 1–3 yrs, and 22% were >3 yrs. 45% were male. 77% were non-Latino white; among the other 23%, 7% were Latino, 6% were Asian, 2% were non-Latino black, and 8% were “other”). Patient age (p<0.0001), gender (p<0.0001), history of any prior GUI studies (p<0.0001), and history of same prior GUI study (p<0.0001) varied significantly by study type. Wait time (p=0.2632), parent education level (p=0.2057), and patient race/ethnicity (white vs. non-white, p=0.2353) did not vary significantly by study type.
Table 1.
Characteristics of the study sample
| Overall | RUS | VCUG | RNC | DMSA | Mag3 | P-value | |
|---|---|---|---|---|---|---|---|
| Sample size | 263 | 61 | 52 | 55 | 48 | 47 | -- |
| Age category (n, %) | |||||||
| <1 | 94 (37) | 24 (41) | 32 (63) | 6 (11) | 12 (25) | 20 (45) | <0.0001 |
| 1–3 | 106 (42) | 18 (31) | 14 (27) | 28 (52) | 28 (58) | 18 (41) | |
| >3 | 55 (22) | 16 (28) | 5 (10) | 20 (37) | 8 (17) | 6(14) | |
| Gender (n, %) | |||||||
| Male | 116 (45) | 29 (49) | 26 (51) | 13 (24) | 13 (27) | 35 (76) | <0.0001 |
| Female | 143 (55) | 30 (51) | 25 (49) | 42 (76) | 35 (73) | 11 (24) | |
| Parental education level (n, %) | |||||||
| Some HS | 6 (2) | 1 (2) | 3(7) | 1 (2) | 1 (2) | 0 (0) | 0.2057 |
| HS grad | 30 (12) | 6 (10) | 5 (11) | 5(9) | 4 (9) | 10 (24) | |
| Some college | 31 (13) | 8 (14) | 8 (17) | 3 (6) | 6 (13) | 6 (15) | |
| College grad | 179 (73) | 44 (75) | 30 (65) | 45 (83) | 35 (76) | 25 (61) | |
| Race/ethnicity (n, %) | 0.2353 | ||||||
| White | 193 (77) | 42 (74) | 33 (67) | 46 (85) | 39 (81) | 33 (79) | |
| Non-White* | 57 (23) | 15 (26) | 16 (33) | 8 (15) | 9 (19) | 9 (21) | |
| Wait time (minutes from arrival to study start) (n, %) | 0.2632 | ||||||
| <15 minutes | 79 (40) | 9 (36) | 19 (43) | 20 (50) | 12 (26) | 19 (43) | |
| 15–30 minutes | 58 (29) | 10 (40) | 10 (23) | 11 (27.5) | 18 (39) | 9 (20) | |
| >30 minutes | 62 (31) | 6 (24) | 15 (34) | 9 (22.5) | 16 (35) | 16 (36) | |
| Test time (minutes from study start to study end) | <0.0001 | ||||||
| (mean +/− SD) | 90 +/− 88 | 25 +/− 15 | 43 +/− 15 | 34 +/− 12 | 247 +/− 38 | 117 +/− 50 | |
| Any prior testing (n, %) | |||||||
| Any prior | 187 (72) | 42 (70) | 24 (47) | 42 (76) | 38 (79) | 41 (89) | <0.0001 |
| No prior | 73 (28) | 18 (30) | 27 (53) | 13 (24) | 10 (21) | 5 (11) | |
| Same test previously (n, %) | |||||||
| Yes | 93 (36) | 38 (67) | 9 (18) | 24 (44) | 7 (15) | 15 (33) | <0.0001 |
| no | 163 (64) | 19 (33) | 42 (82) | 31 (56) | 40 (85) | 31 (67) |
includes white Latinos, black Latinos, black non-Latinos, Asians, and “other”.
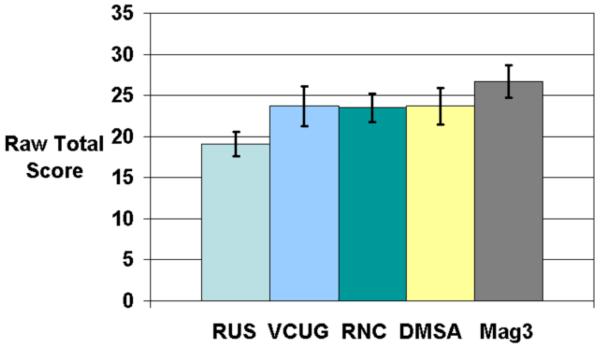
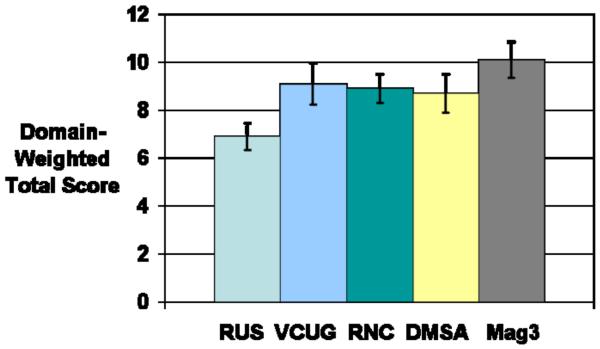
Survey scores are depicted in Table 2. The mean raw total score was 23.2 +/− 7.3 (range: 11–53). The mean domain-weighted total score was 8.6 +/− 2.7 (range: 4.0–19.3). On bivariate analysis, study type was significantly associated with raw and domain-weighted total scores (both p<0.0001)(Figure 1). Post-hoc testing showed that for both raw total and domain-weighted total, RUS was significantly better and MAG-3 was significantly worse than VCUG, RNC, and DMSA, which did not differ from each other.
Table 2.
Mean Survey Scores [95% CI] for total scores and domain scores, stratified by GUI test and other patient/family characteristics
| RUS | VCUG | RNC | DMSA | Mag3 | P-value | |
|---|---|---|---|---|---|---|
| Raw Total Score | 19.1 [17.6–20.6] | 23.7 [21.3–26.1] | 23.5 [21.7–25.2] | 23.7 [21.5–25.9] | 26.7 [24.7–28.8] | <0.0001 |
| Domain-weighted Total Score | 6.9 [6-3-7.4] | 9.1 [8.2–9.9] | 8.9 [8.3–9.5] | 8.7 [7.9–9.5 | 10.1 [9.3–10.8] | <0.0001 |
| Overall Test Satisfaction Domain | 5.7 [5.4–6.1] | 5.6 [4.9–6.3] | 5.7 [5.1–6.3] | 5.6 [4.8–6.4] | 6.7 [6.0–7.4] | 0.0621 |
| Pain Domain | 1.6 [1.4–1.8] | 2.9 [2.6–3.2] | 2.9 [2.7–3.1] | 2.2 [1.9–2.5] | 3.0 [2.7–3.2] | <0.0001 |
| Psychological Domain | 6.2 [5.5–7.0] | 9.2 [8.1–10.3] | 9.5 [8.6–10.3] | 8.4 [7.5–9.4] | 10.1 [9.2–11.0] | <0.0001 |
| Time Domain | 5.8 [5.3–6.3] | 6.1 [5.4–6.7] | 5.4 [4.9–6.0] | 7.3 [6.7–7.9] | 6.9 [6.3–7.5] | <0.0001 |
Figure 1a and Figure 1b.
Relative raw and domain-weighted total scores for each of the five GUI tests. Error bars represent 95% confidence intervals. Range of possible scores for raw total is 11–55. Range of possible scores for domain-weighted total is 4–20.
Age and race were associated with raw total and domain-weighted total scores included. Infants (age <1) and school-age children (age >3) did better than toddlers (age 1–3) (p<0.001). Scores were also better for patients of white, non-Latino race/ethnicity (p=0.04). Gender (p=0.5792), prior history of any GUI test (p=0.2212), prior history of the same GUI test (p=0.2983), procedure wait time (p=0.5852), and parental education level (p=0.9148) were not associated with raw total or domain-weighted total scores (data not shown).
We constructed multivariate models to compare scores of the various GUI tests while controlling for other associated factors (Table 3). After adjusting for other significant or trend-associated variables, GUI study type remained significantly associated with raw and domain-weighted total score (p<0.0001), primarily due to the low (good) scores for RUS and relatively high (bad) scores for MAG-3. DMSA, VCUG, and RNC scores did not differ significantly for raw total, domain-weighted total, or overall test satisfaction domain (Table 3).
Table 3.
Multivariate analysis of association of study type with survey scores for raw total score, domain-weighted total score, and individual domain scores. Lower scores reflect more favorable responses. Parameter estimates reflect the mean increase (or decrease if estimate is negative) in score for variable category, compared to the reference category, adjusting or other variables.
| Raw Total Score | Domain-Weighted Total Score | Summary Domain | Pain Domain | Psychological Domain | Time Domain | |||||||
|---|---|---|---|---|---|---|---|---|---|---|---|---|
| Parameter Estimate | p-value | Parameter Estimate | p-value | Parameter Estimate | p-value | Parameter Estimate | p-value | Parameter Estimate | p-value | Parameter Estimate | p-value | |
| Study Type | ||||||||||||
| RUS (vs. VCUG) | −4.9 | 0.0002 | −2.3 | <0.0001 | 0.05 | 0.9018 | −1.3 | <0.0001 | −3.1 | <0.0001 | −0.3 | 0.4944 |
| RNC (vs. VCUG) | −0.75 | 0.5970 | −0.16 | 0.7597 | 0.02 | 0.9623 | 0.01 | 0.9561 | −0.2 | 0.7265 | −0.5 | 0.2540 |
| Mag-3 (vs. VCUG) | 2.9 | 0.0377 | 1.1 | 0.0407 | 1.2 | 0.0163 | 0.1 | 0.4404 | 1.2 | 0.0695 | 1.0 | 0.0280 |
| DMSA (vs. VCUG) | −0.76 | 0.5890 | −0.50 | 0.3403 | −0.1 | 0.8272 | −0.7 | 0.0002 | −1.3 | 0.0465 | 1.3 | 0.0034 |
| Age | ||||||||||||
| < 1 yr (vs. 1–3 yrs) | −3.3 | 0.0011 | −1.0 | 0.0079 | −0.9 | 0.0140 | −0.2 | 0.0970 | −1.4 | 0.0033 | −0.4 | 0.1706 |
| > 3 yrs (vs. 1–3 yrs) | −3.1 | 0.0078 | −1.0 | 0.0196 | −0.7 | 0.0810 | −0.4 | 0.0049 | −1.3 | 0.0182 | −0.5 | 0.1270 |
| Race/ethnicity | ||||||||||||
| White (vs. non-white) | -- | -- | −0.8 | 0.0514 | −0.7 | 0.0545 | -- | -- | -- | -- | −0.6 | 0.0697 |
| Gender | ||||||||||||
| Male (vs. female) | -- | -- | -- | -- | -- | -- | -- | -- | −1.0 | 0.0200 | -- | -- |
Specifically comparing the findings for VCUG with those of DMSA in the multivariable model, we found that DMSA had similar raw total and domain-weighted total scores compared to VCUG. Overall test satisfaction scores also did not differ between VCUG and DMSA (p=0.8272). There were significant differences noted in the pain domain, with VCUG scores worse than DMSA (p=0.0002), as well as in the psychological domain (again with VCUG scores (slightly) worse than DMSA (p=0.0465). In the time burden domain, however, DMSA scored significantly worse than VCUG (p=0.0034).
In terms of their subjective experience with the test, a strong majority of families had positive reactions to the GUI testing process. 80% of all families (207/258) rated their overall experience as “good” or “very good”, ranging from 68% (32/47) for MAG-3 to 90% (55/61) for RUS. 76% of families (39/51) gave this rating for VCUG, 79% (41/52) for RNC, and 85% (40/47) for DMSA (p=0.05). Conversely, only 5/258 families (2%) rated the GUI test experience “very bad”: 1 VCUG, 1 MAG-3, and 3 DMSA (p=0.1292).
Discussion
The primary consideration when ordering any diagnostic test should be how the information provided by that test will influence subsequent management. The physician always makes a judgment (whether explicit or implicit) that the benefit to be gained by the information from the test outweighs any potential downsides (either adverse effects of the test itself or, in some cases, of obtaining information of uncertain value or clinical significance). In many cases, such downsides can be quantified, e.g. radiation exposure, or risk of vascular or infectious complications. However, there are other considerations when it comes to GUI testing in young children that families may consider extremely important, but that we as clinicians have little ability to measure. These include pain and discomfort, anxiety and psychological distress associated with the test, and the time required for the test to be completed. Clinicians may believe that they understand what children and families experience during common GUI tests, but these impressions are not usually based on rigorous measurement and can be easily skewed by individual examples of outliers, both good and bad.
In this study we sought to compare the experiences of families undergoing a range of GUI tests using a standardized, parent-reported survey instrument. We found that, as expected, renal and bladder ultrasound is well-tolerated and minimally burdensome to families and patients. Families consistently found the MAG-3 test (which involves both urethral catheterization (in almost all cases) and intravenous injection) to be the least well-tolerated test.
Perhaps the most provocative finding was that DMSA and VCUG were equivalent in scores, both with respect to total score and in terms of overall test satisfaction. Although VCUG scored worse than DMSA in the pain and psychological domains, DMSA scored significantly worse than VCUG in the time domain. Given the equivalent total and overall satisfaction scores, these domain-specific differences appeared to balance out.
Recently it has been proposed that a “top-down” approach for evaluation of children with a history of febrile UTI, using DMSA renal scan, may be preferable to the traditional “bottom-up” approach using VCUG.1 An important element of the “top-down” argument is that the VCUG is poorly tolerated; implied (but rarely stated or supported by data) is the supposition that DMSA is better tolerated. As one advocate stated, in the “top-down” paradigm the “DMSA renal scan can be used to replace VCUG… which is important given the drawbacks of [VCUG]”.2 Some data do suggest that VCUG is a anxiety-generating test for patients3–6, but the degree to which this occurs is poorly quantified. The current findings suggest that, at least at our institution, VCUG and DMSA are relatively equivalent in terms of family and patient experience. Clearly, there are other arguments for the top-down approach beyond the perceived morbidity of the VCUG (avoidance of diagnosing clinically insignificant VUR, and identification of patients with renal involvement), and the current findings do not significantly alter the balance of data in that debate. However, our findings contradict the assumption that DMSA is better tolerated than VCUG.
Other than the GUI test itself, we noted several other variables that were consistently associated with survey scores on the tests. Most highly associated was patient age, with infants (<1 year) and older children (>3 years) doing better than toddlers (1–3 years) across all domains. This is unsurprising given that it is these young children who are old enough to “put up a fight” but not old enough to reason with or really explain the nature or purpose of the test. Unfortunately, this was also the most numerous age group in our sample, comprising 42% of all patients.
We also saw a significant variation in scores by race. Total scores were consistently higher (worse) for non-whites compared to whites. Scores were also worse for the nonwhite group in each of the domains, although the significance of these differences varied. Such findings are always concerning, but are not surprising. Many studies have documented lower satisfaction with medical care among minority patients and families7–9, although the phenomenon is poorly understood. Language barriers may play a role in some cases9, although our study was limited to English–speaking families.
The results of this study should be interpreted in light of its limitations. The survey results reflect family impressions at the time of the GUI test; attitudes and satisfaction may conceivably change over time. The study was conducted at a single tertiary-care pediatric institution and therefore caution should be used in generalizing these findings to other settings. In particular, there may be unique features of our patient population, facility, or imaging program that may make these findings specific to this site. Future research efforts should seek to evaluate these GUI tests across a multi-center cohort. In addition, at our hospital, a Certified Child Life Specialist is available for GUI tests to facilitate the procedure and make the child and family as comfortable as possible. These professionals use a variety of techniques including distraction, music and song, video, and other approaches to minimize anxiety and pain. It has been shown that psychological preparation can improve coping and reduce distress during invasive medical procedures in unsedated children, including VCUG and DMSA6,10,11. However, not every institution has the resources to provide these services and in such cases, the experiences of families with GUI tests may be different. We attempted to collect data to assess the impact of Child Life presence during testing. Unfortunately, due to the structure of our survey and the requirement to keep the survey anonymous and family-reported, we were only able to assess Child Life presence in 52% of GUI tests (136/263). Among this subset, Child Life was present in 21%, and did not differ significantly among GUI tests (10% RUS, 16% MAG3, 20% VCUG, 29% RNC, 32% DMSA, p=0.28). Neither total nor domain-specific scores varied significantly by Child Life presence. However, given the large proportion of missing data, we did not feel that we could include this covariate in our analysis of GUI test impact. Future uses of this survey instrument should specifically seek to assess the effect of Child Life during GUI testing.
The survey instrument used was created specifically for this study. There is no validated instrument designed to evaluate patient satisfaction with pediatric GUI tests. We therefore used accepted survey design techniques under the guidance of a professional survey methodologist. The individual items were structured based on standard items used in numerous validated surveys, and the Likert-scale responses use typical terminology and grading. Face and content validity were assessed by the clinical faculty in urology and radiology. Nonetheless, we have not performed additional validation tests.
The study design relied on parent recall of specific testing details that may be inaccurate, particularly parent recollection of prior testing history. In our experience many families confuse the various GUI tests and are often uncertain of the test they are having that day, not to mention tests that may have happen in the past. In order to maintain the anonymity of survey respondents, we sacrificed the ability to review prior records to confirm parental report of prior testing, making recall bias is a potential issue. This is likely more significant with respect to the history of prior same GUI test, as compared to history of any prior GUI test, due to the more specific recall required.
Conclusion
There are significant differences among GUI studies with respect to patient/family experience, with RUS tolerated best and MAG-3 worst. There is no overall difference between VCUG and DMSA. These findings may be useful to aid decision-making when considering GU imaging tests for pediatric patients.
Acknowledgments
Funding: Dr. Nelson is supported by grant number K23-DK088943 from NIDDK.
Key of Definitions for Abbreviations
- (GUI)
Genitourinary imaging
- (DMSA)
Dimercaptosuccinic acid static renal scintigraphy
- (RUS)
Renal ultrasound
- (VCUG)
Voiding cystourethragram
- (MAG-3)
Mercaptoacetyltriglycine dynamic renal scintigraphy
- (RNC)
Radionuclide cystogram
APPENDIX A: Survey Instrument
Instructions
These questions are about the test your child just had.
All of your answers are completely anonymous
Please read each item below and circle the answer that best reflects your opinion about the test.
Instructions
Lastly, we'd like to ask you some questions about yourself and about your child.
Just like in the last sections, all of your answers are completely anonymous.
Please read each item below and circle or write in the best answer.
Footnotes
Publisher's Disclaimer: This is a PDF file of an unedited manuscript that has been accepted for publication. As a service to our customers we are providing this early version of the manuscript. The manuscript will undergo copyediting, typesetting, and review of the resulting proof before it is published in its final citable form. Please note that during the production process errors may be discovered which could affect the content, and all legal disclaimers that apply to the journal pertain.
References
- 1.Pohl HG, Belman AB. The “top-down” approach to the evaluation of children with febrile urinary tract infection. Adv Urol. 2009:783409. doi: 10.1155/2009/783409. [DOI] [PMC free article] [PubMed] [Google Scholar]
- 2.Tseng MH, Lin WJ, Lo WT, Wang SR, Chu ML, Wang CC. Does a Normal DMSA Obviate the Performance of Voiding Cystourethrography in Evaluation of Young Children after Their First Urinary Tract Infection? The Journal of Pediatrics. 2007;150:96. doi: 10.1016/j.jpeds.2006.09.028. [DOI] [PubMed] [Google Scholar]
- 3.Butler LD, Symons BK, Henderson SL, Shortliffe LD, Spiegel D. Hypnosis reduces distress and duration of an invasive medical procedure for children. Pediatrics. 2005;115:e77. doi: 10.1542/peds.2004-0818. [DOI] [PubMed] [Google Scholar]
- 4.Stashinko EE, Goldberger J. Test or trauma? The voiding cystourethrogram experience of young children. Issues Compr Pediatr Nurs. 1998;21:85. doi: 10.1080/014608698265519. [DOI] [PubMed] [Google Scholar]
- 5.Salmon K, Pereira JK. Predicting children's response to an invasive medical investigation: the Influence of effortful control and parent behavior. J Pediatr Psychol. 2002;27:227. doi: 10.1093/jpepsy/27.3.227. [DOI] [PubMed] [Google Scholar]
- 6.Zelikovsky N, Rodrigue JR, Gidycz CA, Davis MA. Cognitive Behavioral and Behavioral Interventions Help Young Children Cope During a Voiding Cystourethrogram. J Pediatr Psychol. 2000;25:535. doi: 10.1093/jpepsy/25.8.535. [DOI] [PubMed] [Google Scholar]
- 7.Flores G, Olson L, Tomany-Korman SC. Racial and ethnic disparities in early childhood health and health care. Pediatrics. 2005;115:e183. doi: 10.1542/peds.2004-1474. [DOI] [PubMed] [Google Scholar]
- 8.Stevens GD, Shi L. Racial and ethnic disparities in the primary care experiences of children: a review of the literature. Med Care Res Rev. 2003;60:3. doi: 10.1177/1077558702250229. [DOI] [PubMed] [Google Scholar]
- 9.Weech-Maldonado R, Morales LS, Spritzer K, Elliott M, Hays RD. Racial and ethnic differences in parents' assessments of pediatric care in Medicaid managed care. Health Serv Res. 2001;36:575. [PMC free article] [PubMed] [Google Scholar]
- 10.Train H, Colville G, Allan R, Thurlbeck S. Paediatric 99mTc-DMSA imaging: Reducing distress and rate of sedation using a psychological approach. Clin Radiol. 2006;61:868. doi: 10.1016/j.crad.2006.05.009. [DOI] [PubMed] [Google Scholar]
- 11.Sandy Natascha S., Nguyen Hiep T., Ziniel Sonja I., Minnillo Brian J., Penna Frank J., Franceschi Angela M., Chow Jeanne S. Assessment of Parental Satisfaction in Children Undergoing Voiding Cystourethrography Without Sedation. The Journal of urology. 2011 Jan 2;185(2):658–662. doi: 10.1016/j.juro.2010.09.120. Ref Type: Abstract. [DOI] [PubMed] [Google Scholar]


