Abstract
Purpose
MUC1 is a tumor-associated antigen that is aberrantly expressed in cancer and inflammatory bowel disease (IBD). Even though immune cells express low MUC1 levels, their modulations of MUC1 are important in tumor progression. Consistent with previous clinical data that show increased myeloid-derived suppressor cells (MDSCs) in IBD, we now show that down-regulation of MUC1 on hematopoietic cells increases MDSCs in IBD, similar to our data in tumor bearing mice. We hypothesize that MDSC expansion in IBD is critical for tumor progression.
Experimental Design
In order to mechanistically confirm the linkage between Muc1 down-regulation and MDSC expansion, we generated chimeric mice that did not express Muc1 in the hematopoietic compartment (KO→WT). These mice were used in 2 models of colitis and colitis associated cancer (CAC) and their responses were compared to wildtype chimeras (WT→WT).
Results
KO→WT mice show increased levels of MDSCs during colitis and increased pro-tumorigenic signaling in the colon during CAC, resulting in larger colon tumors. RNA and protein analysis demonstrate increased up-regulation of metalloproteinases, collagenases, defensins, complements, growth factors, cytokines and chemokines in KO→WT mice as compared to WT→WT mice. Antibody-mediated depletion of MDSCs in mice during colitis reduced colon tumor formation during CAC.
Conclusion
Development of CAC is a serious complication of colitis and our data highlight MDSCs as a targetable link between inflammation and cancer. Additionally, the lack of MUC1 expression on MDSCs can be a novel marker for MDSCs, given that MDSCs are still not well characterized in human cancers.
Introduction
Inflammatory bowel disease (IBD) is a chronic, idiopathic inflammatory syndrome that involves deregulated homeostasis between the gut microbiota and the mucosal immune system in genetically susceptible individuals. IBD encompasses both ulcerative colitis (UC, affects the colon and/or rectum) and Crohn’s disease (CD, affects any part of the gastrointestinal tract). A serious complication of UC is the development of colitis associated colon cancer (CAC). However, any significant inflammation in the colon, whether as a result of UC or CD, can lead to colon cancer, especially if the inflammation involves a large part of the colon. As such, there is a need for continued clinical, genetic and animal studies for determining the appropriate clinical, genetic, serological and fecal biomarkers (1-3) that could be used to diagnose and stratify IBD, as well as provide information towards the most ideal therapeutic strategy for the patient. Despite identification of susceptibility genes for IBD from genome-wide association studies, it is important to follow up with functional studies given that many of these genes have different functions in epithelial and immune cells, both of which play a major role in IBD pathogenesis. A genome-wide association study has recently identified MUC1 (MUC1 in humans, Muc1 in mice) as a potential susceptibility gene for Crohn’s disease (4). The role of MUC1 in IBD is interesting – the ability to elicit an immune response to the tumor form of MUC1, together with its known oncogenic role in the colonic mucosa, would make it an optimal candidate for immunotherapy to reduce cancer risk in patients suffering from chronic IBD (5). Muc1 knockout (KO) mice have been shown to be more resistant to DSS-induced colitis with a thickening of the mucus layer and less infiltration of T cells (6). However, absence of Muc1 has also been recently shown to result in the exacerbation of chronic inflammation in both Th1-mediated and Th2-mediated colitis models (7). These studies highlight the important role of Muc1 in the complicated etiology of IBD but do not take into account the significant contribution of Muc1 as expressed (and its function) in the hematopoietic compartment with regards to inflammatory signaling.
In the epithelium, MUC1 plays a multi-faceted role ranging from signal transduction in oncogenesis to protecting the epithelium against pathogenic infections (8-10). Originally identified as a result of aberrant over expression in cancer (11), MUC1 has been identified as number 2 on the National Cancer Institute cancer vaccine target antigen prioritization list (12). Compared to its high levels of expression in the epithelium, MUC1 is expressed at a much lower level in immune cells, like T cells, where MUC1 has nevertheless been shown to act as an important adaptor molecule for T cell activation (13, 14). While it is also expressed on other hematopoietic cells like dendritic cells, natural killer cells, B cells, hematopoietic stem and progenitor cells in the bone marrow (15-21), the function and expression pattern of MUC1 in these cells are still relatively unknown.
We observe that in IBD patients, there is an increase in CD14+HLA DR−/lo cells in the peripheral blood that do not express any MUC1. It has previously been shown that increased levels of tumor promoting myeloid-derived suppressor cells (MDSCs) are found in the peripheral blood during IBD and they have been phenotyped to be CD14+HLA DR−/lo (22). We further confirmed our observations in a murine UC model where we show an expansion of Muc1 low expressing CD11b+Gr1+ cells during colitis. We have previously demonstrated that the lack of Muc1 in the bone marrow from Muc1 KO mice resulted in an increased expansion of CD11b+Gr1+ MDSCs that are immune suppressive and promote tumor growth (23). Our current study shows that deletion of hematopoietic Muc1 in chimeric mice (KO→WT) increased expansion of immune suppressive CD11b+Gr1+ cells during chronic colitis, with reduced inflammation in the colon. In our mouse model of CAC, these CD11b+Gr1+ cells were also responsible for the development of larger colon tumors in KO→WT mice as antibody-mediated depletion of CD11b+Gr1+ cells reduced tumor burden. Our data suggests that tumor progression during CAC is not entirely due to the inflammatory damage to the colon. Rather, tumor progression is also dependent on the immune suppressive milieu that is a result of deregulated immune signaling in IBD, which can result in MDSC expansion (22).
Here, we propose that an increase in MUC1 low expressing MDSCs in the peripheral blood in IBD can be responsible for eventual tumor development during CAC. Prolonged circulation of immune suppressive CD11b+Gr1+ cells during colitis can activate pro-tumorigenic pathways to colorectal cancer. Given that MUC1 is currently a vaccine candidate for cancer and IBD (5, 24); knowledge of the function and expression of MUC1 on immune cells would be very useful in preventing inappropriate down-regulation of MUC1 on immune cells by vaccine strategies and can be a useful aid for diagnosis and prognosis of MDSC levels in patients with IBD. Additionally, our data also further highlights the need to functionally study IBD susceptibility genes in the context of epithelial and immune signaling.
Materials and Methods
Peripheral blood was collected from 12 consenting IBD patients (5 patients with CD, 7 patient with UC) with approval from the Institutional Review Board at the Mayo Clinic. Patients enrolled in the study were diagnosed under standard criteria as having active flare of disease. PBMCs were separated on a Ficoll gradient and residual red blood cells were lysed with Pharmlyse (BD Biosciences, San Jose, CA). Cells were stained with antibodies to CD14 and HLA DR (BD Pharmingen, San Diego, CA) and MUC1 (anti-CT2, Mayo Clinic) for flow cytometry analysis.
BM transplant
Eight to 12 week old WT female mice were given 11 Gy irradiation split into two doses, separated by 4 hours. After irradiation, 20 × 106 male donor KO BM cells were i.v. injected into female irradiated WT recipients to generate KO→WT chimeras and WT BM cells were injected to generate WT→WT chimeras. Chimerism was monitored after 30 days using PCR analysis of DNA from PBMCs for presence of the Y chromosome gene product in the female irradiated recipient mice (23, 25) as well as the Muc1 and LacZ gene (26) for WT→WT and KO→WT chimeras respectively (Supplementary Fig 1).
Experimental model of colitis and colitis associated colon cancer (CAC)
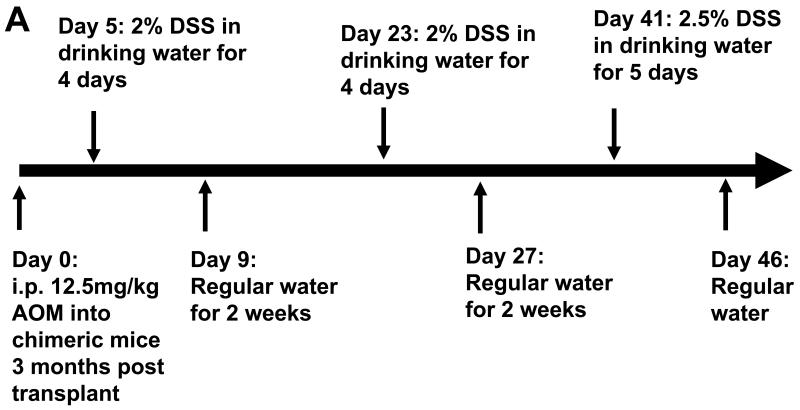
Chimeric mice (WT→WT and KO→WT) were given 3% DSS (MW 36 – 50kDa; MP Biochemicals, Solon, OH) in their drinking water for 4 days, followed by 14 days of regular water. This cycle was repeated an additional 2 more times to mimic the pathology of chronic UC after which mice were sacrificed for histological analysis of inflammatory lesions in the colon. AOM is used to induce colorectal cancer in mice (27) and was used as the carcinogen in our CAC model. Chimeric mice were injected intraperitoneally with 12.5mg/kg of AOM (NCI Chemical Resource Repository, Midwest Research Institute, Kansas City, Missouri) 3 months after the BM transplant was performed. Five days later, colitis was induced in the mice by administration of 2% DSS in the drinking water for 4 days, followed by another 14 days of regular water. This cycle was repeated again, followed by a final administration of 2.5% DSS in drinking water for 5 days (Fig 3A). DSS is a well characterized colonic irritant which upon repeated administration causes chronic inflammation that mimics the pathology of UC, which would enhance the incidence of AOM-induced tumors only in the colon (28). Four months after injection of AOM, mice were sacrificed for evaluation of tumors. Colons were opened longitudinally and washed with PBS before fixing in formalin for paraffin embedding. Histological analysis of the percentage of colon tissue that had tumors after 4 months and inflammatory lesions in the colon at day 47 (1 day after the last DSS drinking cycle, Fig 3A) was evaluated on H&E stained sections by a veterinary pathologist and a 2nd independent viewer. For analysis of collagen, Masson’s Trichome stain was performed on colon slide sections.
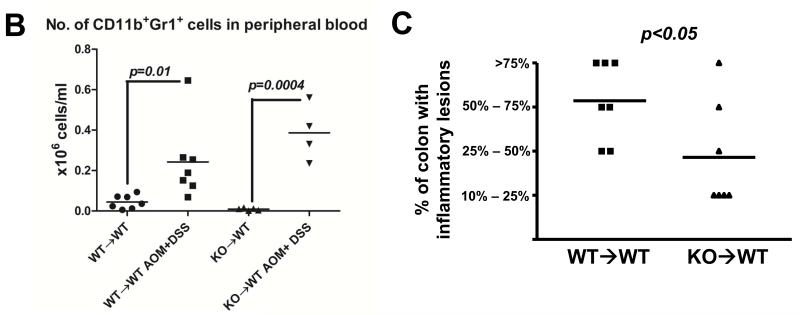
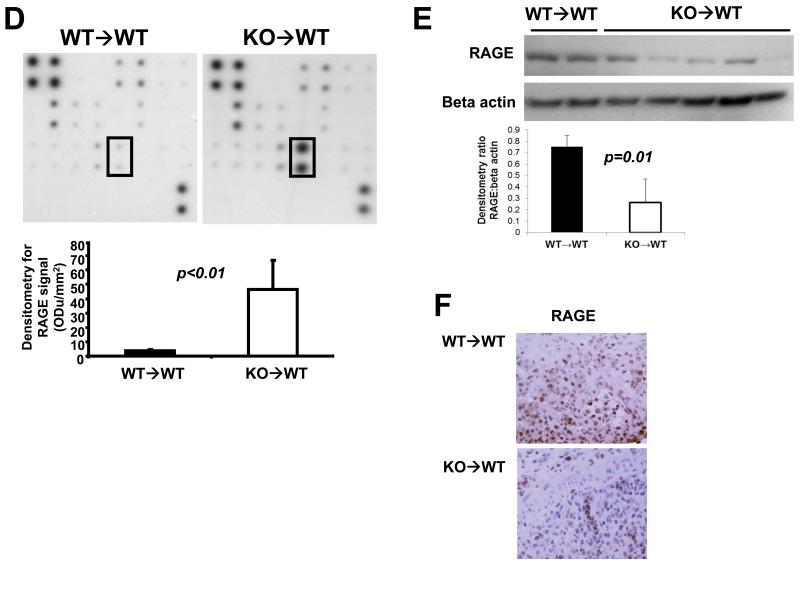
Fig 3. KO→WT mice show less inflammation post colitis after induction of CAC, as compared to WT→WT mice. Reduced inflammation in KO→WT mice was accompanied by increased levels of CD11b+Gr1+ cells and soluble RAGE in peripheral blood and reduced RAGE expression in the colonic mucosa.
(A) Flow chart of CAC experimental model using AOM and DSS. Mice were sacrificed 1 day after the end of the 3rd DSS drinking cycle (Day 47) for (B) analysis of the absolute numbers of CD11b+Gr1+ cells in the PBMCs of WT→WT and KO→WT mice and (C) for histological analysis of H&E colon sections for the percentage of colon that had inflammatory lesions. Incidence of inflammation was similar between WT→WT and KO→WT experimental mice (7 out of 8 WT→WT experimental mice and 7 out of 7 KO→WT experimental mice showed at least 10% or more of the colon that had inflammatory lesions), so only experimental mice that developed inflammation in the colon were compared. (D) Plasma derived from the tail bleeds performed one day after the end of the 3rd DSS cycle (Day 47) were used in a cytokine antibody array for 20 cytokines known to be involved in immune suppression. Boxed areas are spotted with antibodies to RAGE and are representative of results from arrays performed in duplicate for WT→WT and triplicate for KO→WT mice treated with AOM+DSS. Densitometry graph shows the average signal intensity for the RAGE positive spots over replicate experiments. (E) Lysates from colonic mucosa of WT→WT and KO→WT mice treated with AOM and DSS were made for Western blot analysis against RAGE as described in Materials and Methods. Beta-actin was probed for as a loading control. (F) Immunohistochemical staining of RAGE in inflammatory lesions of WT→WT (n=8) and KO→WT (n=6) was performed and data shown is representative of all stained sections. Images were taken at 200× magnification
Immunohistochemistry for RAGE and Gr1
Paraffin colon sections were heated in antigen retrieval solution (Dako, Carpinteria, CA) and blocked in 10% FCS with an avidin-biotin blocking kit (Vector labs, Burlingame, CA), followed by overnight incubation at 4°C with either anti-RAGE (Abcam, Cambridge, MA) or anti-Gr1 (eBioscience, San Diego, CA). Biotinylated secondary antibodies to anti-RAGE or anti-Gr1 were added to slides for 1h, followed by incubation with streptavidin-HRP (BD Pharmingen). Slides were developed using a DAB kit (Vector labs) and counterstained in hematoxylin (Sigma, St Louis. MO)
Isolation of lamina propria cells
One day after the last DSS drinking cycle in the CAC model (Day 47, Fig 3A), mice were sacrificed and colons were dissected and washed in ice cold PBS. Isolation of lamina propria cells from colons was performed as previously described (29). Lamina propria cells were analyzed by flow cytometry using anti-CD11b PE, anti-LY6C FITC and anti-LY6G V450.
Flow cytometry
106 cells were isolated and stained in 1× PBS with 0.5% FCS using the following antibodies at 1μg/ml: anti-B220 FITC, anti-CD11b APC, anti-Gr1 PE, (BD Pharmingen, anti-F4/80 APC (eBioscience) and anti-CT2 (Mayo Clinic Arizona). Anti-CT2 detects the Muc1/MUC1 cytoplasmic tail and cells are permeabilized with BD Cytofix/Cytoperm Fixation/Permeabilization solution (BD Pharmingen) overnight before staining with anti-CT2. Acquisition was performed on a Dako Cyan flow cytometer and analysis was done on Summit 4.3. At least 20 000 events were isolated.
Cytokine array analysis
WT→WT and KO→WT mice were sacrificed on day 47 of the AOM+DSS experimental model, one day after the final duration of 4 days of DSS-treated drinking water, and 0.5ml of blood was collected and loaded on a Ficoll gradient. Plasma was collected and the cytokine content in the plasma was analyzed using the RayBio Mouse Cytokine Antibody Custom Array (Ray Biotech, Norcross, GA) customized for 20 cytokines known to be involved in inflammation and immune suppression, as per manufacturer’s instructions.
Microarray and protein analysis
Two groups of WT→WT and KO→WT mice (either pre-injected with AOM and having undergone 3 cycles of DSS (AOM+DSS), or non-treated control mice, n=3 per group) were sacrificed on day 47 of the AOM+DSS experimental model, one day after the last DSS drinking cycle. Colons were opened longitudinally, washed in PBS and the mucosa from each colon was scraped and individually snap frozen in liquid nitrogen. For Western blot analysis, mucosal cells were lysed with 200μl RIPA lysis buffer, freeze-thawed once and centrifuged at 13 000 rpm for 20 min at 4°C. The supernatant was used for western blot with anti-C1q, anti-RAGE (Abcam) and anti-MMP-10 (Abnova, Littleton, CO). For analysis of MMP activity, mucosal cells were lysed overnight in 200μl of lysis buffer containing 50mM Tris 7.5, 10mM CaCl2, 150mM NaCl, 0.05% w/v Brij-35 before loading onto a precast gelatin zymogram gel (Biorad, Hercules, CA) and developed according to manufacturer’s instructions. Samples were loaded alongside recombinant mouse MMP-2 (R&D systems, Minneapolis, MN) activated with APMA (Sigma).
RNA from colonic mucosa was isolated using the RNeasy MiniKit (Qiagen, Valencia, CA). RNA integrity was determined using an Agilent 2100 Bioanalyzer (Agilent, Wilmington, DE). Cy3 labeled cRNA was generated from 1 μg RNA per sample, using the Quick Amp Labeling kit (Agilent). Quantification and dye incorporation of the labeled cRNA was performed using the Nanodrop (Thermo Scientific, Waltham, MA). Labeled cRNA (1.65μg) was hybridized onto a 4x44 whole mouse genome slide, washed, scanned and feature extracted on an Agilent scanner as per manufacturer’s instructions. Microarray data were loaded onto GeneSpring 11.5 for analysis. During analysis, the gene list data were filtered to remove compromised signals. Unpaired t test was performed between samples from control and AOM+DSS treated mice within each group of chimeras to determine the genes that were significantly altered (p<0.05) upon treatment between WT→WT and KO→WT mice. Genes that were altered less than 2 fold upon treatment with AOM+DSS were subsequently excluded from the gene list. In order to develop a gene signature that could further explain the larger tumors that eventually developed in these mice, GeneGo analysis was used to further categorize genes that were mutually or exclusively altered in WT→WT or KO→WT mice. Microarray data can be accessed at GEO, accession number GSE47487.
RT-PCR validation of microarray results
The same RNA samples (n=3 per treatment or control group) derived from colonic mucosa that were used for microarray analysis were also used for validation of the microarray results. 1μg cDNA was made from these RNA samples and loaded onto TaqMan (Applied Biosystems, Carlsbad, CA) microfluidic cards with TaqMan reaction mix for quantitative RT-PCR analysis per manufacturer’s instructions. The cards are loaded and run on a 7900HT RT-PCR system. The TaqMan microfluidic cards are spotted with 191 sets of primers in duplicate, with an endogenous control (18S). The selected primers are against candidate genes that were derived from our microarray data. Most of the candidate genes assayed for on the TaqMan microfluidic cards have at least 2 different primer sets spotted on the cards. Data were analyzed using the SDS software package, using an automatic baseline and a manual threshold of 0.2 to record the cycle threshold.
Immune suppression assay
CD11b+Gr1+ PBMCs were sorted by flow cytometry from chimeric mice that had under gone 3 rounds of 3% DSS drinking cycles. 104 CD11b+Gr1+ cells sorted from each chimeric mice were incubated with 105 CFSE labeled T cells that were sorted from the spleen with magnetic beads to CD4 and CD8 (Miltenyi Biotec, Auburn, CA). These CFSE labeled T cells were stimulated with 1μg/ml soluble anti-CD3 and 0.5μg/ml soluble anti-CD28. T cell proliferation was analyzed 7 days later via flow cytometry for change in CFSE fluorescence. Percentage of total T cells in each division of the T cell population as reflected by changes in CFSE fluorescence was analyzed using the FlowJo software.
Statistical analysis
All statistical analysis was performed using unpaired student’s t test unless otherwise stated.
Results
Low MUC1 expression on MDSCs in human and mouse peripheral blood during IBD
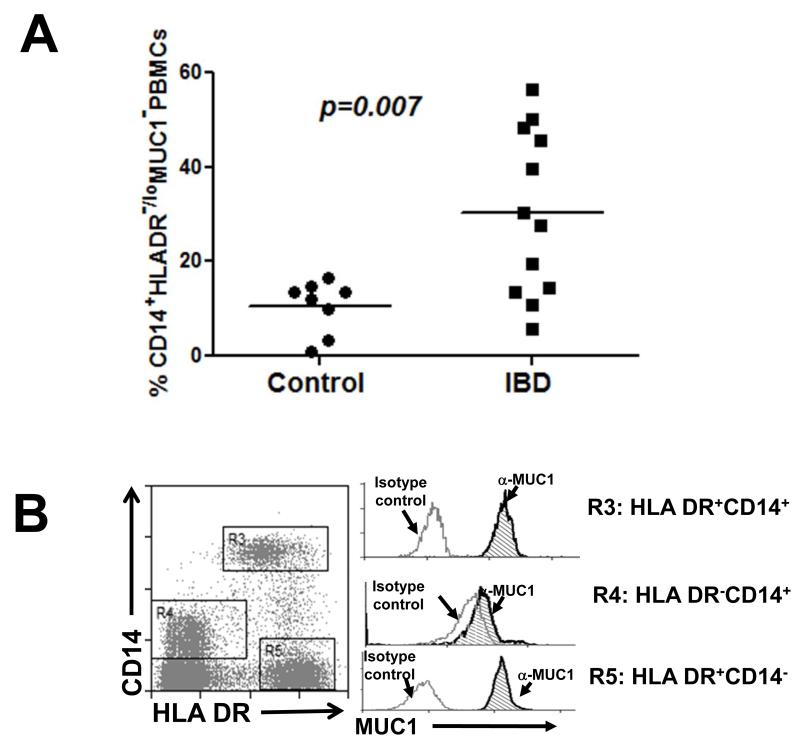
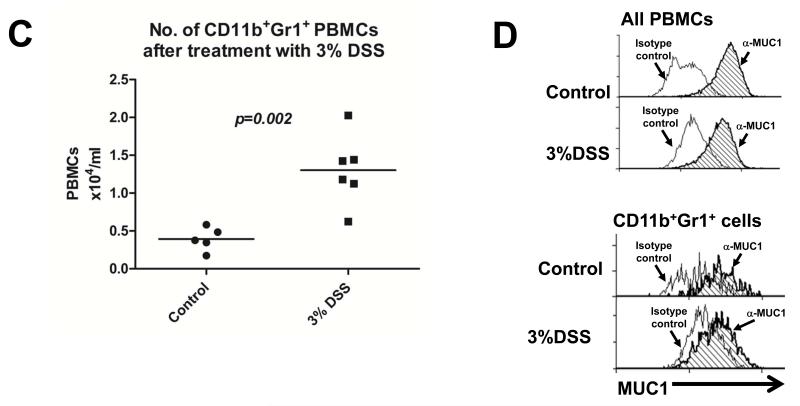
Low levels of MUC1 were detected on increased levels of CD14+HLA DR−/lo PBMCs (Fig 1A and B), a previously described MDSC population (22), from IBD patients who were enrolled at Mayo Clinic Arizona in accordance with IRB guidelines. We also detected increased levels of CD11b+Gr1+ cells, an MDSC phenotype, in C57BL/6 wild type (WT) mice treated with 3% DSS (Fig 1C). Further analysis revealed similarly low levels of Muc1 on these CD11b+Gr1+ cells (Fig 1D), as reflected by a lack of shift in fluorescence intensity in the flow cytometry histogram. The constitutively low expression of Muc1 on increased levels of CD11b+Gr1+ cells further diluted the overall observed levels of Muc1 on PBMCs (Fig 1D).
Fig 1. MDSCs are increased during IBD and do not express MUC1.
(A) Flow cytometry analysis was performed on PBMCs of 12 IBD patients (5 Crohn’s disease, 7 colitis) and 8 age and sex matched healthy controls, using antibodies against HLA DR and CD14 to determine the percentage of total PBMCs that were CD14+HLA DR−/lo. All CD14+HLA DR-/lo cells from control and IBD patients were found to express low levels of MUC1 in (B), hence they were annotated as CD14+HLADR−/loMUC1−. (B) MUC1 analysis was performed for cell populations expressing different levels of CD14 and HLA DR using an antibody against the cytoplasmic tail of MUC1 (CT2) via analysis of change in fluorescence intensity as reflected by a shift in the fluorescent peak in flow cytometry histograms. Histograms showing MUC1 levels in the cell populations expressing different levels of CD14 and HLA DR are representative of all 8 healthy controls and 11 IBD patients. (C) C57BL/6 WT mice were given 3% DSS in their drinking water ad libitum for 4 days and sacrificed 2 days later. PBMCs were analyzed for the percentage of cells that were CD11b+Gr1+ as well as for the (D) MUC1 levels on these cell populations. Analysis was performed using anti-CT2 to detect Muc1 levels separately on CD11b+Gr1+ cells via analysis of change fluorescence intensity as reflected by a shift in the fluorescent peak in flow cytometry histograms. Data shown is representative of n=3 for control mice and n=5 for mice treated with 3% DSS.
Functional impact of Muc1 down regulation during colitis and CAC
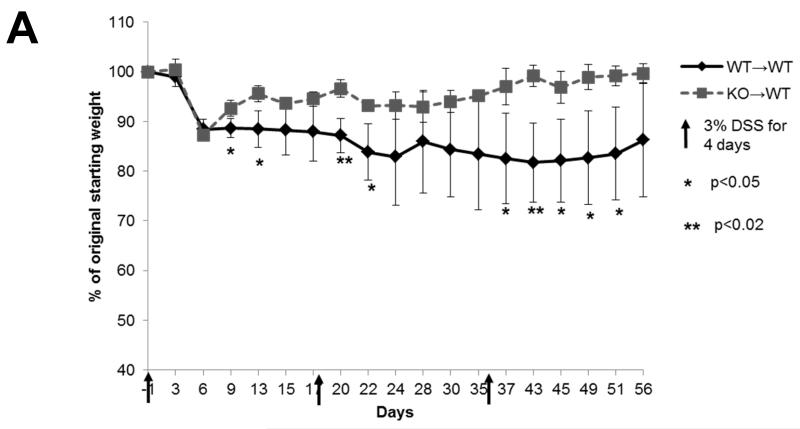
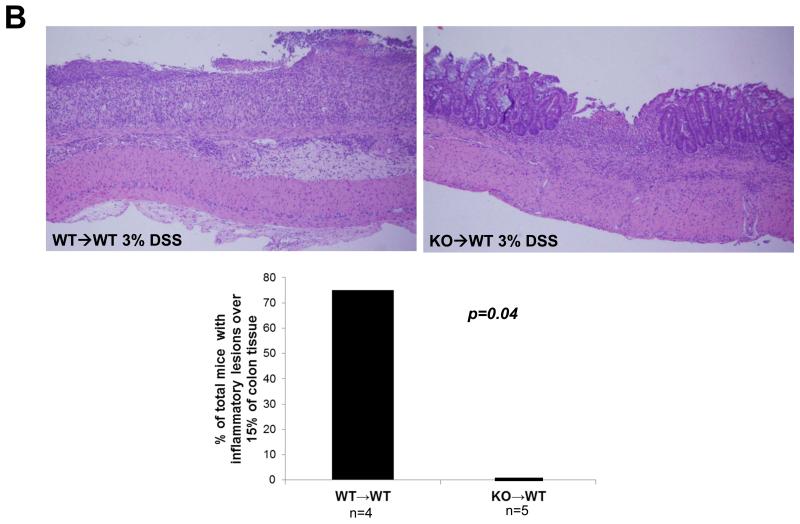
In order to determine the functional effect of low levels of Muc1 on hematopoietic cells during colitis, we performed bone marrow transplants on C57BL/6 WT recipient mice using WT or Muc1 KO bone marrow to generate chimeric mice that either did or did not express Muc1 in the hematopoietic compartment only (WT→WT and KO→WT respectively). We have previously published that Muc1 KO mice are viable (26) with no significant changes in the immune cell compartment at steady state (23). Interestingly, KO→WT mice were significantly healthier (as shown by reduced weight loss) than WT→WT mice when subjected to 3 drinking cycles of 3% DSS (Fig 2A), with significantly smaller inflammatory lesions after the 3rd drinking cycle (Fig 2B).
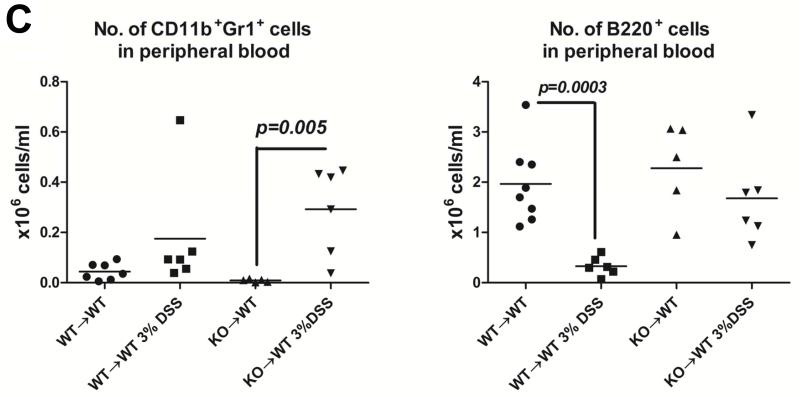
Fig 2. KO→WT mice are more resistant to DSS induced colitis.
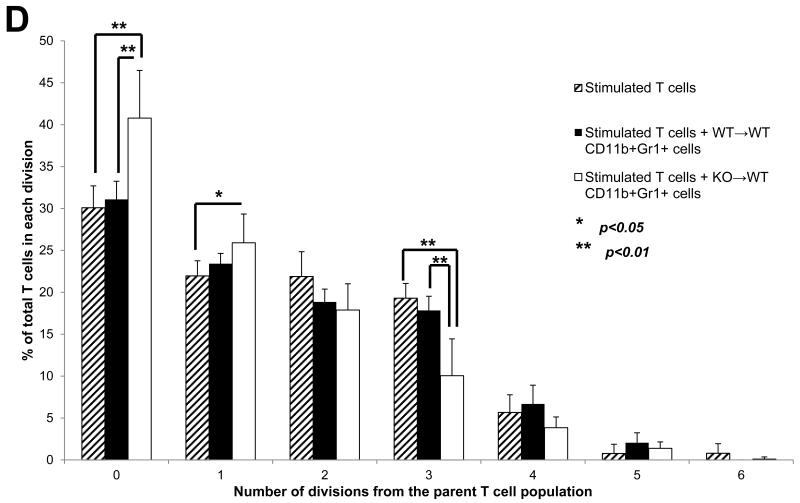
WT→WT and KO→WT chimeric mice were subjected to 3 drinking cycles of 3% DSS as described in Materials and Methods. KO→WT mice showed (A) significantly lesser weight loss and (B) significantly smaller inflammatory lesions (Fisher’s test, p=0.04) in the colon of H&E stained colon sections (images taken at 200x magnification, WT→WT n=4, KO→WT n=5) as compared to similarly treated WT→WT animals. (C) WT→WT and KO→WT mice were tail bled 1 day after the 2nd DSS drinking cycle and PBMCs were obtained for analysis of the levels of CD11b+Gr1+ and B220+cells as determined via flow cytometry. (D) CD11b+Gr1+ cells were sorted by flow cytometry from PBMCs derived from peripheral blood of WT→WT (n=3) and KO→WT mice (n=4) and incubated with T cells that were stained with CFSE. T cells were stimulated with 1μg/ml α-CD3 and 0.5μg/ml α-CD28 and CFSE fluorescence was analyzed by flow cytometry after 7 days. The FlowJo software was used to analyze cell proliferation by assessing the number of T cells within each division of the parent T cell population. The column graph represents the percentage of total T cells in each division and represents 6 divisions of the parent T cell population.
Deleting Muc1 only in the hematopoietic compartment also altered the immune cell phenotype seen during chronic colitis. There was a significant increase in CD11b+Gr1+ cells but no significant decrease in B220+ cells in the KO→WT mice as compared to WT→WT (Fig 2C). We did not observe significant changes in other cell types like T cells and NK cells in both WT→WT and KO→WT mice. As we had previously published that a lack of Muc1 in the bone marrow promoted the expansion of CD11b+Gr1+ MDSCs during tumor growth (23), we analyzed the suppressive ability of CD11b+Gr1+ cells obtained from the PBMCs of KO→WT mice during colitis. Indeed, deletion of MUC1 from the hematopoietic compartment prompted an increase (Fig 2C) in CD11b+Gr1+ cells that were able to suppress T cell proliferation in vitro (Fig 2D). CD11b+Gr1+ cells from colitic KO→WT mice were able to significantly suppress proliferation to a greater extent as compared to CD11b+Gr1+ cells from colitic WT→WT mice (Fig 2D).
MDSCs correlate with tumorigenic advancement of CAC
The increase in CD11b+Gr1+ MDSCs would account for the reduced inflammatory lesions in the colon of KO→WT mice and their overall improved weight as compared to WT→WT mice. MDSCs have been observed in IBD patients in other studies (22); however their origin and function in IBD remain unknown. We hypothesized that prolonged circulation of MDSCs in colitis patients might render genetically susceptible patients more likely to develop colon cancer. To test our hypothesis, we put our mouse chimeras (WT→WT, KO→WT) on a CAC model that uses AOM as a procarcinogen with multiple drinking cycles of DSS to mimic the chronic colitis observed in humans.
We reduced the percentage of DSS used in this model (2% DSS for 4 days, 14 days regular water, 2% DSS for 4 days, 14 days regular water, 2.5% DSS for 5 days, Fig 3A), as using 3% DSS as previously shown resulted in high mortality rates when combined with use of AOM. In the CAC model, both WT→WT and KO→WT mice showed significant increases in CD11b+Gr1+ cells after 3 DSS drinking cycles (Fig 3B). However, there appears to be a trend of higher levels of CD11b+Gr1+ cells in KO→WT mice, with higher mean values and lower p values for the CD11b+Gr1+ data set in KO→WT mice as compared to WT→WT. More importantly, the significant increase in CD11b+Gr1+ cells in KO→WT mice was accompanied by significantly reduced inflammatory lesions in the colon (as compared to similarly treated WT→WT mice) after 3 drinking cycles of DSS (Fig 3C).
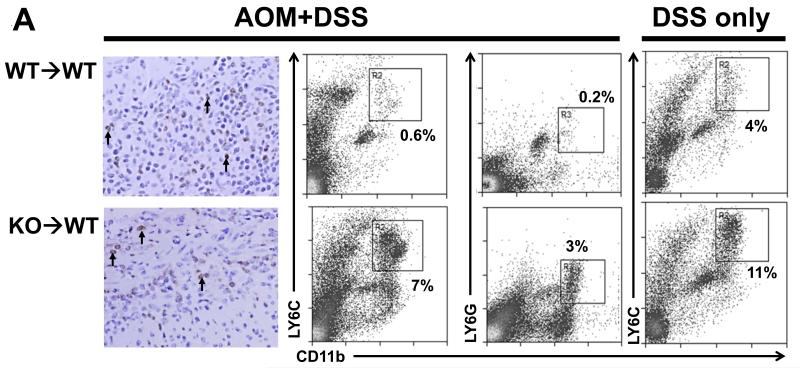
We performed a cytokine array (against 20 cytokines known to be involved in immune suppression) on the plasma of WT→WT and KO→WT mice that were obtained after 3 drinking cycles of DSS and observed a significant increase in the levels of soluble receptor for advanced glycation end products (sRAGE) (Fig 3D). Interestingly, there was a corresponding decrease in RAGE levels in the colonic mucosa of KO→WT mice as compared to WT→WT mice (Fig 3E). Immunohistochemistry analysis also showed lower levels of RAGE staining in inflammatory lesions in KO→WT mice as compared to WT→WT (Fig 3F). Given the increased levels of CD11b+Gr1+ cells in the peripheral blood of KO→WT mice as compared to WT→WT mice in both colitis and CAC models (Fig 2C and 3B), we proceeded to compare the levels of CD11b+Gr1+ cells in inflammatory lesions of WT→WT and KO→WT mice. Immunohistochemistry staining revealed similar levels of Gr1+ cells in the inflammatory lesions of both WT→WT and KO→WT mice (Fig 4A). However, flow cytometry analysis showed greater amounts of CD11b+Gr1+ cells (as detected by antibodies to both Gr1 subtypes – LY6C and LY6G) in the lamina propria of KO→WT mice as compared to WT→WT (Fig 4A).
Fig 4. One day after the last DSS drinking cycle in the CAC and colitis model, KO→WT mice show increased levels of CD11b+Gr1+ cells in the lamina propria as compared to WT→WT mice. Four months after the start of the AOM+DSS experimental model KO→WT mice show increased colon tumors as compared to WT→WT mice that could be reduced with anti-Gr1 treatment during each DSS cycle.
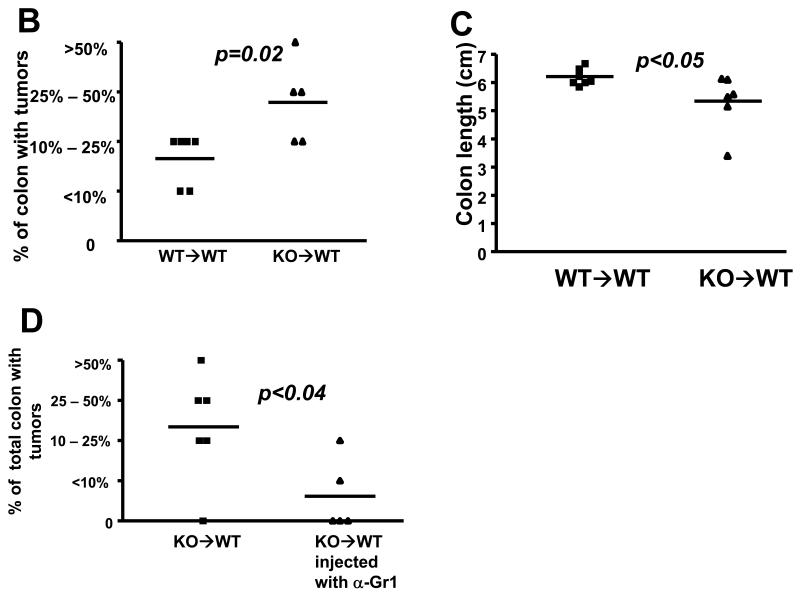
(A) WT→WT and KO→WT mice were sacrificed 1 day after the last DSS drinking cycle of the CAC model and colons were either fixed in formalin and embedded in paraffin for immunohistochemical staining of Gr1+ cells (left most panel, images taken at 200x magnification. Black arrows indicate some of the cells that stained positive for Gr1) or used for isolation of lamina propria cells. Lamina propria cells were analyzed with antibodies to CD11b and the two subtypes of Gr1 (LY6C and LY6G) via flow cytometry. WT→WT and KO→WT mice were also sacrificed 1 day after the last DSS drinking cycle of the 3% DSS colitis model and lamina propria cells were similarly analyzed for CD11b and LY6C (right most panel). No significant difference in CD11b+LY6G+ cells were observed between the lamina propria cells from WT→WT and KO→WT on the 3% DSS colitis model, hence the data were not shown. Lamina propria data reflect pooled cells from at least n=5 for each group of WT→WT and KO→WT mice analyzed. WT→WT and KO→WT mice were sacrificed after 4 months after the start of the AOM+DSS experimental model for (B) histological analysis of percentage of colon tissue that had developed adenomas. Tumor incidence was similar between WT→WT and KO→WT experimental mice (6 out of 7 WT→WT and 5 out of 6 KO→WT mice developed colonic tumors), so only experimental mice that had developed tumors are shown. (C) Measurement of colon length in all chimeric mice subjected to the AOM+DSS experimental model. (D) KO→WT mice were injected with 100μg anti-Gr1 on the 2nd day after starting each DSS cycle in the AOM+DSS experimental model and sacrificed 4 months later for analysis of the percentage of colon tissue that had developed tumors. Graph shows mice that did or did not develop tumors and reflects a reduction in tumor incidence and size upon treatment with anti-Gr1.
Consistent with the ability of immune suppressive CD11b+Gr1+ MDSCs to promote tumor growth, we observed a significant increase in the eventual colonic tumor load of KO→WT mice (Fig 4B) and shorter colon lengths (Fig 4C), a pathological characteristic (30). The increase of CD11b+Gr1+ cells during each colitic cycle appeared to be responsible at least in part for tumor growth because depletion with anti-Gr1 during each DSS drinking cycle reduced the percentage of total colon that had developed tumors in KO→WT mice (Fig 4D).
Impact of increased MDSCs during CAC on the gene expression profile in the colon
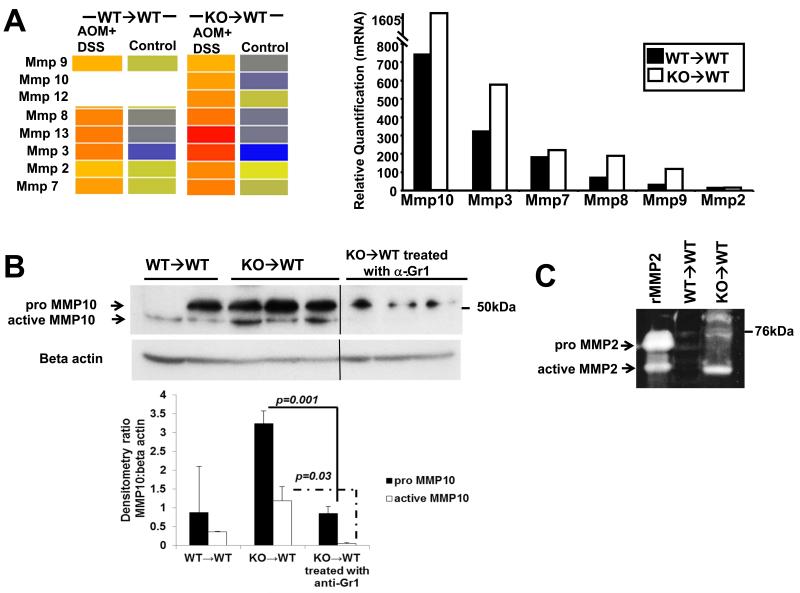
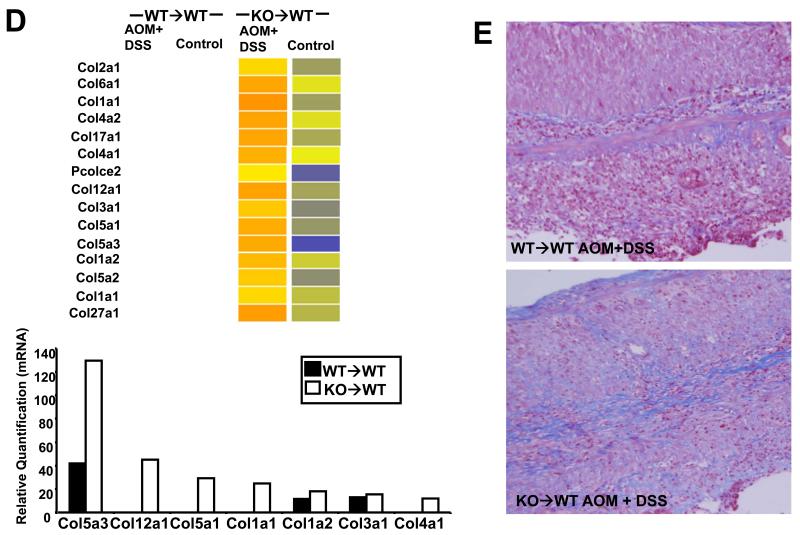
Consistent with the increased tumor load, KO→WT mice on the CAC model also showed increased transcription, protein levels and activity of Mmps (Fig 5). Western blot analysis showed increased levels of the pro and active forms of Mmp-10 in the colitic colonic mucosa of KO→WT mice compared to WT→WT, which could be reduced upon treatment with anti-Gr1 (Fig 5B). Gelatin zymography also showed increased MMP-2 activity in the colitic colonic mucosa of KO→WT mice as compared to WT→WT (Fig 5C). Further evidence of increased ECM remodeling was seen by the increased transcription and protein levels of collagen in the colon as shown by microarray, qRT-PCR (Fig 5D) and Masson’s Trichome stain of colon sections (Fig 5E).
Fig 5. Post colitic KO→WT mice showed increased ECM remodelling in the colonic mucosa as compared to similarly treated WT→WT mice.
Analysis of gene regulation was performed on RNA derived from the colonic mucosa of treated and untreated chimeric mice one day after the end of the 3rd DSS cycle (day 47). (A, left panel) Microarray data is depicted in heat maps that show the transcriptional regulation of Mmps with (A, right panel) validation of Mmp genes derived from the microarray analysis as performed with the TaqMan microfluidic cards as described in Materials and Methods. Blanks in heat maps indicate that the genes were not altered by at least 2 fold and were thus not considered during analysis. (B) Lysates from colonic mucosa of WT→WT, KO→WT and KO→WT mice treated with anti-Gr1 were made as described in Materials and Methods for Western blot analysis of pro and active Mmp-10 levels. All lysates were run on the same gel and the vertical line on gels indicates scans of different areas of the same gel. (C) WT→WT and KO→WT mice were sacrificed 1 day after the end of the 3rd DSS cycle on the 3% colitis model and Mmp-2 activity was analyzed via gelatin zymography. Samples were run alongside activated recombinant Mmp-2 (rMmp-2). (D, top panel) Microarray data is similarly depicted in heat maps that show the transcriptional regulation of collagen genes with (D, bottom panel) validation of collagen genes derived from the microarray analysis as performed with the TaqMan microfluidic cards. (E) Representative colon sections of WT→WT and KO→WT mice treated with AOM+DSS that were stained with Masson’s Trichome stain to reflect increased collagen deposition (stained blue) in the colons of treated KO→WT mice. Colon sections show typical inflammatory lesions from both WT→WT and KO→WT mice treated with AOM+DSS. (Images were taken at 200x magnification).
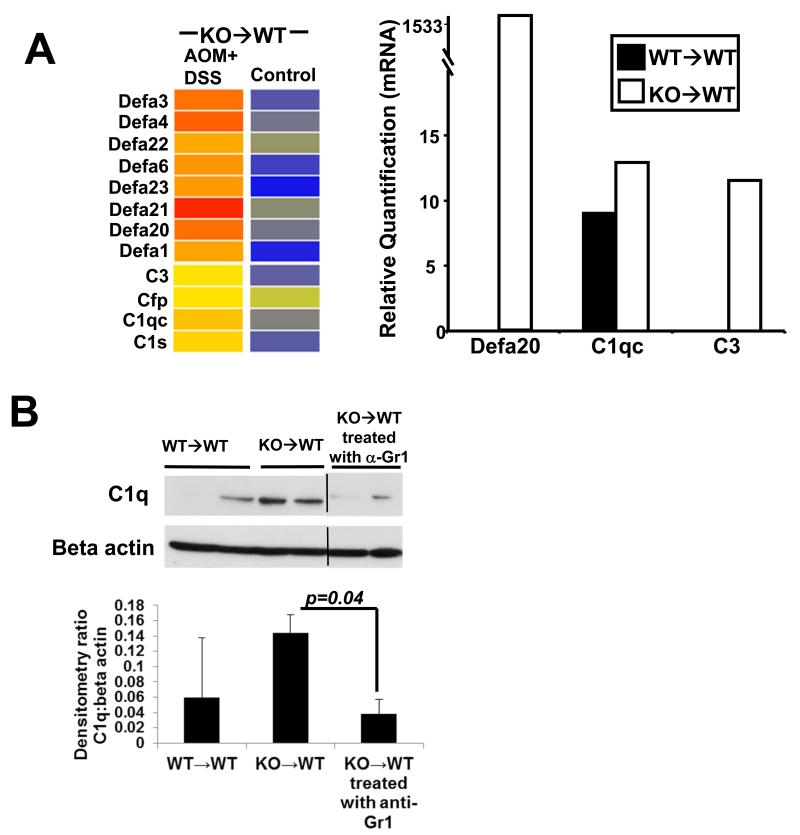
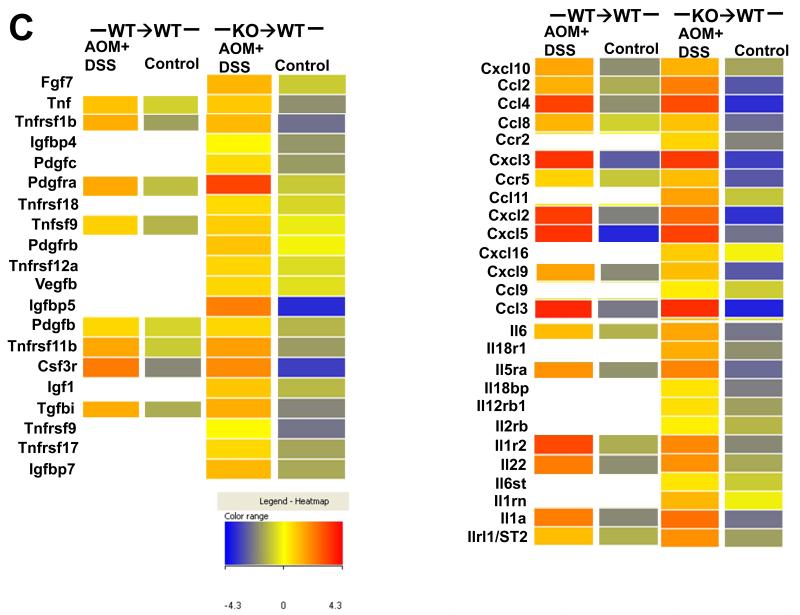
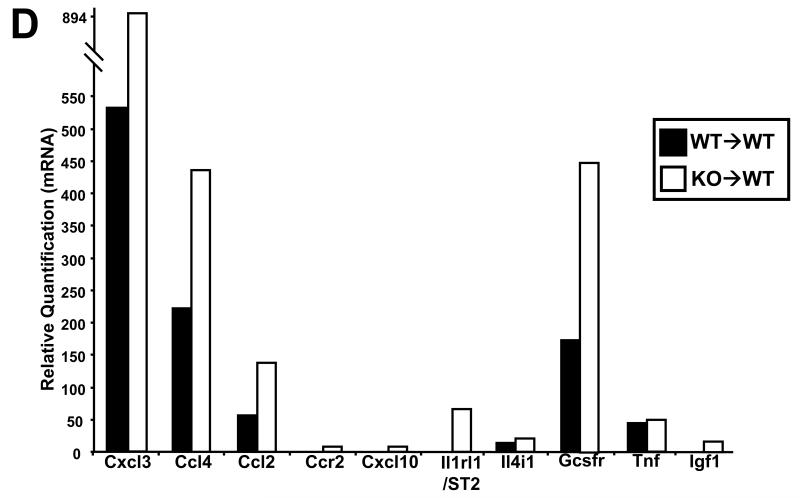
Interestingly, microarray (Fig 6A, left panel) and confirmatory qRT-PCR (Fig 6A, right panel) analysis showed increased transcription of defensin and complement genes in KO→WT mice on the CAC model. These mice also showed increased levels of the complement protein C1q in the distal colonic mucosa which could be reduced upon treatment with anti-Gr1 (Fig 6B). Our microarray data showed increased growth factor and chemokine signaling (Fig 6C) in the colonic mucosa of KO→WT mice on the CAC model after 3 DSS drinking cycles. From the microarray data, the growth factor, chemokine and interleukin genes that were confirmed by further qRT-PCR analysis are Cxcl3, Ccl4, Ccl2, Ccr2, Cxcl10, Il1rl1/ST2, Il4i1, Gcsfr, Tnf and Igf1 (Fig 6D), which have been shown to be involved in tumor development (31-35).
Fig 6. Post colitic KO→WT mice showed increased protumorigenic signaling in the colonic mucosa as compared to similarly treated WT→WT mice.
(A, left panel) Microarray data are depicted in heat maps that show the regulation of gene transcription for defensins and complements in chimeric mice at day 47 of the AOM+DSS experimental model. (A, right panel) Validation of defensins and complement transcription derived from the microarray analysis was performed with the TaqMan microfluidic cards. (B) Lysates from colonic mucosa of WT→WT, KO→WT and KO→WT mice treated with anti-Gr1 were made as described in Materials and Methods for Western blot analysis with anti-C1q. (C) Microarray data are depicted in heat maps that show the regulation of genes involved in growth, chemokine and cytokine signaling in chimeric mice at day 47 of the AOM+DSS experimental model. (D) Validation of growth, chemokine and cytokine signaling genes derived from the microarray analysis was performed with the TaqMan microfluidic cards.
Discussion
Role of hematopoietic Muc1 during acute and chronic inflammation and its role in the progression to CAC
We show here for the first time that IBD patients have increased levels of CD14+HLA DR−/lo MDSCs that express low levels of MUC1. In mice, down regulation of MUC1 on PBMCs during colitis indicates an expansion of CD11b+Gr1+ MDSCs that express low levels of Muc1. We have previously shown using Muc1 KO mice that deletion of Muc1 on hematopoietic cells promotes expansion of CD11b+Gr1+ MDSCs during tumor development (23). We show here that similar down regulation of Muc1 on hematopoietic cells also promotes the expansion of immune suppressive CD11b+Gr1+ cells during colitis that enhanced colon tumor development in KO→WT mice. We observed similar levels of Gr1+ cells in the inflammatory lesions of WT→WT and KO→WT mice, however, flow cytometry of the colonic lamina propria cells revealed that more of these cells were CD11b+Gr1+ in KO→WT mice as compared to WT→WT. CD11b+Gr1+ cells decreased steadily to normal levels during the recovery period post DSS-induced colitis (data not shown) but the increase in CD11b+Gr1+ cells during colitis was sufficient to alter the colonic microenvironment such that more tumors eventually developed in KO→WT mice on the CAC model as compared to WT→WT mice. Even though MDSCs have been shown to be present in IBD patients (22), this is the first time that the transient inflammatory expansion of CD11b+Gr1+ MDSCs during colitis has been shown to promote a protumorigenic milieu in the progression of CAC.
In our model, we observed an increase in soluble RAGE (sRAGE) in the plasma of KO→WT mice that was concomitant with the increase in CD11b+Gr1+ cells (as compared to WT→WT) after 3 DSS drinking cycles. The increase in sRAGE could be a result of cleavage of RAGE (36), given that we observed a reduction of RAGE levels in the colonic mucosa of KO→WT mice treated with AOM+DSS. RAGE activation can activate NF-κB signaling, leading to transcription of pro-inflammatory factors (37). Therefore, it is likely that the anti-inflammatory effects observed in KO→WT mice during colitis are a result of reduced RAGE signaling in the colon. Additionally, MDSCs have been shown to express RAGE (38). It is possible that the increased level of sRAGE in the plasma of KO→WT mice treated with AOM+DSS is also a result of additional cleavage of RAGE from the increased levels of CD11b+Gr1+ MDSCs. Preliminary data in our studies appear to indicate that treatment with anti-Gr1 during the DSS drinking cycles can reduce the levels of sRAGE in the plasma (data not shown). Despite the anti-inflammatory effects of reduced RAGE signaling in the colon, our microarray analysis of the colonic mucosa uncovered a gene signature in the colons of KO→WT mice treated with AOM+DSS that was more protumorigenic than in similarly treated WT→WT mice. This indicates that tumor progression can still proceed in the presence of lower levels of colonic inflammation during colitis in KO→WT mice, as compared to similarly treated WT→WT mice. These findings further emphasize the significance of the IBD-associated deregulation of immune signaling towards protumorigenic immune suppression, for example, via the generation of MDSCs.
Transcriptional network involved in tumorigenesis in the absence of hematopoietic Muc1
We did not observe any significant difference between KO→WT and WT→WT untreated mice, indicating that the differences in gene signatures observed are purely due to the induction of CAC in these mice. Given the larger tumors that eventually developed in KO→WT mice, it was not surprising that the colonic mucosa of post-colitic KO→WT mice reflected a larger amount of ECM remodeling, of which increased transcription of collagen and Mmp genes predominated. These data were further confirmed by the increased collagen deposition with Masson’s Trichome stain and increased Mmp-2 activity. Increased levels of MMP-2 have been found in biopsy specimens of Crohn’s disease and UC (39). Increased levels of pro and active MMP-10 were observed in the mucosa of colitic KO→WT mice. MMP-10 has been described to be produced by infiltrating myeloid cells during colitis (40) and our data confirms that observation by showing that the levels of pro and active MMP-10 could be reduced with anti-Gr1 treatment
Intriguingly, our microarray data reflect a dramatic increase in innate immune signaling, as indicated by up regulation of α-defensin and complement genes, in KO→WT treated mice, as compared to WT→WT mice. Defensins are anti-microbicidal peptides and expression of α-defensins has been shown to be up regulated in colonic tumor mucosa (41). We observed up-regulation of a variety of alpha defensins in our microarray data but were only able to spot primers for Defa 1, 4 and 20 on our TaqMan microfluidic cards. Of these 3 Defas, only up-regulation of Defa 20 in post-colitic KO→WT mucosa was validated in our TaqMan microfluidic card analysis. Defa 20 was observed to be similarly up regulated in a mouse model of 1,2 dimethylhydrazine (DMH)-induced colorectal cancer and thought to be associated with tumorigenesis (42). Increased activation of the complement pathway in the post-colitic KO→WT mucosa also parallels studies by others which show elevation of the complement effector protein, C3, in the colon of IBD patients (43). Additionally, activation of the complement pathway is also a potential immune suppressive mechanism which could promote tumor formation in CAC (44). C1q has been shown to promote canonical Wnt signaling and aging related phenotypes (45). Wnt signaling is important in the progression of colon cancer (46), which could be significant in our data given that we observe C1q up-regulation in the colonic mucosa of KO→WT mice during CAC that could be reversed with anti-Gr1 treatment.
We observed marked up-regulation of Ccl2 and Ccr2 in the mucosa of post-colitic KO→WT mice. Blocking of Ccl2 signaling has been shown to be able to reduce tumor incidence in CAC (32). Increased growth signaling as seen by the increased transcription of Gcsfr, Tnf, Tgf and Igf signaling in post-colitic colonic mucosa of KO→WT chimeras can help promote tumor growth in these mice. Tnf-α can regulate the trafficking of macrophages to the site of inflammation and blocking of the Tnf-α/Tnf receptor axis reduced colorectal carcinogenesis (34). Additionally, GCSFR and Igf1 have been shown to be up regulated in colorectal cancer (33, 35, 47).
The role of Muc1/MUC1 loss on hematopoietic cells in the tumorigenic progression of malignantly transformed cells in the colon
This is the first time that down regulation of Muc1 on PBMCs has been shown to be indicative of an increase in Muc1 low expressing CD11b+Gr1+ MDSCs during colitis in mice. Similarly, we have also shown that CD14+ HLA DR−/lo cells, purported to be indicative of the MDSC population in IBD (22), also do not express MUC1. We observe a lack of reduction of B220+ cells in the peripheral blood during colitis in KO→WT mice as compared to WT→WT. The deletion of hematopoietic Muc1 prevented the down regulation of B220+ cells in KO→WT mice during colitis, either at the B cell level or through a lack of differentiation of B220+ progenitor cells. This may be related to the increased expansion of MDSCs observed in the KO→WT mice as an effect of disease-associated shunting of immune developmental pathways and could be important for the changes we observe in inflammation and tumor development. However, for this paper, we chose to focus on the role of the expansion of Muc1 low expressing CD11b+Gr1+ MDSCs for two reasons: (i) MDSCs are found in IBD patients (22) but their functions remain unknown, and (ii) we have shown a direct link between deletion of Muc1 in mice and MDSC expansion during tumor development (23). MDSCs in colitis do not appear to contribute to alleviation of inflammation in patients, as all of our patient samples were derived from patients having an active flare of disease; however, they can play a significant role in promoting eventual tumor development, which is what we have shown phenotypically and mechanistically in this paper.
MDSCs expand in part due to the deregulated cytokine production during colitis and can result in an altered pro-tumorigenic colonic micro environment in genetically susceptible individuals. KO→WT mice exhibit increased peripheral levels of MDSCs with reduced inflammation during colitis. Depletion of MDSCs in KO→WT mice reduced tumorigenesis indicating that CAC progression is dependent on MDSCs. Furthermore, we have shown that levels of Mmp-10 and the complement C1q can be modulated by MDSCs as depletion with anti-Gr1 blocked the increase in levels of these proteins in KO→WT mice. Our data show that tumor progression in CAC is not entirely dependent on the inflammatory colonic damage caused during colitis. In fact, deregulated immune signaling as a result of the colitic inflammation is an important component for tumor progression. Our data indicate a need to consistently analyze the levels of peripheral MDSCs and other immune cell populations during colitis. Inappropriate skewing of the immune profile during colitis towards a protumorigenic phenotypic (e.g. accumulation of MDSCs) might be responsible for promoting CAC, even after recovery from colitic inflammatory damage in the colon.
Our data highlight a crucial link for CD11b+Gr1+ MDSCs in the transition from inflammation to cancer in CAC, independent of inflammatory damage in the colon. Preventing this process could be an important pathway to target. Furthermore, MDSCs are not well characterized in humans across different diseases and down regulation of MUC1 might be a further prognostic marker for MDSCs in cancer and inflammation.
Supplementary Material
Translational relevance.
Chronic inflammatory damage to the colon during colitis has long been assumed to be the classic, primary cause for eventual progression to colitis associated cancer. As such, therapies have been designed towards the prevention of the inflammatory process. We have discovered that the expansion of MDSCs during chronic colitis is responsible for altering the colonic microenvironment towards colon tumor development and represents an important therapeutic target. Our data further highlight the importance of monitoring colitis patients for immune suppressive profiles like MDSC expansion and/or T cell dysfunction that could be responsible for the eventual development of cancer in genetically susceptible individuals. Additionally, we also show that the lack of MUC1 on MDSCs can be a novel marker for MDSCs, given that MDSCs are still not well characterized in human cancers.
Acknowledgements
This work was funded by NIH/NCI RO1 CA64389 (SJG), The Mayo Foundation and a fellowship from the Immunology, Transplantation and Infectious Disease Theme at the Mayo Clinic (TWP). We thank Edna Ramos and Narcelle Jean-Louis from Mayo Clinic Arizona for their help in enrollment of IBD patients.
Footnotes
Conflict of interest statement
The authors have read and concur with the submission and declare no conflicting financial interest.
References
- 1.Zhang TY, Song BW, Zhu W, Xu X, Gong QQ, Morando C, et al. An Ileal Crohn’s Disease Gene Signature Based on Whole Human Genome Expression Profiles of Disease Unaffected Ileal Mucosal Biopsies. PLoS One. 2012;7:e37139. doi: 10.1371/journal.pone.0037139. [DOI] [PMC free article] [PubMed] [Google Scholar]
- 2.McGovern DP, Gardet A, Torkvist L, Goyette P, Essers J, Taylor KD, et al. Genome-wide association identifies multiple ulcerative colitis susceptibility loci. Nat Genet. 2010;42:332–7. doi: 10.1038/ng.549. [DOI] [PMC free article] [PubMed] [Google Scholar]
- 3.Iskandar HN, Ciorba MA. Biomarkers in inflammatory bowel disease: current practices and recent advances. Transl Res. 2012;159:313–25. doi: 10.1016/j.trsl.2012.01.001. [DOI] [PMC free article] [PubMed] [Google Scholar]
- 4.Franke A, McGovern DP, Barrett JC, Wang K, Radford-Smith GL, Ahmad T, et al. Genome-wide meta-analysis increases to 71 the number of confirmed Crohn’s disease susceptibility loci. Nat Genet. 2010;42:1118–25. doi: 10.1038/ng.717. [DOI] [PMC free article] [PubMed] [Google Scholar]
- 5.Beatty PL, Narayanan S, Gariepy J, Ranganathan S, Finn OJ. Vaccine against MUC1 antigen expressed in inflammatory bowel disease and cancer lessens colonic inflammation and prevents progression to colitis-associated colon cancer. Cancer Prev Res (Phila) 3:438–46. doi: 10.1158/1940-6207.CAPR-09-0194. [DOI] [PMC free article] [PubMed] [Google Scholar]
- 6.Petersson J, Schreiber O, Hansson GC, Gendler SJ, Velcich A, Lundberg JO, et al. Importance and regulation of the colonic mucus barrier in a mouse model of colitis. Am J Physiol Gastrointest Liver Physiol. 2011;300:G327–33. doi: 10.1152/ajpgi.00422.2010. [DOI] [PMC free article] [PubMed] [Google Scholar]
- 7.Nishida A, Lau CW, Zhang M, Andoh A, Shi HN, Mizoguchi E, et al. The Membrane-Bound Mucin Muc1 Regulates Th17-Cell Responses and Colitis in Mice. Gastroenterology. 2011 Dec 24; doi: 10.1053/j.gastro.2011.12.036. Epub ahead of print. [DOI] [PMC free article] [PubMed] [Google Scholar]
- 8.Hollingsworth MA, Swanson BJ. Mucins in cancer: protection and control of the cell surface. Nat Rev Cancer. 2004;4:45–60. doi: 10.1038/nrc1251. [DOI] [PubMed] [Google Scholar]
- 9.Singh PK, Hollingsworth MA. Cell surface-associated mucins in signal transduction. Trends Cell Biol. 2006;16:467–76. doi: 10.1016/j.tcb.2006.07.006. [DOI] [PubMed] [Google Scholar]
- 10.Hattrup CL, Gendler SJ. Structure and function of the cell surface (tethered) mucins. Annu Rev Physiol. 2008;70:431–57. doi: 10.1146/annurev.physiol.70.113006.100659. [DOI] [PubMed] [Google Scholar]
- 11.Gendler SJ, Lancaster CA, Taylor-Papadimitriou J, Duhig T, Peat N, Burchell J, et al. Molecular cloning and expression of human tumor-associated polymorphic epithelial mucin. J Biol Chem. 1990;265:15286–93. [PubMed] [Google Scholar]
- 12.Cheever MA, Allison JP, Ferris AS, Finn OJ, Hastings BM, Hecht TT, et al. The prioritization of cancer antigens: a national cancer institute pilot project for the acceleration of translational research. Clin Cancer Res. 2009;15:5323–37. doi: 10.1158/1078-0432.CCR-09-0737. [DOI] [PMC free article] [PubMed] [Google Scholar]
- 13.Li Q, Ren J, Kufe D. Interaction of human MUC1 and beta-catenin is regulated by Lck and ZAP-70 in activated Jurkat T cells. Biochem Biophys Res Commun. 2004;315:471–6. doi: 10.1016/j.bbrc.2004.01.075. [DOI] [PubMed] [Google Scholar]
- 14.Mukherjee P, Tinder TL, Basu GD, Gendler SJ. MUC1 (CD227) interacts with lck tyrosine kinase in Jurkat lymphoma cells and normal T cells. J Leukoc Biol. 2005;77:90–9. doi: 10.1189/jlb.0604333. [DOI] [PubMed] [Google Scholar]
- 15.Agrawal B, Krantz MJ, Parker J, Longenecker BM. Expression of MUC1 mucin on activated human T Cells - Implications for a role of MUC1 in normal immune regulation. Cancer Res. 1998;58:4079–81. [PubMed] [Google Scholar]
- 16.Treon SP, Mollick JA, Urashima M, Teoh G, Chauhan D, Ogata A, et al. MUC1 core protein is expressed on multiple myeloma cells and is induced by dexamethasone. Blood. 1999;93:1287–98. [PubMed] [Google Scholar]
- 17.Kruger W, Kroger N, Zander AR. MUC1 expression in hemopoietic tissues. J Hematother Stem Cell Res. 2000;9:409–10. doi: 10.1089/152581600419044. [DOI] [PubMed] [Google Scholar]
- 18.Gendler SJ. MUC1, the renaissance molecule. J Mammary Gland Biol Neoplasia. 2001;6:339–53. doi: 10.1023/a:1011379725811. [DOI] [PubMed] [Google Scholar]
- 19.Rughetti A, Biffoni M, Pierelli L, Rahimi H, Bonanno G, Barachini S, et al. Regulated expression of MUC1 epithelial antigen in erythropoiesis. Br J Haematol. 2003;120:344–52. doi: 10.1046/j.1365-2141.2003.04038.x. [DOI] [PubMed] [Google Scholar]
- 20.Cloosen S, Gratama J, van Leeuwen EB, Senden-Gijsbers BL, Oving EB, von Mensdorff-Pouilly S, et al. Cancer specific Mucin-1 glycoforms are expressed on multiple myeloma. Br J Haematol. 2006;135:513–6. doi: 10.1111/j.1365-2141.2006.06331.x. [DOI] [PubMed] [Google Scholar]
- 21.Fatrai S, Schepers H, Tadema H, Vellenga E, Daenen SM, Schuringa JJ. Mucin1 expression is enriched in the human stem cell fraction of cord blood and is upregulated in majority of the AML cases. Exp Hematol. 2008 doi: 10.1016/j.exphem.2008.04.015. [DOI] [PubMed] [Google Scholar]
- 22.Haile LA, von Wasielewski R, Gamrekelashvili J, Kruger C, Bachmann O, Westendorf AM, et al. Myeloid-derived suppressor cells in inflammatory bowel disease: a new immunoregulatory pathway. Gastroenterology. 2008;135:871–81. 81, e1–5. doi: 10.1053/j.gastro.2008.06.032. [DOI] [PubMed] [Google Scholar]
- 23.Poh TW, Bradley JM, Mukherjee P, Gendler SJ. Lack of Muc1-regulated beta-catenin stability results in aberrant expansion of CD11b+Gr1+ myeloid-derived suppressor cells from the bone marrow. Cancer Res. 2009;69:3554–62. doi: 10.1158/0008-5472.CAN-08-3806. [DOI] [PMC free article] [PubMed] [Google Scholar]
- 24.Lakshminarayanan V, Thompson P, Wolfert MA, Buskas T, Bradley JM, Pathangey LB, et al. Immune recognition of tumor-associated mucin MUC1 is achieved by a fully synthetic aberrantly glycosylated MUC1 tripartite vaccine. Proc Natl Acad Sci U S A. 2012;109:261–6. doi: 10.1073/pnas.1115166109. [DOI] [PMC free article] [PubMed] [Google Scholar]
- 25.Novak EK, Reddington M, Zhen L, Stenberg PE, Jackson CW, McGarry MP, et al. Inherited thrombocytopenia caused by reduced platelet production in mice with the gunmetal pigment gene mutation. Blood. 1995;85:1781–9. [PubMed] [Google Scholar]
- 26.Spicer AP, Rowse GJ, Lidner TK, Gendler SJ. Delayed mammary tumor progression in Muc-1 null mice. J Biol Chem. 1995;270:30093–101. doi: 10.1074/jbc.270.50.30093. [DOI] [PubMed] [Google Scholar]
- 27.Okayasu I, Ohkusa T, Kajiura K, Kanno J, Sakamoto S. Promotion of colorectal neoplasia in experimental murine ulcerative colitis. Gut. 1996;39:87–92. doi: 10.1136/gut.39.1.87. [DOI] [PMC free article] [PubMed] [Google Scholar]
- 28.Greten FR, Eckmann L, Greten TF, Park JM, Li ZW, Egan LJ, et al. IKKbeta links inflammation and tumorigenesis in a mouse model of colitis-associated cancer. Cell. 2004;118:285–96. doi: 10.1016/j.cell.2004.07.013. [DOI] [PubMed] [Google Scholar]
- 29.Weigmann B, Tubbe I, Seidel D, Nicolaev A, Becker C, Neurath MF. Isolation and subsequent analysis of murine lamina propria mononuclear cells from colonic tissue. Nat Protoc. 2007;2:2307–11. doi: 10.1038/nprot.2007.315. [DOI] [PubMed] [Google Scholar]
- 30.Chumanevich AA, Poudyal D, Cui X, Davis T, Wood PA, Smith CD, et al. Suppression of colitis-driven colon cancer in mice by a novel small molecule inhibitor of sphingosine kinase. Carcinogenesis. 2010;31:1787–93. doi: 10.1093/carcin/bgq158. [DOI] [PMC free article] [PubMed] [Google Scholar]
- 31.McLean MH, Murray GI, Stewart KN, Norrie G, Mayer C, Hold GL, et al. The inflammatory microenvironment in colorectal neoplasia. PLoS One. 2011;6:e15366. doi: 10.1371/journal.pone.0015366. [DOI] [PMC free article] [PubMed] [Google Scholar]
- 32.Popivanova BK, Kostadinova FI, Furuichi K, Shamekh MM, Kondo T, Wada T, et al. Blockade of a chemokine, CCL2, reduces chronic colitis-associated carcinogenesis in mice. Cancer Res. 2009;69:7884–92. doi: 10.1158/0008-5472.CAN-09-1451. [DOI] [PubMed] [Google Scholar]
- 33.Yang X, Liu F, Xu Z, Chen C, Wu X, Li G, et al. Expression of granulocyte colony stimulating factor receptor in human colorectal cancer. Postgrad Med J. 2005;81:333–7. doi: 10.1136/pgmj.2004.024646. [DOI] [PMC free article] [PubMed] [Google Scholar]
- 34.Popivanova BK, Kitamura K, Wu Y, Kondo T, Kagaya T, Kaneko S, et al. Blocking TNF-alpha in mice reduces colorectal carcinogenesis associated with chronic colitis. J Clin Invest. 2008;118:560–70. doi: 10.1172/JCI32453. [DOI] [PMC free article] [PubMed] [Google Scholar]
- 35.Olivo-Marston SE, Hursting SD, Lavigne J, Perkins SN, Maarouf RS, Yakar S, et al. Genetic reduction of circulating insulin-like growth factor-1 inhibits azoxymethane-induced colon tumorigenesis in mice. Mol Carcinog. 2009;48:1071–6. doi: 10.1002/mc.20577. [DOI] [PMC free article] [PubMed] [Google Scholar]
- 36.Metz VV, Kojro E, Rat D, Postina R. Induction of RAGE shedding by activation of G protein-coupled receptors. PLoS One. 2012;7:e41823. doi: 10.1371/journal.pone.0041823. [DOI] [PMC free article] [PubMed] [Google Scholar]
- 37.Volz HC, Laohachewin D, Seidel C, Lasitschka F, Keilbach K, Wienbrandt AR, et al. S100A8/A9 aggravates post-ischemic heart failure through activation of RAGE-dependent NF-kappaB signaling. Basic Res Cardiol. 2012;107:250. doi: 10.1007/s00395-012-0250-z. [DOI] [PubMed] [Google Scholar]
- 38.Wang L, Chang EW, Wong SC, Ong SM, Chong DQ, Ling KL. Increased Myeloid-Derived Suppressor Cells in Gastric Cancer Correlate with Cancer Stage and Plasma S100A8/A9 Proinflammatory Proteins. J Immunol. 2012 doi: 10.4049/jimmunol.1202088. [DOI] [PubMed] [Google Scholar]
- 39.Rath T, Roderfeld M, Graf J, Wagner S, Vehr AK, Dietrich C, et al. Enhanced expression of MMP-7 and MMP-13 in inflammatory bowel disease: a precancerous potential? Inflamm Bowel Dis. 2006;12:1025–35. doi: 10.1097/01.mib.0000234133.97594.04. [DOI] [PubMed] [Google Scholar]
- 40.Koller FL, Dozier EA, Nam KT, Swee M, Birkland TP, Parks WC, et al. Lack of MMP10 exacerbates experimental colitis and promotes development of inflammation-associated colonic dysplasia. Lab Invest. 2012;92:1749–59. doi: 10.1038/labinvest.2012.141. [DOI] [PMC free article] [PubMed] [Google Scholar]
- 41.Pagnini C, Corleto VD, Mangoni ML, Pilozzi E, Torre MS, Marchese R, et al. Alteration of Local Microflora and alpha-defensins Hyper-production in Colonic Adenoma Mucosa. J Clin Gastroenterol. 2011;45:602–10. doi: 10.1097/MCG.0b013e31820abf29. [DOI] [PubMed] [Google Scholar]
- 42.Wang JL, Lin YW, Chen HM, Kong X, Xiong H, Shen N, et al. Calcium prevents tumorigenesis in a mouse model of colorectal cancer. PLoS One. 2011;6:e22566. doi: 10.1371/journal.pone.0022566. [DOI] [PMC free article] [PubMed] [Google Scholar]
- 43.Chen G, Yang Y, Gao X, Dou Y, Wang H, Han G, et al. Blockade of complement activation product C5a activity using specific antibody attenuates intestinal damage in trinitrobenzene sulfonic acid induced model of colitis. Lab Invest. 2011;91:472–83. doi: 10.1038/labinvest.2010.183. [DOI] [PubMed] [Google Scholar]
- 44.Markiewski MM, DeAngelis RA, Benencia F, Ricklin-Lichtsteiner SK, Koutoulaki A, Gerard C, et al. Modulation of the antitumor immune response by complement. Nat Immunol. 2008;9:1225–35. doi: 10.1038/ni.1655. [DOI] [PMC free article] [PubMed] [Google Scholar]
- 45.Naito AT, Sumida T, Nomura S, Liu ML, Higo T, Nakagawa A, et al. Complement C1q activates canonical Wnt signaling and promotes aging-related phenotypes. Cell. 2012;149:1298–313. doi: 10.1016/j.cell.2012.03.047. [DOI] [PMC free article] [PubMed] [Google Scholar]
- 46.Burgess AW, Faux MC, Layton MJ, Ramsay RG. Wnt signaling and colon tumorigenesis--a view from the periphery. Exp Cell Res. 2011;317:2748–58. doi: 10.1016/j.yexcr.2011.08.010. [DOI] [PubMed] [Google Scholar]
- 47.Wong HL, Koh WP, Probst-Hensch NM, Van den Berg D, Yu MC, Ingles SA. Insulin-like growth factor-1 promoter polymorphisms and colorectal cancer: a functional genomics approach. Gut. 2008;57:1090–6. doi: 10.1136/gut.2007.140855. [DOI] [PMC free article] [PubMed] [Google Scholar]
Associated Data
This section collects any data citations, data availability statements, or supplementary materials included in this article.


