Abstract
Electrophoretic exclusion, a novel separations technique that differentiates species in bulk solution using the opposing forces of electrophoretic velocity and hydrodynamic flow, has been adapted to a microscale device. Proof-of-principle experiments indicate the device was able to exclude small particles (1 μm polystyrene microspheres) and fluorescent dye molecules (rhodamine 123) from the entrance of a channel. Additionally, differentiation of the rhodamine 123 and polystyrene spheres was demonstrated. The current studies focus on the direct observation of the electrophoretic exclusion behavior on a microchip.
Keywords: Capillary Electrophoresis, Electrophoretic Exclusion, Microscale, Separations
1. Introduction
Although capillary electrophoresis (CE) was established some thirty years ago [1, 2], it continues to advance both in its original capillary system and within microfluidic formats [3]. There are a number of advantages associated with CE for small volume analysis, but a challenge for both traditional and microchip CE is concentration detection limits. Most of the advantages for CE are neutralized above 100 μm characteristic dimension for the channel, limiting the size of the sample, even though this is an advantage in some applications. Given this fact, sample enrichment has been the focus of many of the advances. Recent developments in this field vary from the “standard” microchip electrophoretic separation schemes (support materials such as gels, membranes, packing, frits, etc.) to new creative strategies that exploit electrokinetic properties, including continuous sampling formats, and complete separations on-chip, all of which have been recently reviewed [3–6]. While closely related to many of these strategies, electrophoretic exclusion sets the actual separation outside the channel entrance and was first introduced as “electrophoretic focusing” in 2000 [7]. It was originally developed within the enrichment vein, but it has evolved because of the geometric freedom of microfluidic devices. The technique is now envisioned as the bridge to creating highly efficient parallel or serial (or some mixture of the two) separations.
The exclusion principles examined in this manuscript are closely related to all electrophoretic techniques where balancing forces or flow fields are invoked. In terms of development, the original exclusion work precedes many of the works noted below, but clearly, these are related in terms of comparing and contrasting the approach described here. Related advances on microchip formats aimed at enrichment include structural elements such as nanofissures [8], intersecting channels [9, 10], and valves [11]. Other methods include sample stacking techniques, such as field-amplified sample stacking [12–14], isotachophoresis (ITP) [15–20], and isoelectric focusing [21–25]. These techniques have improved separations on-chip and recent contributions have been reviewed [4, 26].
More closely related works include the application of a counterflow while performing an electrophoretic separation. Some of the initial applications of this technique were performed by the Tsuda laboratory [27] and the Jorgenson group [28]. Electrophoretic separations that take advantage of counterflow to increase separation efficiency include flow-induced electrokinetic trapping [29, 30], gradient techniques including temperature gradient focusing [31–37], electric field gradient focusing [38–43], dynamic field gradient focusing [44–48], and the use of an electro-fluid-dynamic device [49, 50]. Additional techniques that use counterflow to perform electrophoretic separations are gradient elution moving boundary electrophoresis (GEMBE) [6, 51–58] and gradient elution isotachophoresis (GEITP) [59, 60]. All counterflow techniques have successfully demonstrated separation on-chip.
As published, GEMBE and GEITP—the techniques most similar to electrophoretic exclusion—are operated as linear separation schemes that differentiate species in a confined space, typically a channel. These designs allow for only a univariate data set—one separation at a time. The separation process begins in a reservoir, outside the channel, by stacking or providing temporally-selective entry into the channel. The separation continues by introducing analytes sequentially into a, more or less, traditional capillary or channel. Once samples are introduced to a column, the species are no longer isolated from each other and the advantage of the initial bulk solution differentiation is lost, namely, the ability to operate in parallel.
Like gradient techniques, electrophoretic exclusion utilizes a hydrodynamic counterflow when performing separations [7, 61–63]. Briefly, this technique is able to differentiate species of interest in bulk solution when the hydrodynamic flow into a channel is opposed by the electrophoretic velocity of a species out of the channel. The interface itself can be considered a non-linear system. Even though there is contracting flow, the interface has a relatively constant flow field, whereas the electric field can reasonably be considered a discontinuity on the length scale of these experiments. As such, it can be integrated with other more traditional separation and detection schemes on a single microdevice. With its capacity to separate species in solution, it can be used in a highly parallel manner and therefore has the potential to achieve a separation-based array for complex sample analysis. There are further benefits to being able to differentiate species of interest in bulk solution, as opposed to inside of a channel. For instance, channel length is independent of separation efficiency and shorter channels produce much smaller footprints suited to a microdevice. More separation schemes can be included on one chip, and resolving elements of varying degree of orthogonality could also be integrated together, allowing for complex multistage separation.
To date, only one example of a true separation-based array exists [64–66]. The company formed to commercialize the technology, Protein Forest, has demonstrated the ability to successfully separate biological samples using parallel isoelectric focusing. Typically, the separated samples are then introduced to a mass spectrometer for further analysis. Although integrative, the technique is limited to resolving species by isoelectric points, where the analytes of interest (proteins and peptides) can, and do, suffer from low solubility. The Ivory group has also examined various electrokinetic techniques and provided a structured comparison [67].
Initial electrophoretic exclusion studies demonstrated the ability to concentrate polystyrene microspheres from the entrance of a 20 μm i.d. capillary [7], and was followed by theoretical modeling of the system [63]. More recently, work on a benchtop device included the separation and concentration of both small dye molecules [61] and proteins [62] near the entrance of a 75 μm i.d. capillary. Concentration enhancements of up to 1200 times in 60 s were observed when studying proteins. The current work focuses on adapting the electrophoretic exclusion technique to a microscale device by manipulating and separating dyes and polystyrene microspheres using a PDMS/glass hybrid design with fluorescence detection. This ties together the previous molecular and particle manipulations while demonstrating the technique on a microchip format. This study provides a foundation for exploration of widely varying geometries and unique capabilities including highly parallel and serial separation schemes.
2. Experimental
Design and Fabrication of Microdevice
A photograph of the device design (top-view), as well as a schematic of a single separation channel is shown (Fig. 1A). Hybrid glass/PDMS devices were used for all experiments and each device contained nine separation channels.
Figure 1.
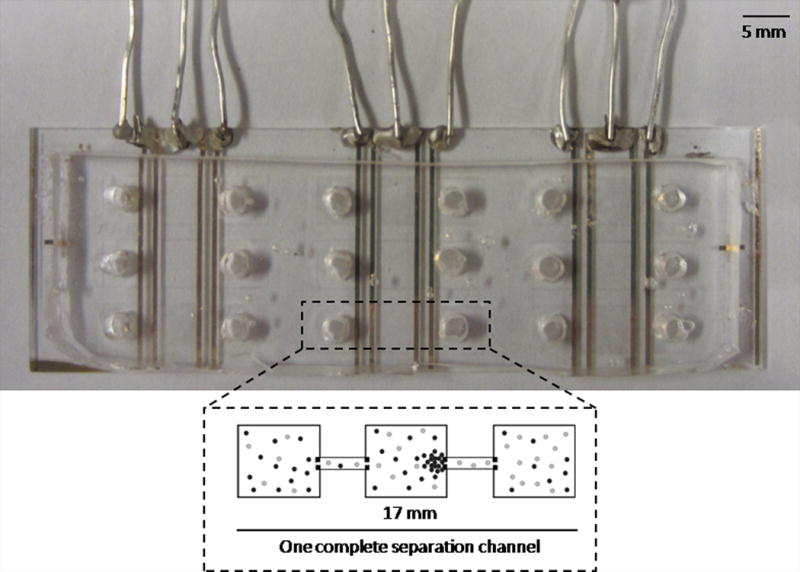
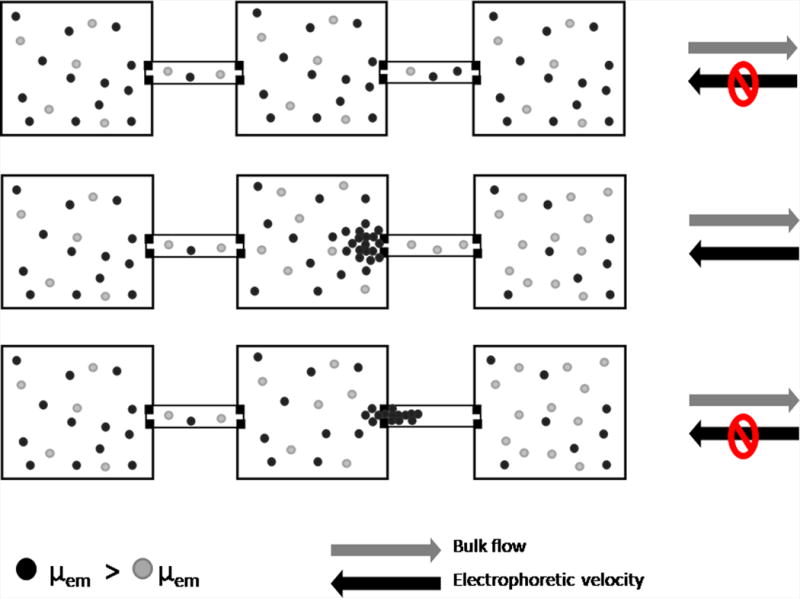
Device used for electrophoretic exclusion and schematic demonstrating exclusion principles. Fig. 1A is a photograph of the complete hybrid glass/PDMS chip with nine separation channels and a schematic of a single channel. Fig. 1B is a schematic demonstrating the principles of exclusion.
PDMS
One complete separation channel was 17 mm in length. Each separation channel contained a central reservoir connected to two end reservoirs by a short channel. Each reservoir was 5 mm × 5 mm; channels were 1 mm by 100 μm with a uniform depth throughout of 10 μm. Masks were designed in Illustrator (Adobe, San Jose, CA, USA) and were printed on transparency at a resolution of 65,000 dpi (Fine Line Imaging, Colorado Springs, CO, USA). Positive photoresist AZ 4620 was spun on a silicon wafer and then exposed with using an EVG®620 Automated UV-NIL, μ-CP System (EV Group, Austria) with the transparency mask. The PDMS microchannels were fabricated using the soft lithography technique. A 10:1 mass ratio of polymer to curing agent (Sylgard 184, Dow Corning, Midland, MI) was prepared and poured over the wafer for a thickness of approximately 5 mm and cured for 75 min. at 70 °C. The cured PDMS was removed from the wafer and holes (diameter: 3 mm) were punched in the end reservoirs of each separation channel using a quill.
Electrodes
Cr/Au electrodes were plated on microscope slides. A mask was designed in Adobe Illustrator and then printed on transparency at a resolution of 8000 dpi (Fine Line Imaging). Electrodes were 500 μm wide and the length of the microscope slide. Positive photoresist AZ 4330 was spun on microscope slides and then the slides were exposed with the EVG®620 Automated UV-NIL, μ-CP System at 50 mJ/cm2 using the mask. Two layers of metal were deposited on the glass slides using thermal evaporation with resistive heating (Edwards Auto 306, Edwards High Vacuum International, UK). A 5 nm layer of Cr was deposited onto the slides, followed by 50 nm of Au. Electric leads were attached to the electrodes with silver conductive epoxy to establish an electrical connection to the external power supply. It was designed so that each reservoir maintained a constant potential.
Materials
Aspartic acid (Sigma-Aldrich, St. Louis, MO), hydrochloric acid, rhodamine 123 (Invitrogen, Carlsbad, CA, USA), DMSO, and polystyrene microspheres (Invitrogen) were all used as received. Aspartic acid buffer was prepared to 5 mM concentration at a pH of 2.95 using 18 MΩ Milli-Q water. A 2 mM rhodamine 123 stock solution was prepared in DMSO and then diluted to 5 μM in aspartic acid buffer on the day of experiments. Polystyrene microspheres were diluted in aspartic acid buffer (1:400) and sonicated for 10 minutes before use on the day of experiments. All polystyrene microspheres were functionalized with either a carboxyl (ex/em: 580/685 nm) or sulfate (ex/em: 505/515 nm) group and were 1 μm in diameter.
Experimental Setup
The PDMS layer was bonded to the glass slide with the Cr/Au electrodes using oxygen plasma operated at 50 W for 60 s. Separation channels were filled with rhodamine 123 and/or polystyrene microspheres by pipetting the solution into one of the end reservoirs. Channels were filled by capillary action and bulk flow was induced by the height difference between the menisci of the end reservoirs. A total of 10 μL of solution was pipetted into each channel. Flow rates for all experiments were approximately 10 nL/min. Potential (0 – 40 V, 0 – 3 min) was applied using a Bertram power supply (Series 225) so that differentiation occurred near the entrance to the second channel.
Experiments were monitored with an inverted microscope with darkfield and fluorescence capabilities (IX70, Olympus, Center Valley, PA, USA) using a 100 W high-pressure Hg lamp as the light source. Light from the lamp was passed through a band-pass filter and a 4X objective to the device. Emitted light was collected through a long-pass dichromatic mirror and a band-pass filter into the camera port on the microscope. Digital images were collected using a QICAM CCD camera from Q imaging, Inc. (Surrey, British Columbia, Canada) that was connected to a personal computer running Streampix III (NorPix, Montreal, Quebec, Canada). ImageJ (NIH, Bethesda, Maryland) was used for intensity measurement analysis. Intensity measurements were performed in the channels.
COMSOL Multiphysics Modeling
Flow and electric fields in the device were modeled using COMSOL Multiphysics (California). One complete separation channel was drawn to-scale using the drawing tools in COMSOL. PDMS borders were designated as insulating material, while the interior of the channels and reservoirs were labeled as conducting materials. A potential drop of 30 V was added across the channel where the material of interest would be excluded.
3. Results and Discussion
Principles of Exclusion
Electrophoretic exclusion can be achieved when the electrophoretic velocity of a species is greater than or equal to the counteracting hydrodynamic flow. When this occurs at an entrance to a channel, certain species can be prevented from entering the channel and are thus separated from the rest of the solution. Three parameters are required for electrophoretic exclusion: hydrodynamic flow, a non-zero electrophoretic mobility of the species, and the applied electric field. For a given set of experiments, the electrophoretic mobility remains constant (based on the specific properties of analyte and buffer), so hydrodynamic flow and electric field strength can be varied to influence exclusion.
The electrophoretic exclusion process is represented schematically (Fig. 1B). To begin, the device is filled with two species with differing electrophoretic mobilities in buffer; the species depicted with gray circles has a lower electrophoretic mobility than those depicted with black circles. Initially, all species are allowed to flow freely through the system with the hydrodynamic flow (top). When a large enough electric field is applied across the length of the second channel to exclude the species with the larger electrophoretic mobility, the black species are prevented from entering the second channel and are excluded within the middle reservoir. The gray species, with the lower electrophoretic mobility, can continue to flow through the second channel (middle). This exclusion of the black species is a result of counteracting forces of hydrodynamic flow with electrophoretic velocity induced by the electric field within the channel. When the electric field is removed, all species are again allowed to flow freely through the system (bottom).
Proof of Principle Experiments with Polystyrene Microspheres and Rhodamine 123
Proof of principle experiments demonstrating the functionality of the device were performed with negatively charged polystyrene microspheres (Fig. 2A) and positively charged rhodamine 123 (Fig. 2B), in aspartic acid buffer (pH 2.95). These studies are the first examples of direct observation of electrophoretic exclusion at a channel entrance, as opposed to inferring the behavior from a flow-injection-analysis format [61, 62]. In both experiments, bulk flow was from left to right, and when potential was applied, the electrophoretic velocity of the dye and the particles was opposing the hydrodynamic flow.
Figure 2.
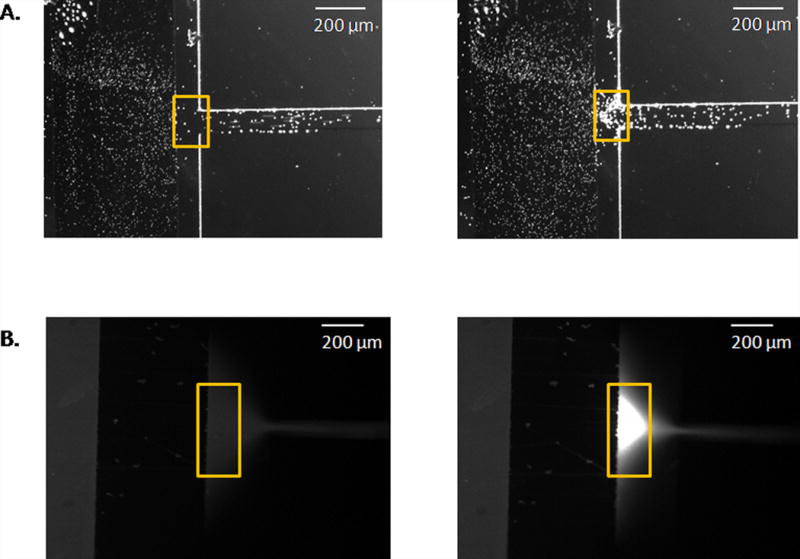
Exclusion of beads (Fig. 2A) and rhodamine 123 (Fig. 2B) from a channel entrance. In both cases, hydrodynamic flow is from left to right. Before the application of an electric field, the spheres (Fig 2A, left) and dye (Fig. 2B, left) travel with the hydrodynamic flow through the system. Once an electric field is induced, the beads (Fig. 2A, right, 300 V/cm) and dye (Fig. 2B, right, −300 V/cm) are excluded in the reservoir, near the channel entrance.
Successful exclusion was demonstrated with microspheres and dye. Before the application of the potential, beads and buffer flowed freely through the system (Fig. 2A, left). After the application of the electric field (300 V/cm) for 3 minutes, microspheres collected at the channel entrance (Fig. 2A, right). This behavior is consistent with the electrophoretic velocity of the microspheres, induced by the applied electric field, countering the hydrodynamic flow and causing the beads to be excluded from the channel and thus locally collected. Similar patterns were observed while examining the exclusion behavior of rhodamine 123. Before the application of the electric field (−300 V/cm), the dye and buffer were allowed to flow freely through the system (Fig. 2B, left image). Once the electric field (−300 V/cm) was applied for 30 s, there was an intensity increase near the channel entrance, consistent with an increased local concentration of fluorescent dye (Fig. 2B, right). This data suggests the exclusion of the dye from the channel, which resulted from the counteracting forces of hydrodynamic flow and electrophoretic velocity at the zone where the electric field is present, found at the channel entrance. In both cases, when the electric field was removed, the excluded species were again allowed to enter the channel (not shown).
The intensity from small sections of the images was quantitated as a method to assist in describing the exclusion behavior. Intensity values were assessed using ImageJ and all measurements were taken in the channel. This region was chosen for ease of viewing (the electrodes blocked the view within the reservoir area) and to avoid the highly asymmetric and nonlinear zone at the entrance. There is no radial symmetry at the entrance, as with traditional capillary entrances. Further, because the electrode only occupies the bottom of the reservoir, the resulting electric and flow fields differ dramatically in shape and location compared to a simple capillary entrance, and, as a consequence, the temporal data from the entrance was difficult to interpret. An average intensity curve for 30 s of applied electric field (−200 V/cm) is shown (Fig. 3). Initially, before potential was applied, the intensity remained steady, as dye at a constant concentration was flowing through the channel. Once potential was applied (t = 5 s), the intensity decreased as the dye was evacuated from the channel. In the presence of the electric field, dye remained excluded from the channel, within the local reservoir. After the potential was removed (t = 35 s), an increase in intensity was observed in the channel, suggesting the excluded dye had collected near the entrance and it was again allowed to flow through the system once the electric field was removed from the channel. This pattern of intensity changes was observed for all experiments where there was visual evidence of exclusion at the entrance area.
Figure 3.
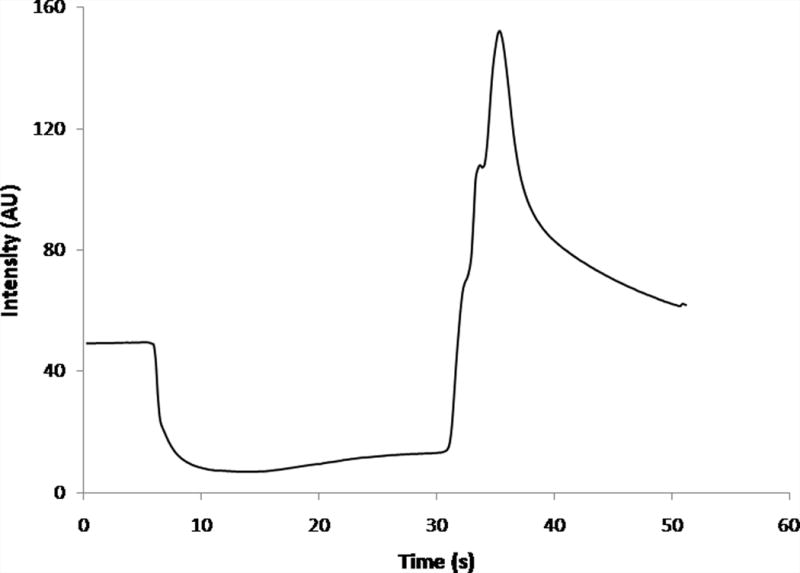
Average intensity curve for rhodamine 123 as measured in-channel for 30 s of applied potential (−300 V/cm, n = 4.
Experiments that varied the time of applied potential, as well as the electric field strength were performed to characterize the system when studying rhodamine 123. Control experiments that eliminated the electric field, hydrodynamic flow, or charged species were performed to demonstrate the necessity of all three parameters (data not shown). In the absence of one of the critical parameters, no evidence of exclusion, as determined by an increase in fluorescence intensity near the channel entrance, occurred or was below the detection limit of the methodology.
The magnitude of the electric field was varied to determine if there was an ideal strength for successful exclusion (Fig. 4A). The change in intensity, calculated as the difference in intensity between the peak intensity (after removing the electric field) and the initial intensity (before application of the electric field), was used as a method for comparing measurements between experiments. Electric field strengths greater than −300 V/cm appeared to result in no significantly greater intensity changes. Potentially, no additional amount of dye was being excluded or the additional amount of dye was not significantly greater than the amount excluded for the −300 V/cm electric field. Most likely, though, at higher field strengths, the excluded dye was pushed farther into the reservoir, where it was effectively dispersed by diffusion.
Figure 4.
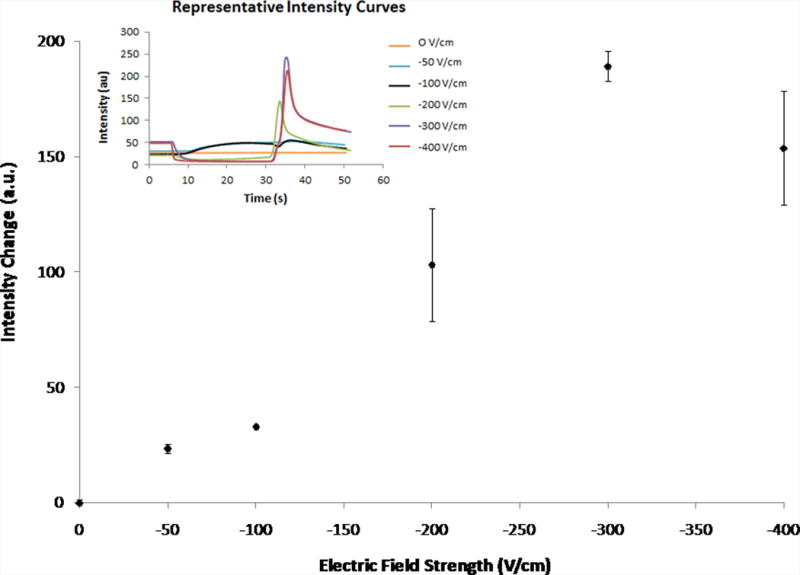
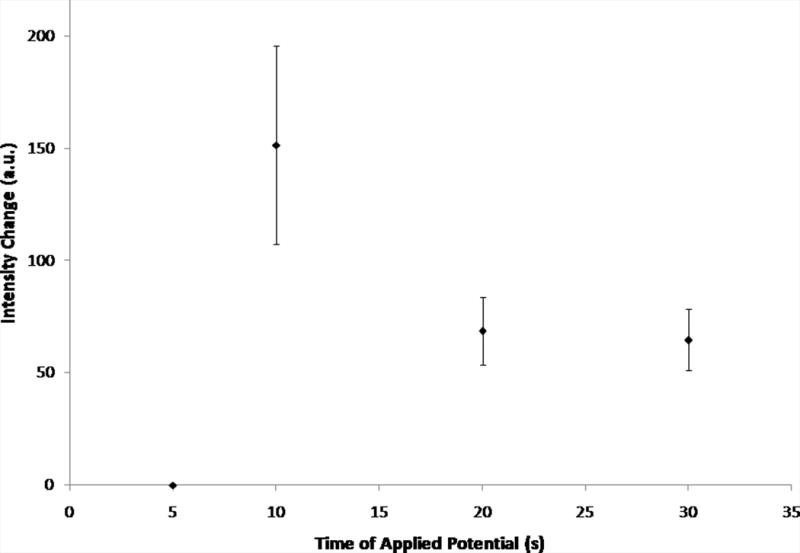
Change in intensity values for varying electric fields strengths (30 s) and various times of applied potential (−200 V/cm) as measured in-channel. Error bars represent standard deviation. Fig. 4A shows the average intensity changes for varying electric field strengths (0 V/cm – −400 V/cm, n = 3). The inset shows representative curves of the raw data. Fig. 4B shows the average intensity changes for various times of applied potential (5 s – 30 s, −200 V/cm, n = 3, exception: t = 5 s, n = 2).
Any electric field less than −200 V/cm resulted in either little or no evidence of exclusion (0 V/cm) or incomplete exclusion (−50 and −100 V/cm). This was further supported by observation of the raw data (inset). At electric fields below −200 V/cm, the curves were absent, characterized by the decrease in intensity during the application of potential, followed by the increase in intensity once the potential is removed. Presumably, this is consistent with the dye was not being excluded because the hydrodynamic counterflow was greater than the electrophoretic velocity of the rhodamine 123.
For experiments varying the time of applied potential, the electric field remained constant and intensity changes for various times of electric field application were averaged (Fig. 4B). The largest intensity change was observed for 10 s of applied potential, suggesting that at 10 s of applied potential, the most rhodamine 123 is excluded. Similar to increasing electric field strength, though, increased time of applied potential above 10 s could also mean that the excluded material was being more influenced by diffusional forces in the reservoir, resulting in less material being allowed to immediately flow down the channel once the electric field was released. At shorter times of applied potential, there was significantly less intensity change, indicating that less dye was being excluded from the channel. Intensity changes for 20 and 30 s of applied potential were not significantly different from each other, indicating that the same amount of dye was excluded for both times.
Large standard deviations were sometimes observed when averaging multiple trials (Fig. 4). As mentioned previously, the area where exclusion occurred is complex and nonlinear. The three dimensional nature of the concentration gradient about the interface was being collapsed as the collected material traveled through the channel, where one dimensional intensity measurements were performed. In addition factors such as in-channel temperature changes and surface modifications between trials can contribute to somewhat different exclusion profiles, even when the general pattern of exclusion is the same. The standard deviations are reflective of the nonlinear nature of the interface where exclusion occurs.
Separation of Rhodamine 123 and Polystyrene Beads
Experiments were performed that demonstrated the ability of the technique to differentiate fluorescent dye from polystyrene microspheres. The beads were negatively-charged at the pH of the buffer (2.95). Based on the intensity measurements performed in-channel, rhodamine 123 was successfully separated from the polystyrene beads (Fig. 5). Before the application of potential, all species were flowing through the system, with only the presence of hydrodynamic flow (Fig. 5A). After a −300 V/cm electric field was applied to the system for 30 s, the polystyrene microspheres were still moving through the system, but the fluorescence intensity decreased, consistent with rhodamine 123 being prevented from entering the channel (Fig. 5B). The electrophoretic velocity of the positively-charged dye was greater than the opposing hydrodynamic flow. The microspheres, conversely, were not excluded—as a result of their negative charge. Instead they were carried down the channel with the hydrodynamic flow and electric field. Once the potential was released, the data suggests the excluded dye flowed through the channel along with the microspheres under hydrodynamic flow (Fig. 5C). This experiment successfully demonstrated the ability of the device to separate species with differing charges and of different sizes.
Figure 5.
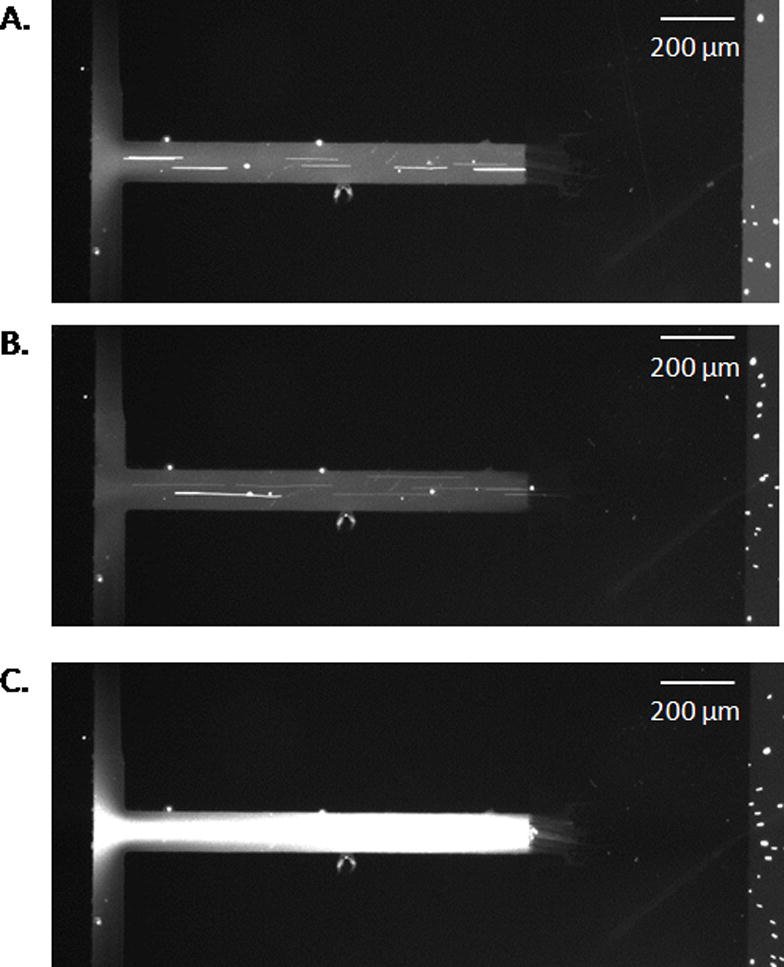
Still images taken from video demonstrating the separation of rhodamine 123 from carboxylated spheres. Fig. 5A shows the system before the initiation of the electric field, Fig. 5B shows the system after 30 s of applied potential, and Fig. 5C shows the system after the electric field is removed.
The Effects of Variable Channel and Electrode Geometry on Electrophoretic Exclusion
The same electrophoretic exclusion pattern of behavior was observed consistently between different experiments. In the presence of a large enough electric field, dye or small particles were excluded from a channel and when the potential was released, the excluded material flowed through the channel. This pattern was observed visually during experiments by watching the fluorescence intensity change (rhodamine 123) or the number of particles change (polystyrene microspheres) throughout the course of an experiment.
Differences in intensity values occurred when the electrode alignment slightly changed (images not shown). For example, intensity differences were measured, given the same experimental conditions (−200 V/cm, 30 seconds) (Fig. 4). The average for 30 s of applied electric field (−200 V/cm) reported in Fig. 4A was 103 ± 24 au while in Fig. 4B, it was reported to be 51 ± 13 au. Even when intensity values were different between days, the same exclusion patterns were observed. Comparing the results of varying the electric field strength between days still yields −200 V/cm as the minimum field strength required for exclusion of rhodamine 123. On different days, and even with different devices used on the same day, the electrode alignment was slightly different, varying by as much as ~200 μm, in part due to the PDMS shrinkage. With slight differences in the placement of the PDMS on the glass slide, the shape of the electric field about the entrance was altered. One of the factors necessary for electrophoretic exclusion is an electric field, and because the exclusion took place at the electrode and channel entrance area, any small changes in the alignment of the electrode slide and the reservoir/channel interface altered the electric field geometry, and therefore, slightly changed the details of exclusion behavior.
A COMSOL model was used to demonstrate the importance of the electrode alignment (Fig. 6). Electrode placement at the channel entrance (Fig. 6A) and a shift of 250 μm (Fig. 6B) resulted in a difference in the electric field strength and geometry at the channel entrance. When the electrode was shifted from the channel entrance, the electric field strength was less at the channel entrance/reservoir exit. Because exclusion occurred at this interface, small changes in alignment, and therefore electric field, influence the results. Studies that include characterization of the channel/electrode geometry and its effect on the electric field, and therefore exclusion, are being conducted to allow for better utilization of this separation technique on the microscale.
Figure 6.
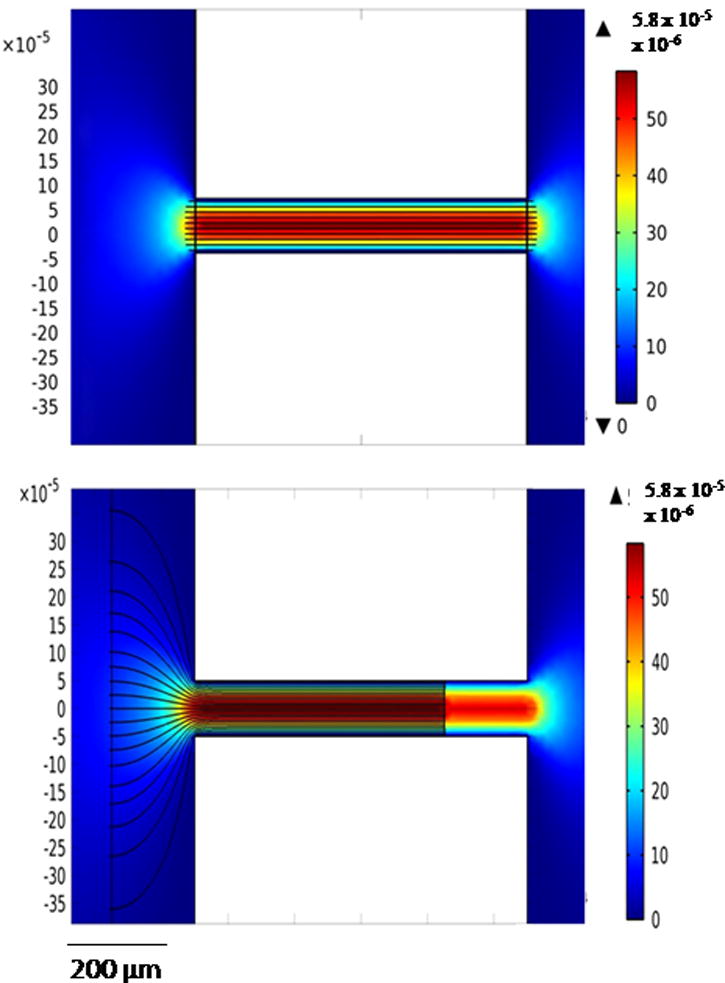
COMSOL figures demonstrating fluid velocity and electric fields for electrode placement at channel entrance (Fig. 6A) and 250 μm away from channel entrance (Fig. 6B). Surface velocity magnitude is flow field, while streamlines represent the electric field.
Future Designs: Separation-Based Array Format
This work was a continuation of the studies conducted previously on a macroscale device using absorbance detection for small molecules [5]. In the macroscale experiments, the electrode fully encircled the capillary entrance and was radially symmetric. In the microscale format, the electrode was plated on one surface of the device, the glass slide, which left three sides of the rectangular channel as insulating material. This resulted in different electric field and flow field shapes between the two designs, and as previously mentioned, this difference in field shapes affected the exclusion profile. This device is meant to bridge from the macroscale device [61, 62] to the first demonstration on a microfluidic format and, there are significant differences between the two designs.
The main advantages of exploiting miecrodevices are tight and varied control of the flow and electric fields about the entrance of the channel and the possibility to include several channels on one chip. Several designs can be envisioned where many channels and reservoirs with well-controlled flow and electric field interfaces are created to form separation-based arrays and even more complex systems.
4. Concluding Remarks
This work provides an important step towards creating complex highly efficient separations based on the exclusion principles. The direct visualization of the exclusion process on small molecules, the differentiation of particles and molecules and performance of exclusion on a microdevice format are all significant new results. The manipulation of particles and small molecule bracket the potential targets in terms of size, demonstrating a broad range of applicability. Combined with previous results using proteins, this suggests nearly all targets of typical electrophoretic separation can be addressed within a microchip format. This work sets the fundamental studies directly observing exclusion of materials at a flow-electric field interface on a microdevice that can lead to much more complex devices on small footprint formats.
Acknowledgments
This work has been supported by NIH Grants 2RO1EB004761-06 and R21EB010191-01A1.
Abbreviations
- GEITP
(Gradient Elution Isotachophoresis)
- GEMBE
(Gradient Elution Moving Boundary Electrophoresis)
- PDMS
(poly(dimethylsiloxane))
References
- 1.Jorgenson JW, Lukacs KD. Anal Chem. 1981;53:1298–1302. [Google Scholar]
- 2.Jorgenson JW, Lukacs KD. Science. 1983;222:266–272. doi: 10.1126/science.6623076. [DOI] [PubMed] [Google Scholar]
- 3.Breadmore MC, Dawod M, Quirino JP. Electrophoresis. 2011;32:127–148. doi: 10.1002/elps.201000412. [DOI] [PubMed] [Google Scholar]
- 4.Kenyon SM, Meighan MM, Hayes MA. Electrophoresis. 2011;32:482–493. doi: 10.1002/elps.201000469. [DOI] [PubMed] [Google Scholar]
- 5.Meighan MM, Staton SJR, Hayes MA. Electrophoresis. 2009;30:852–865. doi: 10.1002/elps.200800614. [DOI] [PubMed] [Google Scholar]
- 6.Vyas CA, Flanigan PM, Shackman JG. Bioanalysis. 2010;2:815–827. doi: 10.4155/bio.10.17. [DOI] [PubMed] [Google Scholar]
- 7.Polson NA, Savin DP, Hayes MA. Microcolumn Sep. 2000;12:98–106. [Google Scholar]
- 8.Yu H, Lu Y, Zhou YG, Wang FB, He FY, Xia XH. Lab Chip. 2008;8:1496–1501. doi: 10.1039/b802778a. [DOI] [PubMed] [Google Scholar]
- 9.Reschke BR, Luo H, Schiffbauer J, Edwards BF, Timperman AT. Lab Chip. 2009;9:2203–2211. doi: 10.1039/b823154k. [DOI] [PubMed] [Google Scholar]
- 10.Reschke BR, Schiffbauer J, Edwards BF, Timperman AT. Analyst. 2010;135:1351–1359. doi: 10.1039/b921914e. [DOI] [PubMed] [Google Scholar]
- 11.Kuo CH, Wang JH, Lee GB. Electrophoresis. 2009;30:3228–3235. doi: 10.1002/elps.200900112. [DOI] [PubMed] [Google Scholar]
- 12.Jacobson SC, Ramsey JM. Electrophoresis. 1995;16:481–486. doi: 10.1002/elps.1150160179. [DOI] [PubMed] [Google Scholar]
- 13.Lichtenberg J, Verpoorte E, de Rooij NF. Electrophoresis. 2001;22:258–271. doi: 10.1002/1522-2683(200101)22:2<258::AID-ELPS258>3.0.CO;2-4. [DOI] [PubMed] [Google Scholar]
- 14.Xu L, Hauser PC, Lee HK. J Chromatogr A. 2009;1216:5911–5916. doi: 10.1016/j.chroma.2009.06.026. [DOI] [PubMed] [Google Scholar]
- 15.Walker PA, Morrise MD, Burns MA, Johnson BN. Anal Chem. 1998;70:3766–3769. doi: 10.1021/ac980195h. [DOI] [PubMed] [Google Scholar]
- 16.Bahga SS, Chambers RD, Santiago JG. Anal Chem. 2011;83:6154–6162. doi: 10.1021/ac200268f. [DOI] [PubMed] [Google Scholar]
- 17.Grass B, Neyer A, Johnck M, Siepe D, Eisenbeiss F, Weber G, Hergenroder R. Sensor Actuat B-Chem. 2001;72:249–258. [Google Scholar]
- 18.Jung B, Bharadwaj R, Santiago JG. Anal Chem. 2006;78:2319–2327. doi: 10.1021/ac051659w. [DOI] [PubMed] [Google Scholar]
- 19.Persat A, Santiago JG. New J Phys. 2009;11 [Google Scholar]
- 20.Pumera M, Wang J, Opekar F, Jelinek I, Feldman J, Lowe H, Hardt S. Anal Chem. 2002;74:1968–1971. doi: 10.1021/ac011219e. [DOI] [PubMed] [Google Scholar]
- 21.Hofmann O, Che DP, Cruickshank KA, Muller UR. Anal Chem. 1999;71:678–686. doi: 10.1021/ac9806660. [DOI] [PubMed] [Google Scholar]
- 22.Cong YZ, Liang Y, Zhang LH, Zhang WB, Zhang YK. J Sep Sci. 2009;32:462–465. doi: 10.1002/jssc.200800514. [DOI] [PubMed] [Google Scholar]
- 23.Cui HC, Horiuchi K, Dutta P, Ivory CF. Anal Chem. 2005;77:1303–1309. doi: 10.1021/ac048915+. [DOI] [PubMed] [Google Scholar]
- 24.Huang XY, Ren JC. Electrophoresis. 2005;26:3595–3601. doi: 10.1002/elps.200500076. [DOI] [PubMed] [Google Scholar]
- 25.Ishibashi R, Kitamori T, Shimura K. Lab Chip. 2010;10:2628–2631. doi: 10.1039/c004176a. [DOI] [PubMed] [Google Scholar]
- 26.Gebauer P, Mala Z, Bocek P. Electrophoresis. 2011;32:83–89. doi: 10.1002/elps.201000304. [DOI] [PubMed] [Google Scholar]
- 27.Hori A, Matsumot T, Nimura Y, Ikeda M, Okada H, Tsuda T. Anal Chem. 1993;65:2882–2886. [Google Scholar]
- 28.Culbertson CT, Jorgenson JW. Anal Chem. 1994;66:955–962. [Google Scholar]
- 29.Jellema LC, Mey T, Koster S, Verpoorte E. Lab Chip. 2009;9:1914–1925. doi: 10.1039/b819054b. [DOI] [PubMed] [Google Scholar]
- 30.Jellema LJC, Markesteijn AP, Westerweek J, Verpoorte E. Anal Chem. 2010;82:4027–4035. doi: 10.1021/ac902872d. [DOI] [PubMed] [Google Scholar]
- 31.Danger G, Ross D. Electrophoresis. 2008;29:3107–3114. doi: 10.1002/elps.200700778. [DOI] [PubMed] [Google Scholar]
- 32.Ge ZW, Yang C, Tang GY. Int J Heat Mass Tran. 2010;53:2722–2731. [Google Scholar]
- 33.Lin H, Shackman JG, Ross D. Lab Chip. 2008;8:969–978. doi: 10.1039/b713749d. [DOI] [PubMed] [Google Scholar]
- 34.Munson MS, Meacham JM, Locascio LE, Ross D. Anal Chem. 2008;80:172–178. doi: 10.1021/ac701900m. [DOI] [PubMed] [Google Scholar]
- 35.Munson MS, Meacham JM, Ross D, Locascio LE. Electrophoresis. 2008;29:3456–3465. doi: 10.1002/elps.200800210. [DOI] [PubMed] [Google Scholar]
- 36.Ross D, Gaitan M, Locascio LE. Anal Chem. 2001;73:4117–4123. doi: 10.1021/ac010370l. [DOI] [PubMed] [Google Scholar]
- 37.Tang GY, Yang C. Electrophoresis. 2008;29:1006–1012. doi: 10.1002/elps.200700714. [DOI] [PubMed] [Google Scholar]
- 38.Koegler WS, Ivory CF. J Chromatogr A. 1996;726:229–236. [Google Scholar]
- 39.Humble PH, Kelly RT, Woolley AT, Tolley HD, Lee ML. Anal Chem. 2004;76:5641–5648. doi: 10.1021/ac040055+. [DOI] [PubMed] [Google Scholar]
- 40.Kelly RT, Li Y, Woolley AT. Anal Chem. 2006;78:2565–2570. doi: 10.1021/ac0521394. [DOI] [PubMed] [Google Scholar]
- 41.Sun XF, Li D, Woolley AT, Farnsworth PB, Tolley HD, Warnick KF, Lee ML. J Chromatogr A. 2009;1216:6532–6538. doi: 10.1016/j.chroma.2009.07.050. [DOI] [PubMed] [Google Scholar]
- 42.Lin SL, Tolley HD, Humble PH, Lee ML. J Chromatogr A. 2006;1125:254–262. doi: 10.1016/j.chroma.2006.05.041. [DOI] [PubMed] [Google Scholar]
- 43.Liu JK, Sun XF, Farnsworth PB, Lee ML. Anal Chem. 2006;78:4654–4662. doi: 10.1021/ac060204j. [DOI] [PubMed] [Google Scholar]
- 44.Huang Z, Ivory CF. Anal Chem. 1999;71:1628–1632. [Google Scholar]
- 45.Petsev DN, Lopez GP, Ivory CF, Sibbett SS. Lab Chip. 2005;5:587–597. doi: 10.1039/b501538c. [DOI] [PubMed] [Google Scholar]
- 46.Myers P, Bartle KD. J Chromatogr A. 2004;1044:253–258. doi: 10.1016/j.chroma.2004.04.069. [DOI] [PubMed] [Google Scholar]
- 47.Burke JM, Smith CD, Ivory CF. Electrophoresis. 2010;31:902–909. doi: 10.1002/elps.200900589. [DOI] [PMC free article] [PubMed] [Google Scholar]
- 48.Burke JM, Huang Z, Ivory CF. Anal Chem. 2009;81:8236–8243. doi: 10.1021/ac901634y. [DOI] [PMC free article] [PubMed] [Google Scholar]
- 49.Liu C, Luo Y, Fang N, Chen DDY. Anal Chem. 2011;83:1189–1192. doi: 10.1021/ac200115g. [DOI] [PubMed] [Google Scholar]
- 50.Liu C, Luo Y, Maxwell EJ, Fang N, Chen DDY. Anal Chem. 2010;82:2182–2185. doi: 10.1021/ac902938g. [DOI] [PubMed] [Google Scholar]
- 51.Ross D. Electrophoresis. 2010;31:3650–3657. doi: 10.1002/elps.201000334. [DOI] [PubMed] [Google Scholar]
- 52.Ross D. Electrophoresis. 2010;31:3658–3664. doi: 10.1002/elps.201000335. [DOI] [PubMed] [Google Scholar]
- 53.Ross D, Kralj JG. Anal Chem. 2008;80:9467–9474. doi: 10.1021/ac801597e. [DOI] [PubMed] [Google Scholar]
- 54.Ross D, Romantseva EF. Anal Chem. 2009;81:7326–7335. doi: 10.1021/ac901189y. [DOI] [PubMed] [Google Scholar]
- 55.Ross D, Shackman JG, Kralj JG, Atencia J. Lab Chip. 2010;10:3139–3148. doi: 10.1039/c004819d. [DOI] [PubMed] [Google Scholar]
- 56.Shackman JG, Munson MS, Ross D. Anal Chem. 2007;79:565–571. doi: 10.1021/ac061759h. [DOI] [PubMed] [Google Scholar]
- 57.Strychalski EA, Henry AC, Ross D. Anal Chem. 2009;81:10201–10207. doi: 10.1021/ac902075c. [DOI] [PubMed] [Google Scholar]
- 58.Strychalski EA, Henry AC, Ross D. Anal Chem. 2011;83:6316–6322. doi: 10.1021/ac2011894. [DOI] [PubMed] [Google Scholar]
- 59.Davis NI, Mamunooru M, Vyas CA, Shackman JG. Anal Chem. 2009;81:5452–5459. doi: 10.1021/ac9006182. [DOI] [PubMed] [Google Scholar]
- 60.Shackman JG, Ross D. Anal Chem. 2007;79:6641–6649. doi: 10.1021/ac070857f. [DOI] [PubMed] [Google Scholar]
- 61.Meighan MM, Keebaugh MW, Quihuis AM, Kenyon SM, Hayes MA. Electrophoresis. 2009;30:3786–3792. doi: 10.1002/elps.200900340. [DOI] [PubMed] [Google Scholar]
- 62.Meighan MM, Vasquez J, Dziubcynski, Hews S, Hayes MA. Anal Chem. 2011;83:368–373. doi: 10.1021/ac1025495. [DOI] [PubMed] [Google Scholar]
- 63.Pacheco JR, Chen KP, Hayes MA. Electrophoresis. 2007;28:1027–1035. doi: 10.1002/elps.200600462. [DOI] [PubMed] [Google Scholar]
- 64.Zilberstein GV, Baskin EM, Bukshpan S. Electrophoresis. 2003;24:3735–3744. doi: 10.1002/elps.200305663. [DOI] [PubMed] [Google Scholar]
- 65.Zilberstein GV, Baskin EM, Bukshpan S, Korol LE. Electrophoresis. 2004;25:3643–3651. doi: 10.1002/elps.200406117. [DOI] [PubMed] [Google Scholar]
- 66.Zilberstein G, Korol L, Bukshpan S, Baskin E. Proteomics. 2004;4:2533–2540. doi: 10.1002/pmic.200300794. [DOI] [PubMed] [Google Scholar]
- 67.Ivory CF. Electrophoresis. 2007;28:15–25. doi: 10.1002/elps.200600623. [DOI] [PubMed] [Google Scholar]


