Abstract
We demonstrate a digital sensing platform, termed Albumin Tester, running on a smart-phone that images and automatically analyses fluorescent assays confined within disposable test tubes for sensitive and specific detection of albumin in urine. This light-weight and compact Albumin Tester attachment, weighing approximately 148 grams, is mechanically installed on the existing camera unit of a smart-phone, where test and control tubes are inserted from the side and are excited by a battery powered laser diode. This excitation beam, after probing the sample of interest located within the test tube, interacts with the control tube, and the resulting fluorescent emission is collected perpendicular to the direction of the excitation, where the cellphone camera captures the images of the fluorescent tubes through the use of an external plastic lens that is inserted between the sample and the camera lens. The acquired fluorescent images of the sample and control tubes are digitally processed within one second through an Android application running on the same cellphone for quantification of albumin concentration in urine specimen of interest. Using a simple sample preparation approach which takes ~ 5 minutes per test (including the incubation time), we experimentally confirmed the detection limit of our sensing platform as 5–10 μg/mL (which is more than 3 times lower than clinically accepted normal range) in buffer as well as urine samples. This automated albumin testing tool running on a smart-phone could be useful for early diagnosis of kidney disease or for monitoring of chronic patients, especially those suffering from diabetes, hypertension, and/or cardiovascular diseases.
Introduction
Chronic kidney disease has become a major health issue worldwide, causing millions of deaths every year1–3. For instance, in the United States there is a rising incidence of kidney related problems, affecting as many as 11% of adults4–6. Kidney diseases, in addition to possibly leading to kidney failure, might also cause complications such as anemia, metabolic bone disease, as well as cardiovascular diseases7. There is growing indication that some of these adverse outcomes can be prevented or delayed by early detection and treatment, especially for people with increased risk factors including hypertension, hyperlipidemia and diabetes8,9. Early stages of kidney disease can be diagnosed using various tests performed on e.g., blood pressure10, serum creatinine11, as well as urine albumin12. In fact, the latter, i.e., albumin testing, is now routinely ordered within a typical panel of tests performed in urine for general health screening13–14. Albumin is a serum protein that would normally be present at high concentrations in human blood (i.e., >30 mg/mL)15; however, it should not exist in urine more than a clinically normal threshold value of 30 μg/mL16. In the case of kidney damage, on the other hand, small amounts of albumin leaks into urine, leading to a condition defined as microalbuminuria17 that typically exhibits albumin levels of e.g., >30–300 μg/mL in urine. Thus, microalbuminuria testing is typically employed as an initial screening tool for kidney disease, where the urinary albumin concentration is measured in various specimens, including for example in a spot morning urine sample18 or in a urine specimen that is accumulated within a 24-hour window19. Because the albumin levels in blood and urine fluctuate based on various factors such as metabolism and dietary variations of the patient, timed urine collection or testing methods should be performed every few hours to provide reliable estimates for urinary albumin concentration20,21. These repetitive clinical measurements are typically achieved through the use of bulky and costly bench-top urine analyzers, limiting the testing and diagnosis of microalbuminuria to laboratory settings, which also requires successive patient visits to central clinics or hospitals. To address this issue of frequent and routine urine testing, there has been considerable effort to develop compact and field-portable diagnostics tools22–27 that can measure albumin concentration in urine samples.
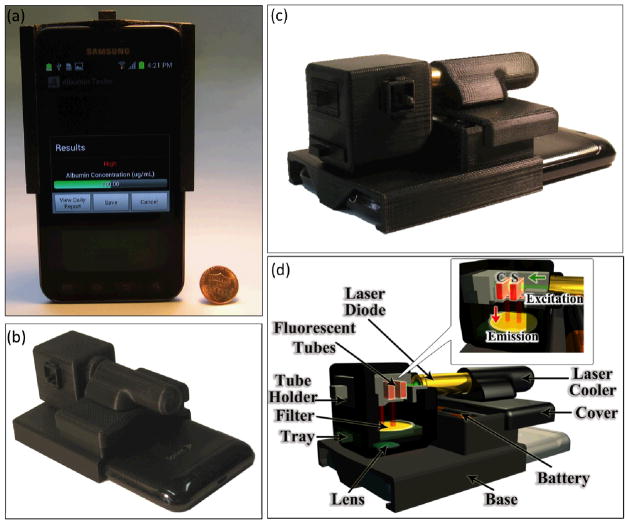
To provide an alternative solution to this important need, here we demonstrate a smart-phone based digital sensing platform, termed as Albumin Tester, which can measure and quantify the albumin concentration in urine samples through the use of a sensitive and specific fluorescent assay performed in disposable test tubes. This Albumin Tester platform (see Fig. 1), weighing 148 grams, analyses the fluorescent signal arising from both control and test tubes using an opto-mechanical attachment installed on the existing camera unit of the smart-phone. This light-weight and compact add-on module is composed of a 3D printed housing integrated with a compact laser diode, two AA batteries, a plastic lens, and an emission interference filter. After partially filling the test tube and completely filling the control tube with a dye solution that is sensitive to albumin, these tubes are inserted to the Albumin Tester platform from the side, where a low-volume syringe is used to inject a small volume (e.g., 25 μL) of urine sample into the test tube through a PDMS based injection port located on the 3D printed housing (see Fig. 2). Together with the excitation of the test and control tubes using a single laser beam, the fluorescent emission emerging from the tube cross-sections is collected through a simple lens and is imaged onto the cellphone camera. These acquired fluorescent images of the tubes are then digitally processed within 1 second through a custom-developed Android application (see Fig. 3) running on the same smart-phone for quantification of albumin concentration in urine specimens. We experimentally confirmed the detection limit of our Albumin Tester as 5–10 μg/mL using buffer and synthetic urine samples, which is more than 3-fold lower than clinically normal range of urinary albumin. We believe that this automated and field-portable albumin detection platform running on cellphones could be rather helpful for early diagnosis of kidney disease or for routine monitoring of high-risk patients suffering from diabetes, hypertension, and/or cardiovascular diseases.
Fig. 1.
(a–c) Photographs of the Albumin Tester installed on a smart-phone, weighing 148 grams, are shown from different views. (d) Schematic diagram of the lightweight smart-phone attachment of the Albumin Tester is illustrated, where the test and control tubes are inserted from the side and are pumped by a battery powered laser diode. After probing the sample of interest located within the test tube, this excitation beam interacts with the control tube. The fluorescent emission is then collected perpendicular to the direction of excitation, where the cellphone camera captures the images of the fluorescent tubes through the use of a simple plastic lens that is inserted between the tubes and the cellphone camera lens. These acquired raw fluorescent images of the sample and control tubes are digitally processed within 1 s using a custom-developed Android application running on the same smart-phone for detection and quantification of albumin concentration in the urine specimen.
Fig. 2.
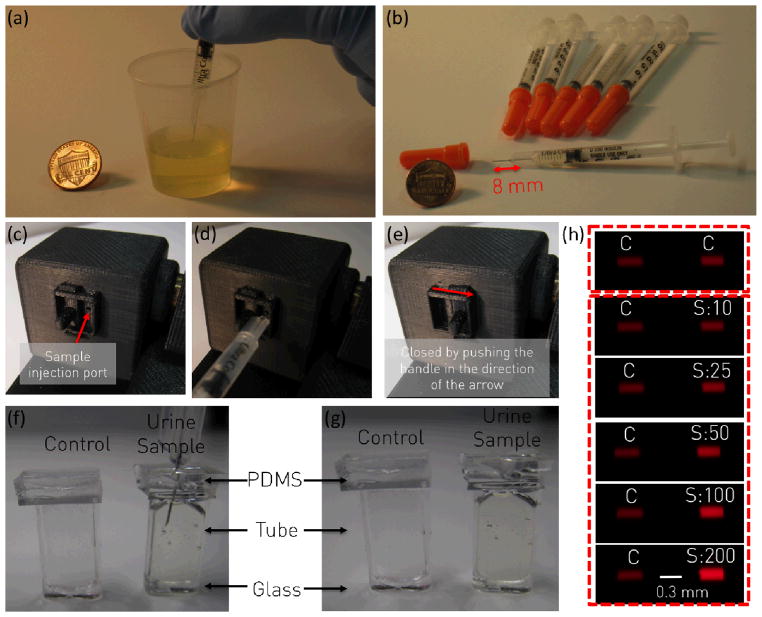
User procedures for the Albumin Tester are explained. (a) Urine specimen of interest is loaded into a disposable container. (b–e) A small volume (~25 μL) of urine specimen is transferred into the prefilled test tube through a PDMS based injection port located on the cellphone attachment by utilizing a mini-syringe, where the needle of the syringe penetrates through the PDMS facet of the custom-fabricated test tube for delivery of urine. (f–g) After completing the urine delivery to the tube, the needle is gently removed from the PDMS slab, which will then self-heal to avoid urine leakage from the tube. (e) A custom-designed handle is pushed to close the port to avoid ambient light leakage. User then runs the Android application to capture fluorescent images (C: Control and S: Sample/Test) of the tubes as represented in (h) for the quantification of urinary albumin concentration.
Fig. 3.
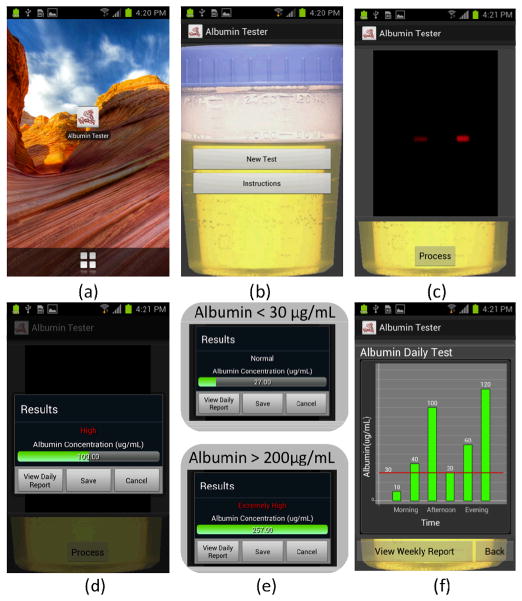
Screenshots of the Albumin Tester application running on an Android phone are illustrated. (a–b) After running the Albumin Tester application, two options are provided: New Test or Instructions. The selection of Instructions provides a summary of the user protocol for albumin testing. (c) The selection of New Test powers up the camera of the smart-phone to capture the fluorescent images of both the sample and control tubes by touching Process button displayed on the screen. (d–e) These acquired images are then rapidly processed to determine the concentration of the albumin in the urine sample of interest. A concentration range of 1 to 30 μg/mL is referred to as “Normal”, 30 to 200 μg/mL as “High”, and >200 μg/mL as “Extremely High”. If desired, the “View Daily Report” can be selected to display the summary of the daily albumin test results. Further, a weekly report can also be displayed by touching the “View Weekly Report” button located on the screen.
Methods
Overview of the Albumin Tester platform
In this personalized albumin testing platform, we devised a digital fluorescent tube reader integrated with a smart-phone application, which calculates albumin-based fluorescent signal enhancement in the test tube compared to the control tube, which is then converted into albumin concentration values (in μg/mL).
Hardware design
Our read-out module was installed on an Android phone (Samsung Galaxy S II, 1.2 GHz Dual Core ARM Cortex-A9 Processor, 8MP Camera with F/2.65 aperture and 4 mm focal length lens). The mechanical structure of this fluorescent tube reader can also be customized to fit onto other smart-phones such as various Android devices or an iPhone. The main frame of this opto-mechanical attachment was designed using Inventor software (Autodesk) and created using a 3D printer (Elite, Dimension). In our prototype, we employed a compact and a cost-effective laser diode (Instapark, DGM512-D001, 532 nm center wavelength, 5mW output power, cost: $20) to excite the fluorescent specimen located within disposable test and control tubes (each with dimensions of w1 × w2 × h: 6 × 2 × 15 mm). We should emphasize that the weakly scattered excitation light is also rejected using an interference filter (Chroma, D630/60, cost: $150) that is inserted into the optical detection path. Only the fluorescent emission through the side facet (w2 ~ 2 mm) of each tube of interest is then collected via two rectangular apertures (i.e., 2 mm × 2 mm), where the cellphone camera captures the fluorescent images of these tube facets through a plano-convex lens (Edmund Optics, NT65-576, focal length ~ 28 mm, price: $20) that is placed in between the interference filter and the cellphone. Together with this add-on lens and the built-in lens of the cellphone camera, the presented fluorescent imaging geometry provides an optical demagnification factor of 28/4 = 7 fold, which is designed to specifically fit both the test and control tubes into the active area of the cellphone CMOS imaging chip.
Test procedures
Urine specimen of interest is placed into a disposable container (see Fig. 2a). Using a mini-syringe (DrsFosterSmith, 9N-50255, 8 mm short needle) shown in Fig. 2b, a small volume (~25 μL) of urine is transferred into the prefilled test tube (see sample preparation related next subsection for details) through a PDMS based injection port located on the cellphone attachment (see Fig. 2b–e). In this process, the needle of the syringe penetrates through the PDMS facet of the test tube for delivery of the urine. Once injection of the urine sample is completed, the needle is gently removed from the PDMS slab, which is then self-healed to avoid dripping of urine from tubes (see Fig. 2f–g). To circumvent ambient light leakage through the injection hole, a custom-designed handle is pushed to close the port avoiding external light entry into our sensor (Fig. 2e). After insertion of the sample into the Albumin Tester, the user runs our custom-designed Android application (see Fig. 3) to capture fluorescent images of the test and control tubes as represented in Fig. 2h for automated quantification of albumin concentration in the urine sample of interest.
Sample Preparation
In our Albumin Tester platform we utilized a fluorescence-based detection kit (Albumin blue 580 fluorescence assay, Active Motif, 15002), which is an albumin specific assay that does not exhibit cross-interference from other complex urine proteins or lipids28–30. This fluorescence assay provides lyophilized dye reagents and buffers (A and B) for calibration and testing purposes. To start the assay preparation, the lyophilized dye reagent is suspended in 1 mL of isopropanol to create a dye reagent stock solution. This dye stock sample is then diluted using Buffer A with 1:50 ratio, producing a Dye Reagent Working Solution. Next, lyophilized human serum albumin (HSA) is suspended in 1 mL of Buffer B to make a calibration sample with 0.2 mg/mL albumin concentration, which can be further diluted with Buffer B to create calibration samples with various concentrations. Our control tubes are filled with a small volume (i.e., 150 μL) of Dye Reagent Working Solution mixed with 25 μL of buffer solution (i.e., no albumin). Our test tubes are also filled with ~150 μL of Dye Reagent Working Solution, where ~25 μL of urine sample of interest (to be tested) is injected through a syringe to the same tube. In our proof-of-concept experiments, we utilized synthetic urine samples (Quick Fix Plus Synthetic Urine, Spectrum Labs) to test our detection limits. Following ~5 minutes of incubation for both the control and test tubes, the resultant fluorescent signal of each tube is imaged in parallel using our Albumin Tester platform.
Test Tube design
We custom-fabricated the sample tubes employed in our platform by dicing a rectangular borosilicate glass cell (Vitrocom, R0206, dimensions: w1: 6 mm × w2: 2 mm × h: 300 mm) into 15 mm long segments. We then bonded a glass piece to the bottom facet and glued a PDMS piece to the top of each tube (see Figs. 2f–g), creating entirely isolated volumes for testing urine samples.
Android Application
We developed an Android application (see Fig. 3) running on the same smart-phone, which operates as follows:
-
(a)
The user runs the Albumin Tester application by clicking on the icon located on the main menu.
-
(b)
The new window provides two options: either New Test or Instructions. While the selection of Instructions lists the sample preparation protocol for albumin testing, the selection of New Test starts the imaging of the fluorescent tubes by powering up the camera of the smart-phone (see Fig. 3c).
-
(c)
The fluorescent image of the sample/test and control tubes is then captured by clicking on the Process button located on the screen of the smart-phone.
-
(d–e)
This acquired cellphone image is then processed within one second (see the next subsection on digital processing for details) to determine the albumin concentration in the urine sample of interest. Three different types of labels (i.e., “Normal”, “High”, and “Extremely High”) are displayed for results that fall within a range of 1 to 30 μg/mL, 30 to 200 μg/mL, and >200 μg/mL, respectively (see Figs. 3d–e).
-
(f)
If desired, the “View Daily Report” can be selected as shown in Fig. 3f to display a summary of the daily albumin test results, presenting the patient’s albumin level fluctuations throughout the day. A weekly report can also be displayed by clicking on the “View Weekly Report” button positioned on the cellphone screen.
Digital processing of fluorescent images
The acquired fluorescent images of both the sample and control tubes are first converted into binary mask images to pinpoint their centroids. A common area, covering a rectangular frame (i.e., 200 × 80 pixels) around each one of these centroids is then used to calculate a fluorescent signal per tube (control vs. test). The fluorescent signal of the sample tube is divided by an excitation normalization factor (see the next subsection for details), and the resulting value (Itest) is further divided by the signal calculated for the control tube (Icontrol) to determine the Relative Fluorescence Unit (RFU), i.e.,
Finally, this RFU value is plugged into a linear equation ([RFU]=0.00591*[Conc.]+1.00844) created by our urine calibration experiments (refer to Fig. 5 and the Results section for details) providing the final concentration [Conc.] of albumin (in μg/mL) measured within the urine sample of interest.
Fig. 5.
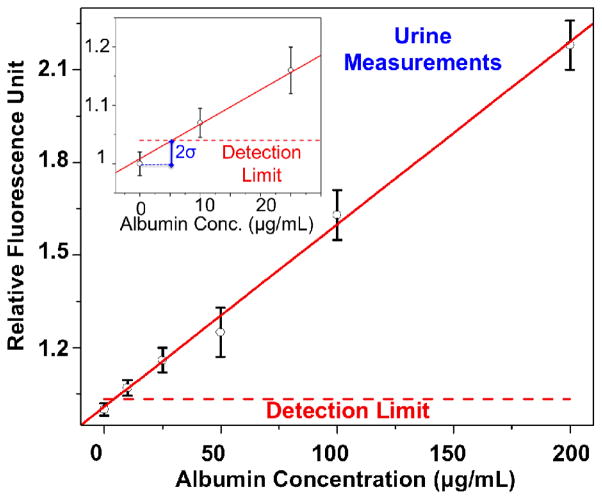
Dose-response curve for spiked albumin proteins in urine through the use of Albumin Tester is demonstrated. This titration curve, covering 3 different measurements performed on 6 different calibration samples (0, 10, 25, 50, 100, and 200 μg/mL), provides a linear-fit equation of [RFU]=0.00591*[Conc.]+1.00844 with R=0.99. Compared to the buffer measurements presented in Fig. 4, we achieved a similar detection limit of <10 μg/mL in urine samples.
Excitation power normalization
In our albumin detection platform, we utilize a single laser beam to simultaneously excite both the control and test tubes. While the optical properties (e.g., reflection, absorption) of the tubes are the same for both the sample and control, the laser excitation probes the sample tube first and subsequently excites the control tube. Since the second tube (i.e., the control) located in the optical path might get relatively less power due to diffraction, scattering and absorption occurring within the first tube (i.e., the test), we performed calibration measurements through our Albumin Tester using the same sample in both the test and control tubes. By averaging the RFU values of these experiments, the effective excitation power illuminating the test tube was determined to be slightly higher, i.e., by 1.18 fold, compared to the control tube. To take this non-even excitation factor into account, we divide the test tube signal by a normalization factor of 1.18.
Another advantage of using simultaneous laser excitation for both the sample and the test tubes is that any random fluctuations of the laser output would affect both the control signal and the test signal in the same way, providing a robust means to calculate the RFU values and quantify the albumin concentration within the urine sample of interest.
Results and Discussion
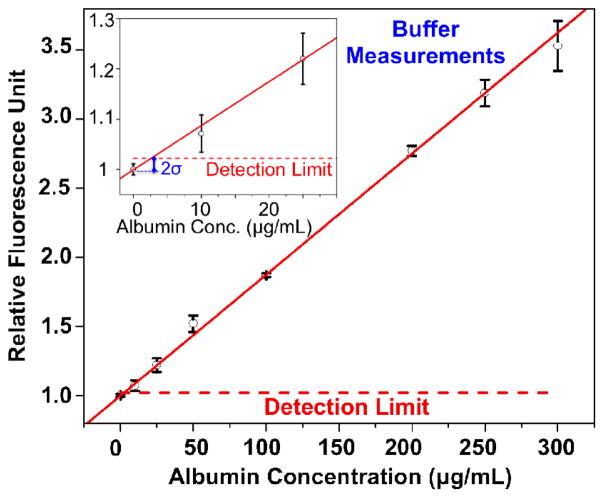
To evaluate our albumin detection platform, we initially performed experiments with spiked albumin proteins in buffer solution at various concentrations spanning a wide range: 0 μg/mL, 10 μg/mL, 25 μg/mL, 50 μg/mL, 100 μg/mL, 200 μg/mL, 250 μg/mL, and 300 μg/mL. Conducting 3 different tests for each concentration of albumin, we plotted a dose-response curve (Fig. 4) demonstrating the linear relationship between the spiked concentration of albumin in buffer and the corresponding fluorescent signal levels (i.e., RFU values) measured by our Albumin Tester platform, which provides a linear-fit equation [RFU]=0.00876*[Conc.]+0.9992, with R=0.99. These experiments also demonstrate an albumin detection limit (in buffer) of ~ 5–10 μg/mL, where we added the mean value of the control measurements to twice of the control standard deviation.
Fig. 4.
Dose-response curve for spiked albumin proteins in buffer solution through the use of Albumin Tester is demonstrated. Based on 3 different tests performed for 8 different calibration samples (0, 10, 25, 50, 100, 200, 250, and 300 μg/mL), this response curve demonstrates the linear relationship between the spiked concentration of albumin in buffer and the corresponding fluorescent signal enhancement. Our detection limit in buffer samples is <10 μg/mL, defined as twice the standard deviation added to the control tube average signal level. The error bars represent the standard deviations of the RFU values for 3 different measurements performed for each concentration.
Next, we performed measurements in urine samples, where purified HSA proteins were spiked at different concentrations, ranging from 0 μg/mL to 200 μg/mL. The results of these titration experiments in urine samples are shown in Fig. 5, where a similar albumin detection limit of <10 μg/mL was obtained, very well matching to the buffer measurements presented in Fig. 4. This urine sample calibration process yields a linear-fit equation to our measurements that can be used to determine the albumin concentration of unknown urine samples, i.e., [RFU] = 0.00591*[Conc.]+1.00844, with R=0.99.
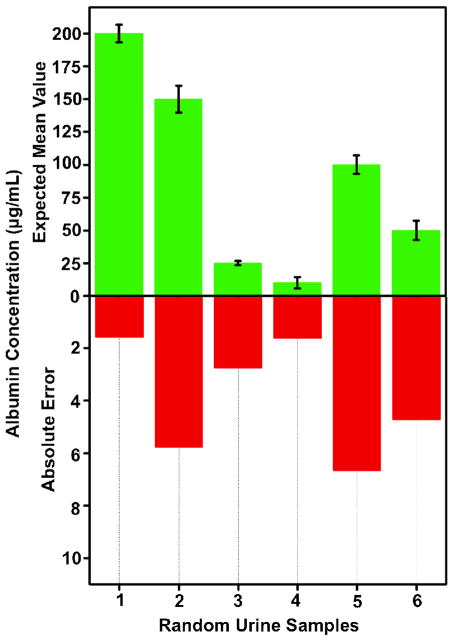
To further evaluate the performance of our platform, we tested random urine samples and quantified the urinary albumin concentration in each sample based on the calibration curve presented in Fig. 5. For these experiments, we measured 3 different samples for each randomly selected concentration level (i.e., 200, 150, 25, 10, 100 and 50 μg/mL). The results of these random blind experiments are summarized in Fig. 6, which demonstrates that the albumin concentration of each unknown urine sample is measured with an absolute error of <7 μg/mL. Together with a detection limit of <10 μg/mL in urine, these results and concentration ranges provide a decent fit to clinical needs since a urinary albumin concentration of 30 μg/mL is considered to be normal.
Fig. 6.
Random urine sample testing is demonstrated through the use of the Albumin Tester, where the urinary albumin concentration was quantified based on the calibration curve presented in Fig. 5. For each measurement point, 3 different samples were used. These blind experiments performed in synthetic urine samples demonstrate an absolute error of <7 μg/mL for urinary albumin concentration measurements. The error bars represent the standard deviations calculated for 3 different measurements performed for each concentration.
We should emphasize that our Albumin Tester platform is currently designed to detect and quantify only one kind of biomarker in urine samples. However, we can also multiplex different biomarker measurements (for example Creatinine) on the same opto-mechanical attachment to the smart-phone or through interchangeable attachments by using various colorimetric assays31. Measuring both Creatinine and Albumin in the same urine specimen could be rather valuable in determining the Albumin to Creatinine Ratio (ACR)32–34 for complementary testing of kidney related symptoms.
We should also note that in this work we utilized spiked synthetic urine samples to validate the albumin detection capability of our cellphone based telemedicine platform in complex urine matrix. As a matter of fact, the same synthetic urine specimen that we used in our work has been frequently used in the literature35–36 to mimic the complex structure of human urine, where the sensitivity of albumin or creatinine detection results exhibited no significant differences between the real urine and synthetic urine samples.
Furthermore, immunoreactive methods can detect only complete albumin molecules recognized by antibodies; however peptide fragments of albumin can be assessed by dye based tests and specific spectrophotometry, and therefore our dye binding assay (based on albumin blue 580) can detect not only intact albumin but also albumin fragments toward quantitative detection of urinary albumin.37 In fact, the same fluorescent assay that we used in our work was already tested in clinical urine samples and compared against traditional testing methods (e.g., nephelometry or turbidity), agreeing well with others.30,38 Therefore, the dye binding fluorescent assay used in our cellphone based detection platform has been shown to be robust toward clinical albumin detection and holds significant promise especially for home- based testing of patients using our reported telemedicine platform.
Finally, the use of smart-phone hardware and software for digital reading and quantification of biomarkers in bodily fluids is rather important since it enables potential penetration of advanced micro-analysis, sensing and diagnostics technologies39–52 to even remote and resource limited settings through wide-scale deployment and global use of cellphones, especially considering the fact that we have approximately 7 billion cellphone subscribers in the world53. In this regard, the increasing trend in smart-phone penetration world-wide (expected to reach for example ~40% by the end of 2014)53 is rather important since it will provide a ubiquitous platform for several innovative designs toward biomedical micro-analysis of various specimen. In addition to these, another major advantage of cellphone based testing, sensing and diagnostics is that the users can upload their measurement results to secure central servers to share information with their doctors, creating valuable opportunities for telemedicine and its practice in developing as well as developed countries.54–55
Despite such advantages, rapidly changing nature of cellphone hardware and software as well as hand-set variations from wireless carrier to carrier present certain challenges for clinical translation and commercialization of cellphone based biomedical measurement and diagnostic tools. Such challenges could potentially be addressed by tapping into second-hand and/or refurbished cellphone market, and can even be turned into new business opportunities to serve and help regulate the growing demand of cellphone enabled measurement and diagnostics tools.
Conclusion
We demonstrated a personalized digital albumin detection platform (termed as Albumin Tester), which employs fluorescent assays performed in disposable test tubes and smart-phone based digital imaging and automated analysis. Such a smart-phone based urinary albumin testing tool, combined with a simple sample preparation step, could be valuable for early screening of kidney disease or for monitoring of chronic patients suffering from diabetes, hypertension, and/or cardiovascular diseases.
Acknowledgments
Ozcan Research Group gratefully acknowledges the support of the Presidential Early Career Award for Scientists and Engineers (PECASE), Army Research Office (ARO) Life Sciences Division, ARO Young Investigator Award, National Science Foundation (NSF) CAREER Award, NSF CBET Biophotonics Program, Office of Naval Research (ONR) Young Investigator Award and National Institutes of Health (NIH) Director’s New Innovator Award DP2OD006427 from the Office of the Director, National Institutes of Health.
References
- 1.Levey AS, Atkins R, Coresh J, Cohen EP, Collins AJ, Eckardt K-U, Nahas ME, Jaber BL, Jadoul M, Levin A, Powe NR, Rossert J, Wheeler DC, Lameire N, Eknoyan G. Kidney Int. 2007;72:247–259. doi: 10.1038/sj.ki.5002343. [DOI] [PubMed] [Google Scholar]
- 2.Eckardt KU, Kasiske BL. Nat Rev Nephrol. 2009;5:650–657. doi: 10.1038/nrneph.2009.153. [DOI] [PubMed] [Google Scholar]
- 3.Couser WG, Remuzzi G, Mendis S, Tonelli M. Kidney Int. 2011;80:1258–1270. doi: 10.1038/ki.2011.368. [DOI] [PubMed] [Google Scholar]
- 4.Coresh J, Astor BC, Greene T, Eknoyan G, Levey AS. Am J Kidney Dis Off J Natl Kidney Found. 2003;41:1–12. doi: 10.1053/ajkd.2003.50007. [DOI] [PubMed] [Google Scholar]
- 5.Coresh SEJ. JAMA. 2007;298:2038–2047. doi: 10.1001/jama.298.17.2038. [DOI] [PubMed] [Google Scholar]
- 6.Tonelli M, Wiebe N, Culleton B, House A, Rabbat C, Fok M, McAlister F, Garg AX. J Am Soc Nephrol. 2006;17:2034–2047. doi: 10.1681/ASN.2005101085. [DOI] [PubMed] [Google Scholar]
- 7.Thomas R, Kanso A, Sedor JR. Prim Care. 2008;35:329–344. vii. doi: 10.1016/j.pop.2008.01.008. [DOI] [PMC free article] [PubMed] [Google Scholar]
- 8.Hogg RJ, Furth S, Lemley KV, Portman R, Schwartz GJ, Coresh J, Balk E, Lau J, Levin A, Kausz AT, Eknoyan G, Levey AS. Pediatrics. 2003;111:1416–1421. doi: 10.1542/peds.111.6.1416. [DOI] [PubMed] [Google Scholar]
- 9.Levey AS, Andreoli SP, DuBose T, Provenzano R, Collins AJ. Am J Nephrol. 2007;27:108–112. doi: 10.1159/000099801. [DOI] [PubMed] [Google Scholar]
- 10.Jafar TH, Stark PC, Schmid CH, Landa M, Maschio G, de Jong PE, de Zeeuw D, Shahinfar S, Toto R, Levey AS. Ann Intern Med. 2003;139:244–252. doi: 10.7326/0003-4819-139-4-200308190-00006. [DOI] [PubMed] [Google Scholar]
- 11.Rule AD, Larson TS, Bergstralh EJ, Slezak JM, Jacobsen SJ, Cosio FG. Ann Intern Med. 2004;141:929–937. doi: 10.7326/0003-4819-141-12-200412210-00009. [DOI] [PubMed] [Google Scholar]
- 12.Kramer H, Molitch ME. Dia Care. 2005;28:1813–1816. doi: 10.2337/diacare.28.7.1813. [DOI] [PubMed] [Google Scholar]
- 13.Keane WF, Eknoyan G. Am J Kidney Dis Off J Natl Kidney Found. 1999;33:1004–1010. doi: 10.1016/s0272-6386(99)70442-7. [DOI] [PubMed] [Google Scholar]
- 14.Gansevoort RT, Brinkman J, Bakker SJL, Jong PED, de Zeeuw D. Am J Epidemiol. 2006;164:725–727. doi: 10.1093/aje/kwj271. [DOI] [PubMed] [Google Scholar]
- 15.Corti GJM. JAMA. 1994;272:1036–1042. [PubMed] [Google Scholar]
- 16.Jones SL, Close CF, Mattock MB, Jarrett RJ, Keen H, Viberti GC. BMJ. 1989;298:487–490. doi: 10.1136/bmj.298.6672.487. [DOI] [PMC free article] [PubMed] [Google Scholar]
- 17.Ce M. N Engl J Med. 1984;310:356–360. doi: 10.1056/NEJM198402093100605. [DOI] [PubMed] [Google Scholar]
- 18.Ginsberg JM. N Engl J Med. 1983;309:1543–1546. doi: 10.1056/NEJM198312223092503. [DOI] [PubMed] [Google Scholar]
- 19.Ruggenenti P, Gaspari F, Perna A, Remuzzi G. BMJ. 1998;316:504–509. doi: 10.1136/bmj.316.7130.504. [DOI] [PMC free article] [PubMed] [Google Scholar]
- 20.Rowe DJ, Bagga H, Betts PB. Br Med J Clin Res Ed. 1985;291:693–694. doi: 10.1136/bmj.291.6497.693. [DOI] [PMC free article] [PubMed] [Google Scholar]
- 21.Jarrett RJ, Verma NP, Keen H. Clin Chim Acta. 1976;71:55–59. doi: 10.1016/0009-8981(76)90274-6. [DOI] [PubMed] [Google Scholar]
- 22.Hofmann O, Wang X, deMello JC, Bradley DDC, deMello AJ. Lab Chip. 2005;5:863–868. doi: 10.1039/b504551g. [DOI] [PubMed] [Google Scholar]
- 23.Laiwattanapaisal W, Songjaroen T, Maturos T, Lomas T, Sappat A, Tuantranont A. Sensors. 2009;9:10066–10079. doi: 10.3390/s91210066. [DOI] [PMC free article] [PubMed] [Google Scholar]
- 24.Tsai JZ, Chen CJ, Liu JT, Hsin YM, Chen WY, Hsueh KH. Electron Lett. 2010;46:678. [Google Scholar]
- 25.Wong DM, Giguère S, Wendel MA. J Am Vet Med Assoc. 2013;242:812–819. doi: 10.2460/javma.242.6.812. [DOI] [PubMed] [Google Scholar]
- 26.Mukhopadhyay R. Anal Chem. 2009;81:8659–8659. doi: 10.1021/ac9024494. [DOI] [PubMed] [Google Scholar]
- 27.Lambers Heerspink HJ, Witte EC, Bakker SJL, de Jong PE, de Zeeuw D, Gansevoort RT. Kidney Int. 2008;74:377–383. doi: 10.1038/ki.2008.186. [DOI] [PubMed] [Google Scholar]
- 28.Kessler MA, Hubmann MR, Dremel BA, Wolfbeis OS. Clin Chem. 1992;38:2089–2092. [PubMed] [Google Scholar]
- 29.Kessler MA, Meinitzer A, Wolfbeis OS. Anal Biochem. 1997;248:180–182. doi: 10.1006/abio.1997.2113. [DOI] [PubMed] [Google Scholar]
- 30.Kessler MA, Meinitzer A, Petek W, Wolfbeis OS. Clin Chem. 1997;43:996–1002. [PubMed] [Google Scholar]
- 31.Coskun AF, Wong J, Khodadadi D, Nagi R, Tey A, Ozcan A. Lab Chip. 2013;13:636–640. doi: 10.1039/c2lc41152k. [DOI] [PMC free article] [PubMed] [Google Scholar]
- 32.Ng WY, Lui KF, Thai AC. Ann Acad Med Singapore. 2000;29:62–65. [PubMed] [Google Scholar]
- 33.Parsons MP, Newman DJ, Newall RG, Price CP. Clin Chem. 1999;45:414–417. [PubMed] [Google Scholar]
- 34.Peralta SM, CA JAMA. 2011;305:1545–1552. doi: 10.1001/jama.2011.468. [DOI] [PMC free article] [PubMed] [Google Scholar]
- 35.Gustafsson JE, Uzqueda HR. Clin Chim Acta. 1978;90:249–257. doi: 10.1016/0009-8981(78)90264-4. [DOI] [PubMed] [Google Scholar]
- 36.Niesser M, Koletzko B, Peissner W. Ann Nutr Metab. 2012;61:314–321. doi: 10.1159/000342774. [DOI] [PubMed] [Google Scholar]
- 37.Redon J. Nephrol Dial Transplant. 2006;21:573–576. doi: 10.1093/ndt/gfk014. [DOI] [PubMed] [Google Scholar]
- 38.Laiwattanapaisal W, Saythanu P, Nubtueboon P, Tencomnao T, Santiyanont R. Lab Medicine. 2008;39:727–729. [Google Scholar]
- 39.Zhu H, Sencan I, Wong J, Dimitrov S, Tseng D, Nagashima K, Ozcan A. Lab Chip. 2013;13:1282–1288. doi: 10.1039/c3lc41408f. [DOI] [PMC free article] [PubMed] [Google Scholar]
- 40.Zhu H, Mavandadi S, Coskun AF, Yaglidere O, Ozcan A. Anal Chem. 2011;83:6641–6647. doi: 10.1021/ac201587a. [DOI] [PMC free article] [PubMed] [Google Scholar]
- 41.Zhu H, Sikora U, Ozcan A. Analyst. 2012;137:2541–2544. doi: 10.1039/c2an35071h. [DOI] [PMC free article] [PubMed] [Google Scholar]
- 42.Zhu H, Yaglidere O, Su TW, Tseng D, Ozcan A. Lab Chip. 2011;11:315–322. doi: 10.1039/c0lc00358a. [DOI] [PMC free article] [PubMed] [Google Scholar]
- 43.Tseng D, Mudanyali O, Oztoprak C, Isikman SO, Sencan I, Yaglidere O, Ozcan A. Lab Chip. 2010;10:1787–1792. doi: 10.1039/c003477k. [DOI] [PMC free article] [PubMed] [Google Scholar]
- 44.Greenbaum A, Luo W, Su TW, Göröcs Z, Xue L, Isikman SO, Coskun AF, Mudanyali O, Ozcan A. Nat Methods. 2012;9:889–895. doi: 10.1038/nmeth.2114. [DOI] [PMC free article] [PubMed] [Google Scholar]
- 45.Mudanyali O, Tseng D, Oh C, Isikman SO, Sencan I, Bishara W, Oztoprak C, Seo S, Khademhosseini B, Ozcan A. Lab Chip. 2010;10:1417–1428. doi: 10.1039/c000453g. [DOI] [PMC free article] [PubMed] [Google Scholar]
- 46.Breslauer DN, Maamari RN, Switz NA, Lam WA, Fletcher DA. PLoS ONE. 2009;4:e6320. doi: 10.1371/journal.pone.0006320. [DOI] [PMC free article] [PubMed] [Google Scholar]
- 47.Smith ZJ, Chu K, Espenson AR, Rahimzadeh M, Gryshuk A, Molinaro M, Dwyre DM, Lane S, Matthews D, Wachsmann-Hogiu S. PLoS ONE. 2011;6:e17150. doi: 10.1371/journal.pone.0017150. [DOI] [PMC free article] [PubMed] [Google Scholar]
- 48.Gallegos D, Long KD, Yu H, Clark PP, Lin Y, George S, Nath P, Cunningham BT. Lab Chip. 2013;13:2124–2132. doi: 10.1039/c3lc40991k. [DOI] [PubMed] [Google Scholar]
- 49.Oncescu V, O’Dell D, Erickson D. Lab Chip. 2013 doi: 10.1039/C3LC50431J. [DOI] [PubMed] [Google Scholar]
- 50.Shen L, Hagen JA, Papautsky I. Lab Chip. 2012;12:4240–4243. doi: 10.1039/c2lc40741h. [DOI] [PubMed] [Google Scholar]
- 51.You DJ, Park TS, Yoon JY. Biosens Bioelectron. 2013;40:180–185. doi: 10.1016/j.bios.2012.07.014. [DOI] [PubMed] [Google Scholar]
- 52.Navruz I, Coskun AF, Wong J, Mohammad S, Tseng D, Nagi R, Phillips S, Ozcan A. Lab Chip. 2013 doi: 10.1039/C3LC50589H. [DOI] [PMC free article] [PubMed] [Google Scholar]
- 53.International Telecommunication Union. ICT Facts and Figures. 2013 http://www.itu.int/en/ITU-D/Statistics/Pages/facts/default.aspx.
- 54.Mudanyali O, Dimitrov S, Sikora U, Padmanabhan S, Navruz I, Ozcan A. Lab Chip. 2012;12:2678–2686. doi: 10.1039/c2lc40235a. [DOI] [PMC free article] [PubMed] [Google Scholar]
- 55.Mavandadi S, Dimitrov S, Feng S, Yu F, Sikora U, Yaglidere O, Padmanabhan S, Nielsen K, Ozcan A. Plos One. 2012;7:e37245. doi: 10.1371/journal.pone.0037245. [DOI] [PMC free article] [PubMed] [Google Scholar]


