

Abstract
In a previous study we showed that genetic variation in HTR2A, which encodes the serotonin 2A receptor, influenced outcome of citalopram treatment in patients with major depressive disorder (MDD). Since chronic administration of citalopram, which selectively and potently inhibits the serotonin transporter (5-HTT), putatively enhances serotonergic transmission, it is conceivable that genetic variation within HTR2A also influences pretreatment 5-HTT function or serotonergic transmission. The present study used positron emission tomography (PET) and the selective 5-HTT ligand, [11C]DASB, to investigate whether the HTR2A marker alleles that predict treatment outcome also predict differences in 5-HTT binding.
Brain levels of 5-HTT were assessed in vivo using PET measures of the nondisplaceable component of the [11C]DASB binding potential (BPND). DNA from 43 patients and healthy volunteers, all unmedicated, was genotyped with 14 single nucleotide polymorphisms (SNPs) located within or around HTR2A. Allelic association with BPND was assessed in 8 brain regions, with covariates to control for race and ethnicity.
We detected allelic association between [11C]DASB BPND in thalamus and 3 markers in a region spanning the 3′ untranslated region and second intron of HTR2A (rs7333412, p=0.000045; rs7997012, p= 0.000086; rs977003, p=0.000069). The association signal at rs7333412 remained significant (p<0.05) after applying corrections for multiple testing via permutation.
Genetic variation in HTR2A that previously was associated with citalopram treatment outcome also was associated with thalamic 5-HTT binding. While further work is needed to identify the actual functional genetic variants involved, these results suggest that a relationship exists between genetic variation in HTR2A and either 5-HTT expression or central serotonergic transmission that influences the therapeutic response to 5-HTT inhibition in major depression.
Keywords: Genetic Association, Positron Emission Tomography, Serotonin Transporter, [11C]DASB, HTR2A
Introduction
Several studies have investigated the use of genetic markers to predict antidepressant treatment outcome in major depressive disorder (MDD) (Laje and McMahon, 2007). Despite many interesting findings, however, no consensus exists. A genetic association study of 68 candidate genes in the STAR*D cohort identified a significant and reproducible association between citalopram treatment outcome and genetic variation occurring near or within the gene encoding the serotonin 2A receptor (HTR2A) (McMahon et al., 2006f). However, the mechanism by which variation in HTR2A influences outcome of citalopram treatment remains unclear.
Citalopram inhibits the reuptake of serotonin (5-HT) into 5-HT neurons by selectively and potently binding to serotonin transporters (5-HTT). The 5-HTT has been the focus of many studies of normal and pathological emotional behavior. In post-mortem human brain tissue, the 5-HTT density varies by region, with highest values in the raphe nuclei, thalamus, and amygdala, and lowest values in the cerebellar cortex (Cortes et al., 1988; Kish et al., 2005; Laruelle et al., 1988b; Varnas et al., 2004). The 5-HTT binding potential (a parameter that reflects the product of density and affinity) can be quantified in vivo using positron emission tomography (PET) and the radioligand, [11C]-3-amino-4-(2-dimethylamino-methyl-phenylsulfanyl)-benzonitrile ([11C]DASB). This radioligand has shown relatively greater specific-to-nonspecific binding ratios in vivo than previously available 5-HTT radioligands (Ginovart et al., 2001b; Houle et al., 2000a; Huang et al., 2002; Wilson et al., 2002). The nondisplaceable component of the 5-HTT binding potential (BPND) obtained using [11C]DASB closely corresponds with 5-HTT densities measured post mortem in the human brain (Ginovart et al., 2001a; Houle et al., 2000b). Cannon et al. (2007) reported differences in the [11C]DASB BPND between healthy controls and unmedicated subjects with a major depressive episode (MDE).
Since SSRI's bind the serotonin transporter, genes important in response to SSRIs might also be important in regulating the serotonin transporter, or its expression. DNA samples acquired from some of the subjects that participated in the Cannon et al. study were genotyped using a panel of single nucleotide polymorphisms (SNPs) that were previously tested in the much larger sample from the multicenter, STAR*D clinical trial (McMahon et al., 2006e). This SNP profile included 14 markers in and around HTR2A, of which one showed an association with improvement after citalopram treatment. Using these data, we asked whether genetic variation in HTR2A is associated with 5-HTT BPND, as one of the potential mechanisms by which variation in HTR2A modulates antidepressant response.
Materials and Methods
Subject Sample, PET Data Collection and Analysis
A detailed description of the subject entrance criteria, region-of-interest (ROI) definition, and PET data analysis appears in (Cannon et al., 2006c; Cannon et al., 2007c). Briefly, participants included unmedicated outpatients and healthy volunteers ages 18 to 55 years who met DSM-IV for a current major depressive episode (MDE), manifested a clinical course consistent with either MDD (n = 16) or bipolar disorder (BD) (n = 12), and had experienced mood disorder onset prior to age 40 years. Healthy-controls (n = 15) who had never met criteria for a major psychiatric disorder and denied having a first-degree relative with a major psychiatric disorder also participated (table 1). All participants provided written informed consent and the study was approved by the NIMH Internal Review Board. Exclusion criteria included exposure to psychotropic drugs or to any medications or herbal preparations with reported effects on serotonergic function within the 3 weeks before scanning (8 wks for fluoxetine), pregnancy, lifetime history of substance-dependence, or substance-abuse within the previous 1 year. The severity of depressive symptoms was rated using the Montgomery-Asberg Depression Rating Scale (MADRS) (Montgomery and Asberg, 1979) and the Inventory of Depressive Symptoms Clinician Version (IDS-C) (Trivedi et al., 2004b). Anxiety symptoms were rated using the Hamilton Anxiety rating scale (HAM-A) (Hamilton, 1959), and manic symptoms using the Young Mania Rating Scale (YMRS) (Young et al., 1978a). Only a subset of the total sample reported in Cannon et al (2006 in Cannon et al (2007) was available for DNA testing (n=43). DNA was extracted from whole blood using GenePure chemistry (Qiagen) at the NIH laboratories.
Table 1.
Basic demographic characteristics of participants by diagnostic group including gender, ethnicity and age at time of PET scan. MDD: major depressive disorder, BD: bipolar disorder, HC: healthy control. SD: standard deviation.
| MDD (n=16) | BD (n=12) | HC (n=15) | |
|---|---|---|---|
| Gender (female) | 11 | 10 | 9 |
| Ethnicity | |||
| Caucasian | 4 | 7 | 9 |
| African-American | 8 | 5 | 5 |
| Other | 4 | 1 | |
| Mean Age (SD) | 36.5 (8.9) | 29.75 (6.7) | 35 (6.9) |
PET images were acquired using a GE-Advance scanner in 3D-mode (reconstructed 3D spatial resolution=6 mm full-width at half maximum [FWHM]). A 120-minute dynamic emission scan was acquired as 33 frames of increasing length. High specific activity [11C]DASB was synthesized as described previously by (Wilson et al., 2000). To provide an anatomical framework for analysis of the PET data, MRI scans were acquired using a GE 1.5 or 3.0 tesla scanner and a T1-weighted pulse sequence (voxel size=0.86 × 0.86 × 1.2 mm). The co-registered PET and MRI images were spatially normalized to a common stereotaxic array using SPM2 and resampled into 2 mm3 voxels. The 5-HTT binding parameter estimates were computed voxel-by-voxel using the MRTM2 method (Ichise et al., 2003) as described in Cannon et al (2006). The reference region was defined in cerebellar cortex with the ROI boundaries situated more than one FWHM ventral to the occipital and temporal cortices, lateral to the vermis, and anterior to the posterior surface. Regional templates were defined on a mean MRI image generated by summing the spatially normalized MRI images from all subjects. MRTM2 allows voxel-wise estimation (parametric imaging) of BPND= f2Bmax/Kd, which is proportional to the transporter density (Bmax), where Kd and f2 are the dissociation constant and free tissue fraction, respectively. The BPND values thus were independent of blood flow (K1) (Cannon et al., 2007b; Ichise et al., 2003). The weighted mean tracer clearance time (fixed k′2) obtained from the thalamus, midbrain and striatum did not differ (F=1.15, p=0.323) across the control (0.056 ± 0.011 min-1), MDD (0.053 ± 0.009 min-1) or BD-samples (0.058 ± 0.009 min-1).
The [11C]DASB binding potential (BPND) values were assessed in eight regions of interest (ROIs) where differences were obtained between control and mood disordered groups in Cannon et al. (2007): thalamus (TH), striatum (STR), insula (INS), midbrain (MIDBR), pregenual anterior cingulate cortex (pgACC), dorsal cingulate cortex (DCC) and posterior cingulate cortex (PCC). Additionally, the subgenual anterior cingulate cortex (sgACC) was included due to previous reports of association with depression treatment outcome (Drevets et al., 2008; Mayberg et al., 1997). Anatomical boundaries for these ROIs appear in (Cannon et al., 2006b). The BPND value for each region was computed as the average of the BPND values for all voxels within the ROI.
To identify the areas where genotype correlated most significantly with BPND, a voxel-wise analysis was conducted post hoc using SPM2 (smoothing kernel 8 mm3). We used two-sample, independent t-tests to compare parametric BPND images between genotype-based groups. This analysis was performed under a dominant model in order to generate comparably-sized groups for comparison. The significance threshold for the voxel-wise analysis was set at pcorrected<0.05, after applying corrections for multiple comparisons using the cluster-test (Poline et al., 1995) or the false discovery rate (Genovese et al., 2002).
Selection of single nucleotide polymorphism (SNP) markers
Fourteen SNPs were selected to sample common variation in HTR2A, as detailed in (McMahon et al., 2006d). The program “LDSelect,” (Carlson et al., 2004) was used to choose an optimally uncorrelated set of available SNPs to genotype (marker-marker r2<0.8), excluding SNPs with a low minor allele frequency, which lack power to demonstrate association. Due to their potential functional significance, we also included 3 SNPs reported to have an impact on HTR2A transcription (Erdmann et al., 1996; Ozaki et al., 1997b).
Genotyping methods
Samples were shipped to Illumina, Inc., San Diego, California, where they were genotyped on a highly-accurate assay (Gunderson et al., 2004). Of all SNPs selected, 99.73% could be genotyped, and 99.90 % of all possible genotypes were returned, including 35,052 blind duplicate genotypes, all of which matched exactly.
Genetic Association Analysis
The BPND for each ROI was extracted for each subject and used as a quantitative trait in the association analysis. To improve power depressed patients and healthy volunteers were grouped together for this analysis, since there was no a priori reason to assume that the genetic association between marker and imaging trait would differ between diagnostic subgroups. Association with the genotyped SNPs was assessed via score tests derived from a linear model (Schaid et al., 2003; Seaman and Muller-Myhsok, 2005a).
We controlled the experiment-wise error rate for the genetic association analysis by permutation. We developed a novel permutation method that accounted for the 14 SNPs and 8 ROI tested. This method breaks any connection between markers and phenotypes, reflecting a global null hypothesis, while maintaining the correlation structure among the markers and, separately, among the phenotypes. We considered the imaging phenotypes from each individual as a unit and randomly permuted entire phenotype units between individuals to form permutation datasets. All the marker association tests were performed on each permutation dataset and the minimum p-value noted. Thus we were able to estimate the permutation distribution of the minimum p-value under the global null hypothesis. Comparing our original raw p-values with the permutation distribution allowed for an estimate of the experiment-wise p-values. To control for effects of race and ethnicity, the sample was divided into 3 strata (see below) and permutations were performed within each stratum separately. Additional details of our testing procedure can be found in the Appendix (supplementary material).
Population Structure
To reduce the risk that population stratification might inflate the results of the genetic associations, we used genotypes of 1764 unlinked SNPs (generated separately on this sample) to estimate posterior probabilities of subpopulation membership for each individual. Based on this analysis, each individual's most likely subpopulation membership was imputed and used as a stratifying variable in the analysis. Using STRUCTURE (Pritchard et al., 2000), we evaluated the scenario of 3 cryptic populations within the sample by running 20,000 burn-in steps followed by 20,000 replications.
Potential confounds
were assessed in post-hoc tests. The original [11C]DASB PET studies (Cannon et al., 2006a; Cannon et al., 2007a) found that BPND in the thalamus was significantly influenced by age, diagnosis, and symptom severity. Thus, we included these variables as covariates (along with rs7333412 genotype and STRUCTURE posterior probabilities) in a generalized linear model, with thalamic 5-HTT BPND as the dependent variable. Previous studies have also suggested that smoking status (Staley et al., 2001) and season when the scan was obtained (Praschak-Rieder et al., 2008) can also affect BPND, so these were also evaluated in separate covariate analyses.
Results
Association analyses
Association results for the 14 SNPs in the 8 regions of interest (ROIs) appear in Table 2. The markers rs7333412, rs7997012 and rs977003 were associated with 5-HTT binding potential (BPND) in thalamus and insula at puncorrected<0.05. Only rs7333412 in thalamus remained significant after permutation correction (pcorrected<0.05). This marker explained 28% of the variance in thalamic 5-HTT BPND in this sample (figure 1). The lowest BPND values were observed in AA homozygotes.
Table 2.
Genetic association results. Regions-of-interest (ROI) were defined bilaterally (to reduce the number of comparisons) in the thalamus (TH), striatum (STR), insula (INS), and midbrain (MIDBR), and in the subgenual anterior (sgACC), pregenual anterior (pgACC), dorsal (DCC) and posterior (PCC) portions of the cingulate cortex. P-values represent the linear regression of allele on 5-HTT binding potential in each ROI, uncorrected for multiple comparisons. Only values <0.1 are shown.
| Marker | Region of Interest | |||||||
|---|---|---|---|---|---|---|---|---|
| TH | STR | INS | sgACC | pgACC | DCC | PCC | MIDBR | |
| rs7333412 | 0.00005 | 0.03415 | 0.00387 | ns | 0.06698 | 0.07041 | 0.07775 | ns |
| rs3125 | ns | ns | ns | ns | ns | ns | ns | ns |
| rs6314 | ns | ns | ns | ns | ns | ns | ns | ns |
| rs7997012 | 0.00009 | ns | 0.00627 | ns | ns | 0.04558 | 0.07356 | 0.07439 |
| rs977003 | 0.00007 | ns | 0.02151 | ns | ns | ns | ns | ns |
| rs1923884 | ns | ns | ns | ns | ns | ns | ns | ns |
| rs1745837 | ns | ns | ns | ns | ns | ns | ns | ns |
| rs2770296 | ns | ns | ns | ns | ns | ns | ns | ns |
| rs1328677 | ns | ns | ns | ns | ns | ns | ns | ns |
| rs1928040 | ns | ns | ns | ns | ns | ns | ns | ns |
| rs731779 | ns | ns | ns | ns | ns | ns | ns | ns |
| rs985933 | 0.02799 | ns | ns | ns | ns | ns | ns | ns |
| rs594242 | 0.01553 | ns | ns | ns | ns | ns | ns | ns |
| rs6312 | ns | ns | ns | ns | ns | ns | ns | ns |
Figure 1.
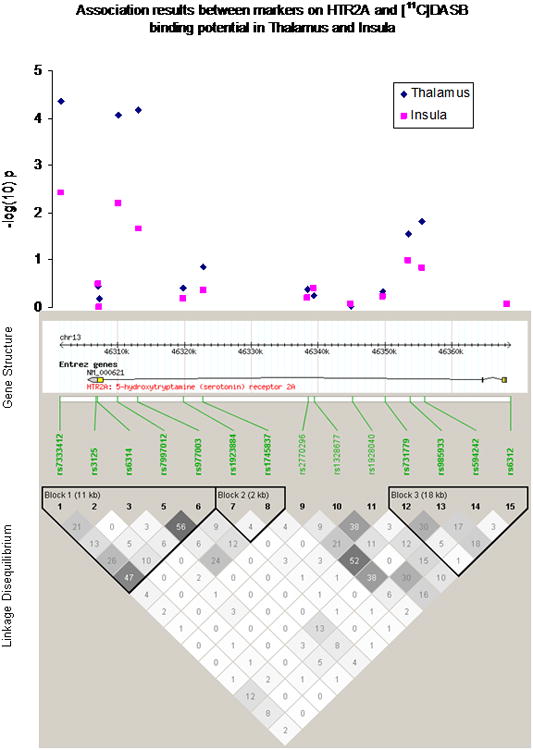
Association results in thalamus and insula, HTR2A gene structure, physical positions and linkage disequilibrium relationships of the 14 studied markers (Draft Human Genome Sequence Build 34). Haploview was used to calculate linkage disequilibrium that is shown using r2 values and coloring (darker shades indicate higher LD). Haplotype blocks were defined using the Four Gamete Test.
The positions of the genotyped markers relative to HTR2A, their linkage disequilibrium relationships, and the allelic association results in thalamus and insula are shown in figure 2. All of the associated markers lay in the same haplotype block spanning the 3′ untranslated region (UTR) and second intron of HTR2A. Marker rs7333412 represents a G>A substitution in a non-conserved region 4kb distal to the 3′UTR of HTR2A. This is the same gene region that was associated with citalopram outcome in our previous study (McMahon et al 2006).
Figure 2.
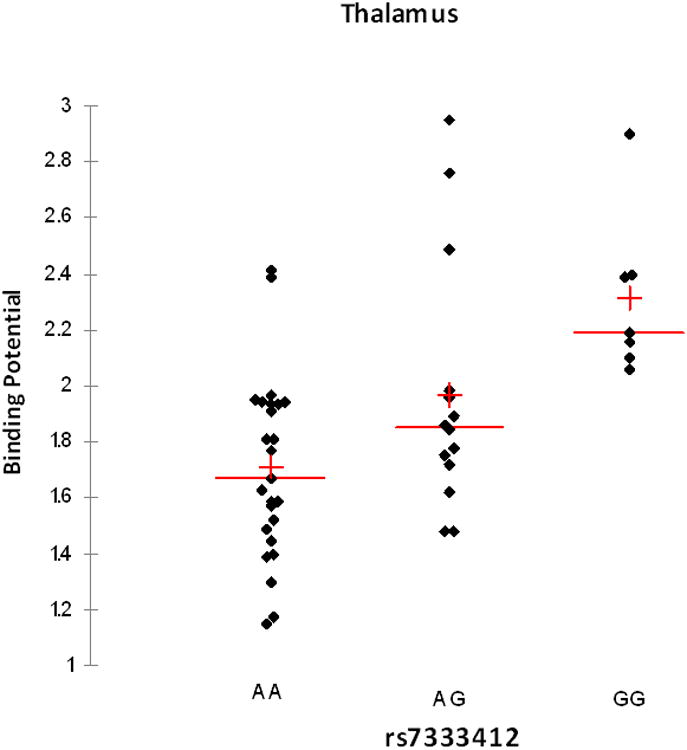
Serotonin transporter binding potential in thalamus by rs7333412 genotype. All data points are shown, along with mean (−) and median (+).
The post hoc voxel-wise analysis of the relationship between rs7333412 and BPND supported the ROI results. In the thalamus, subjects with the AG or GG-genotype had higher 5-HTT binding than those with the AA-genotype (T=3.37, p=0.03; Fig. 3). AA-carriers did not have greater 5-HTT BPND in other brain areas, consistent with the ROI results (data not shown). The genotype-based groups were well-balanced for the proportion of mood disorder cases and healthy controls (AA: 53%, AG plus GG: 43%) and for mean age (AA: 36.7 ± 7.4 yr, AG plus GG: 32.4 ± 8.7 yr).
Figure 3.
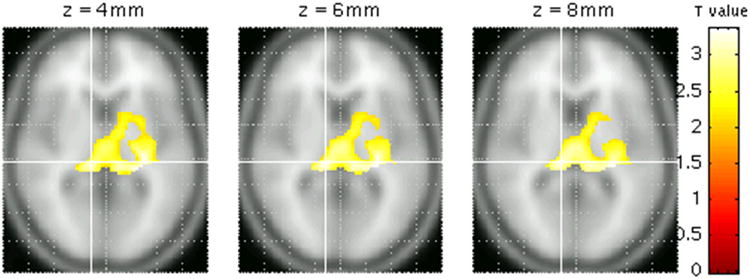
Voxel-based analysis showing increased thalamic 5-HTT binding potential in subjects with the AG or GG-genotypes compared to those with the AA-genotype (t=3.37, p=0.03).
In post-hoc tests of potential confounds, diagnosis and age were found to be significant covariates (p=0.01 and p=0.01, respectively). However, the association between 5-HTT BPND and rs7333412 remained significant after inclusion of these covariates in the regression model (F [5,40]=6.14, p=0.0003). Current symptoms of depression, mania, and anxiety, measured by MADRS (Montgomery and Asberg, 1979), IDS-C (Trivedi et al., 2004a), YMRS (Young et al., 1978b), and HAM-A (Hamilton, 1959), showed no significant effect on the relationship between rs7333412 and thalamic 5-HTT BPND (supplemental table 1). Smoking status and season of scan also had no significant effect on the observed association (data not shown). Thus the association observed between rs7333412 and thalamic 5-HTT BPND remained significant despite adjustment for potentially confounding differences between the AA-homozygotes and G-carriers in age, diagnosis, symptom severity, season assessed, and smoking status.
None of the putatively functional markers we studied showed any evidence of association with 5-HTT BPND in this sample.
Discussion
This is the first study to detect an association between 5-HTT binding potential (BPND) and genetic variation in HTR2A. These data suggest that either a direct or an indirect functional relationship exists between the HTR2A and 5-HTT systems. Genetic variation in the 3′ UTR and 2nd intron of HTR2A previously was associated with the antidepressant outcome of citalopram treatment in patients with MDD (McMahon et al., 2006c). Although these data have not localized the specific functional genetic variant within HTR2A, taken together they hold the potential to shed light on the mechanism of antidepressant action of SSRIs.
We found that genetic variation spanning the 3′ UTR and 2nd intron of HTR2A is associated with 5-HTT BPND. This genetic variation lay within the same haplotype block that was implicated in our study of citalopram treatment outcome (McMahon et al 2006). Although speculative, these results suggest HTR2A might exert a trans-regulatory effect on 5-HTT expression (SLC6A4), 5-HTT trafficking, or both. The final result may be a relative difference in 5-HTT concentration at the synapse that could impact SSRI efficacy and tolerability.
One variant in this same haplotype block, rs6314, encodes a His to Tyr substitution (His452Tyr) and may regulate Ca2+ mobilization peaks (Ozaki et al., 1997a). However, both the STAR*D and the present sample were underpowered to detect association with this very uncommon variant. It is possible that the same functional variant(s) in this region of HTR2A account for both the citalopram-response and the 5-HTT BPND association findings, but we cannot definitively implicate a single functional variant based upon the available data.
Differences in [11C]DASB BPND most likely reflect changes in 5-HTT density or affinity between genotypic groups. The method we applied to obtain 5-HTT BPND used a reference tissue model to obviate the need for arterial blood sampling. Using the cerebellar cortex as the reference tissue (i.e., to correct for the proportions of radiotracer distribution attributable to free or non-specific binding), this model provides valid and reliable assessments of the 5-HTT BPND parameter in [11C]DASB images, and yields occupancy measures that compare closely with those determined using an arterial input function (Ichise et al., 2003; Parsey et al., 2006). Moreover, while the cerebellum also contains very low 5-HTT concentrations (Szabo et al., 2002), Parsey et al (2006) used a combination of post mortem and in vivo neuroimaging assessments to demonstrate that the cerebellar cortex is the optimal reference region for modeling the BPND parameter in [11C]DASB images.
A limitation of the BPND parameter is that it reflects the product of density and affinity (Bmax/KD), so the effects of genetic variation in HTR2A on 5-HTT binding cannot be more specifically attributed to density versus affinity. For example, although physiological changes in the intrasynaptic 5-HT concentration are unlikely to alter [11C]DASB binding directly (Ginovart et al., 2003; Praschak-Rieder et al., 2005; Talbot et al., 2005), the trafficking of 5-HTT protein between the cytosol and the cell membrane is affected directly and rapidly by 5-HT levels (Blakely et al., 1998). Many radiotracers show a lower affinity for protein binding sites situated within the cytosol as opposed to on the cell membrane (Laruelle et al., 1988a). Although the extent to which [11C]DASB affinity for cytosolic 5-HTT protein differs from that for membrane-bound 5-HTT protein has not been characterized, it remains possible that if variation in HTR2A influences 5-HT transmission, this effect may influence 5-HTT BPND in the same direction (i.e., an increase in 5-HT transmission would result in increased 5-HTT trafficking from the cytosol to the membrane). Such an effect would hold major implications regarding the nature of the differential treatment responsiveness to genetic variation in HTR2A. In particular, the observation that individuals homozygous for the A-allele at rs7333412 show both greater responsiveness to citalopram treatment (McMahon et al., 2006b) and lower 5-HTT BPND suggests the hypothesis that AA-homozygotes benefit from enhancing 5-HT transmission via SSRI pharmacotherapy because these individuals have lower basal 5-HT transmission.
The regions of interest chosen for this study were based on known relevance to affective disorders and measurable concentration of 5-HTT. The thalamus, where we find the most robust evidence of association between BPnd and rs733412, has long been thought to be involved in the depression circuitry, due to its connections with subcortical limbic structures such as the amygdala and prefrontal and cingulate cortices. However, our results do not exclude association with other regions of interest. Indeed, the uncorrected association results are consistent with signals in insula and striatum. Although these p-values did not remain significant after permutation correction, it is possible that this constitutes a Type II error due to limited sample size.
In this paper we performed multiple tests of association between genetic markers in or near the HTR2A gene and the 5-HTT BPND phenotype in several brain regions. Multiple testing can lead to spurious findings. To address this issue we used a novel permutation procedure that took into account both the linkage disequilibrium between nearby SNPs and the correlation in BPND across brain regions-of-interest. Where such correlations exist, alternative procedures such as Bonferroni correction would be overly conservative, and might also depend on asymptotic properties that did not hold in the current dataset (Cheng and Lin, 2005; Seaman and Muller-Myhsok, 2005b). The permutation procedure we used had neither of these limitations and thus was well-suited to handle multiple correlated phenotypes. Nevertheless, this conservative approach increased the risk for Type II error, and conceivably the association between genetic variation at rs7333412 and 5-HTT BPND may have become significant in other regions (e.g., insula) as well in a larger sample size or a more targeted analysis. The regional specificity of our findings thus awaits future studies designed to address this issue more specifically.
Other limitations of our study design also merit comment. The original imaging experiment was not designed primarily to test association between HTR2A and 5-HTT binding. Furthermore, the 14 SNPs tested in HTR2A were extracted from a larger set that included a total of 768 SNPs in 68 genes [the same set reported in (McMahon et al., 2006a)], selected to interrogate common variation. Finally, our results do not illuminate whether HTR2A variation affects 5HTT binding directly, or indirectly through some mediating molecule(s) or system(s). For example, if variation in HTR2A influences serotonergic transmission generally, the 5-HTT BPND values may be influenced indirectly via associated changes in 5-HTT expression or trafficking, as described above (Blakely et al., 1998). Arterial samples were not drawn during scanning and BPND therefore equals the product of BPF (the ratio of specific binding to free radioligand at equilibrium) and the free fraction of ligand in the nondisplaceable tissue compartment (fND). Our results thus constitute preliminary observations until the functional alleles are identified, replication is shown in an independent sample, and the mechanism underlying the relationship between genetic variation in HTR2A and 5-HTT binding is more fully characterized.
In summary, genetic variation in a region of HTR2A that is associated with antidepressant outcome was also associated with 5-HTT binding in the thalamus. These results suggest a novel functional connection between HTR2A and 5-HTT that may shed light on the neurobiological basis underlying individual differences in the responsiveness to SSRI pharmacotherapy.
Supplementary Material
Supplemental table 1: General Linear Model results including thalamus binding potential (BPND) by rs7333412 genotype and scores for current symptoms of depression, mania, and anxiety, measured by the Inventory for Depressive Symptoms –Clinician rated (IDS-C) (Trivedi et al., 2004), Montgomery-Asberg Depression Rating Scale (MADRS) (Montgomery and Asberg, 1979), Young Mania Rating Scale (YMRS) (Young et al., 1978), and Hamilton Anxiety Scale (HAM-A) (Hamilton, 1959) (n=43).
Acknowledgments
We thank Nirmala Akula and Jo Steele for technical assistance and Luana Galver at Illumina, Inc. for supervising the genotyping. We thank Joan Williams RN, Michele Drevets RN and Denise Rallis-Voak RN for evaluation and recruitment of research subjects, the NIH Clinical Center staff, and Shilpa Gandhi, Laurentina Cizza, Heather Bowling, Anjlee Mehta, Kelly Anastasi, Caitlyn Liebig and Cara Moody for technical assistance. The content of this publication does not necessarily reflect the views or policies of the DHHS, nor does mention of trade names, commercial products, or organizations imply endorsement by the U.S. Government.
This study was funded by the Intramural Research Program of the National Institute of Mental Health, NIH, US DHHS.
Footnotes
Disclosures: Drs. Laje, Cannon, Liu, Allen, Peck, Klaver, Manji, Drevets and McMahon report no competing interests.
References
- Blakely RD, Ramamoorthy S, Schroeter S, Qian Y, et al. Regulated phosphorylation and trafficking of antidepressant-sensitive serotonin transporter proteins. Biological Psychiatry. 1998;44:169–178. doi: 10.1016/s0006-3223(98)00124-3. [DOI] [PubMed] [Google Scholar]
- Cannon DM, Ichise M, Fromm SJ, Nugent AC, et al. Serotonin transporter binding in bipolar disorder assessed using [11C]DASB and positron emission tomography. Biological Psychiatry. 2006c;60:207–217. doi: 10.1016/j.biopsych.2006.05.005. [DOI] [PubMed] [Google Scholar]
- Cannon DM, Ichise M, Fromm SJ, Nugent AC, et al. Serotonin transporter binding in bipolar disorder assessed using [11C]DASB and positron emission tomography. Biological Psychiatry. 2006b;60:207–217. doi: 10.1016/j.biopsych.2006.05.005. [DOI] [PubMed] [Google Scholar]
- Cannon DM, Ichise M, Fromm SJ, Nugent AC, et al. Serotonin transporter binding in bipolar disorder assessed using [11C]DASB and positron emission tomography. Biological Psychiatry. 2006a;60:207–217. doi: 10.1016/j.biopsych.2006.05.005. [DOI] [PubMed] [Google Scholar]
- Cannon DM, Ichise M, Rollis D, Klaver JM, et al. Elevated serotonin transporter binding in major depressive disorder assessed using positron emission tomography and [11C]DASB; comparison with bipolar disorder. Biological Psychiatry. 2007a;62:870–877. doi: 10.1016/j.biopsych.2007.03.016. [DOI] [PubMed] [Google Scholar]
- Cannon DM, Ichise M, Rollis D, Klaver JM, et al. Elevated serotonin transporter binding in major depressive disorder assessed using positron emission tomography and [11C]DASB; comparison with bipolar disorder. Biological Psychiatry. 2007b;62:870–877. doi: 10.1016/j.biopsych.2007.03.016. [DOI] [PubMed] [Google Scholar]
- Cannon DM, Ichise M, Rollis D, Klaver JM, et al. Elevated serotonin transporter binding in major depressive disorder assessed using positron emission tomography and [11C]DASB; comparison with bipolar disorder. Biological Psychiatry. 2007c;62:870–877. doi: 10.1016/j.biopsych.2007.03.016. [DOI] [PubMed] [Google Scholar]
- Carlson CS, Eberle MA, Rieder MJ, Yi Q, et al. Selecting a maximally informative set of single-nucleotide polymorphisms for association analyses using linkage disequilibrium. American Journal of Human Genetics. 2004;74:106–120. doi: 10.1086/381000. [DOI] [PMC free article] [PubMed] [Google Scholar]
- Cheng KF, Lin WJ. Retrospective analysis of case-control studies when the population is in Hardy-Weinberg equilibrium. Statistics in Medicine. 2005;24:3289–3310. doi: 10.1002/sim.2190. [DOI] [PubMed] [Google Scholar]
- Cortes R, Soriano E, Pazos A, Probst A, et al. Autoradiography of antidepressant binding sites in the human brain: localization using [3H]imipramine and [3H]paroxetine. Neuroscience. 1988;27:473–496. doi: 10.1016/0306-4522(88)90282-5. [DOI] [PubMed] [Google Scholar]
- Drevets WC, Savitz J, Trimble M. The subgenual anterior cingulate cortex in mood disorders. CNS Spectrums. 2008;13:663–681. doi: 10.1017/s1092852900013754. [DOI] [PMC free article] [PubMed] [Google Scholar]
- Erdmann J, Shimron-Abarbanell D, Rietschel M, Albus M, et al. Systematic screening for mutations in the human serotonin-2A (5-HT2A) receptor gene: identification of two naturally occurring receptor variants and association analysis in schizophrenia. Human Genetics. 1996;97:614–619. doi: 10.1007/BF02281871. [DOI] [PubMed] [Google Scholar]
- Genovese CR, Lazar NA, Nichols T. Thresholding of statistical maps in functional neuroimaging using the false discovery rate. Neuroimage. 2002;15:870–878. doi: 10.1006/nimg.2001.1037. [DOI] [PubMed] [Google Scholar]
- Ginovart N, Wilson AA, Meyer JH, Hussey D, et al. Positron emission tomography quantification of [(11)C]-DASB binding to the human serotonin transporter: modeling strategies. Journal of Cerebral Blood Flow and Metabolism. 2001b;21:1342–1353. doi: 10.1097/00004647-200111000-00010. [DOI] [PubMed] [Google Scholar]
- Ginovart N, Wilson AA, Meyer JH, Hussey D, et al. Positron emission tomography quantification of [(11)C]-DASB binding to the human serotonin transporter: modeling strategies. Journal of Cerebral Blood Flow and Metabolism. 2001a;21:1342–1353. doi: 10.1097/00004647-200111000-00010. [DOI] [PubMed] [Google Scholar]
- Ginovart N, Wilson AA, Meyer JH, Hussey D, et al. [11C]-DASB, a tool for in vivo measurement of SSRI-induced occupancy of the serotonin transporter: PET characterization and evaluation in cats. Synapse. 2003;47:123–133. doi: 10.1002/syn.10155. [DOI] [PubMed] [Google Scholar]
- Gunderson KL, Kruglyak S, Graige MS, Garcia F, et al. Decoding randomly ordered DNA arrays. Genome Research. 2004;14:870–877. doi: 10.1101/gr.2255804. [DOI] [PMC free article] [PubMed] [Google Scholar]
- Hamilton M. The assessment of anxiety states by rating. The British Journal of Medical Psychology. 1959;32:50–55. doi: 10.1111/j.2044-8341.1959.tb00467.x. [DOI] [PubMed] [Google Scholar]
- Houle S, Ginovart N, Hussey D, Meyer JH, et al. Imaging the serotonin transporter with positron emission tomography: initial human studies with [11C]DAPP and [11C]DASB. European Journal of Nuclear Medicine. 2000b;27:1719–1722. doi: 10.1007/s002590000365. [DOI] [PubMed] [Google Scholar]
- Houle S, Ginovart N, Hussey D, Meyer JH, et al. Imaging the serotonin transporter with positron emission tomography: initial human studies with [11C]DAPP and [11C]DASB. European Journal of Nuclear Medicine. 2000a;27:1719–1722. doi: 10.1007/s002590000365. [DOI] [PubMed] [Google Scholar]
- Huang Y, Hwang DR, Narendran R, Sudo Y, et al. Comparative evaluation in nonhuman primates of five PET radiotracers for imaging the serotonin transporters: [11C]McN 5652, [11C]ADAM, [11C]DASB, [11C]DAPA, and [11C]AFM. Journal of Cerebral Blood Flow and Metabolism. 2002;22:1377–1398. doi: 10.1097/01.WCB.0000040948.67415.05. [DOI] [PubMed] [Google Scholar]
- Ichise M, Liow JS, Lu JQ, Takano A, et al. Linearized reference tissue parametric imaging methods: Application to [11C]DASB positron emission tomography studies of the serotonin transporter in human brain. Journal of Cerebral Blood Flow and Metabolism. 2003;23:1096–1112. doi: 10.1097/01.WCB.0000085441.37552.CA. [DOI] [PubMed] [Google Scholar]
- Kish SJ, Furukawa Y, Chang LJ, Tong J, et al. Regional distribution of serotonin transporter protein in postmortem human brain: is the cerebellum a SERT-free brain region? Nuclear Medicine and Biology. 2005;32:123–128. doi: 10.1016/j.nucmedbio.2004.10.001. [DOI] [PubMed] [Google Scholar]
- Laje G, McMahon FJ. The pharmacogenetics of major depression: past, present, and future. Biological Psychiatry. 2007;62:1205–1207. doi: 10.1016/j.biopsych.2007.09.016. [DOI] [PubMed] [Google Scholar]
- Laruelle M, Vanisberg MA, Maloteaux JM. Regional and subcellular localization in human brain of [3H]paroxetine binding, a marker of serotonin uptake sites. Biological Psychiatry. 1988b;24:299–309. doi: 10.1016/0006-3223(88)90198-9. [DOI] [PubMed] [Google Scholar]
- Laruelle M, Vanisberg MA, Maloteaux JM. Regional and subcellular localization in human brain of [3H]paroxetine binding, a marker of serotonin uptake sites. Biological Psychiatry. 1988a;24:299–309. doi: 10.1016/0006-3223(88)90198-9. [DOI] [PubMed] [Google Scholar]
- Mayberg HS, Brannan SK, Mahurin RK, Jerabek PA, et al. Cingulate function in depression: a potential predictor of treatment response. Neuroreport. 1997;8:1057–1061. doi: 10.1097/00001756-199703030-00048. [DOI] [PubMed] [Google Scholar]
- McMahon FJ, Buervenich S, Charney D, Lipsky R, et al. Variation in the Gene Encoding the Serotonin 2A Receptor Is Associated with Outcome of Antidepressant Treatment. American Journal of Human Genetics. 2006a;78:804–814. doi: 10.1086/503820. [DOI] [PMC free article] [PubMed] [Google Scholar]
- McMahon FJ, Buervenich S, Charney D, Lipsky R, et al. Variation in the Gene Encoding the Serotonin 2A Receptor Is Associated with Outcome of Antidepressant Treatment. American Journal of Human Genetics. 2006c;78:804–814. doi: 10.1086/503820. [DOI] [PMC free article] [PubMed] [Google Scholar]
- McMahon FJ, Buervenich S, Charney D, Lipsky R, et al. Variation in the Gene Encoding the Serotonin 2A Receptor Is Associated with Outcome of Antidepressant Treatment. American Journal of Human Genetics. 2006d;78:804–814. doi: 10.1086/503820. [DOI] [PMC free article] [PubMed] [Google Scholar]
- McMahon FJ, Buervenich S, Charney D, Lipsky R, et al. Variation in the Gene Encoding the Serotonin 2A Receptor Is Associated with Outcome of Antidepressant Treatment. American Journal of Human Genetics. 2006e;78:804–814. doi: 10.1086/503820. [DOI] [PMC free article] [PubMed] [Google Scholar]
- McMahon FJ, Buervenich S, Charney D, Lipsky R, et al. Variation in the Gene Encoding the Serotonin 2A Receptor Is Associated with Outcome of Antidepressant Treatment. American Journal of Human Genetics. 2006f;78:804–814. doi: 10.1086/503820. [DOI] [PMC free article] [PubMed] [Google Scholar]
- McMahon FJ, Buervenich S, Charney D, Lipsky R, et al. Variation in the Gene Encoding the Serotonin 2A Receptor Is Associated with Outcome of Antidepressant Treatment. American Journal of Human Genetics. 2006b;78:804–814. doi: 10.1086/503820. [DOI] [PMC free article] [PubMed] [Google Scholar]
- Montgomery SA, Asberg M. A new depression scale designed to be sensitive to change. British Journal of Psychiatry. 1979;134:382–389. doi: 10.1192/bjp.134.4.382. [DOI] [PubMed] [Google Scholar]
- Ozaki N, Manji H, Lubierman V, Lu SJ, et al. A naturally occurring amino acid substitution of the human serotonin 5-HT2A receptor influences amplitude and timing of intracellular calcium mobilization. Journal of Neurochemistry. 1997a;68:2186–2193. doi: 10.1046/j.1471-4159.1997.68052186.x. [DOI] [PubMed] [Google Scholar]
- Ozaki N, Manji H, Lubierman V, Lu SJ, et al. A naturally occurring amino acid substitution of the human serotonin 5-HT2A receptor influences amplitude and timing of intracellular calcium mobilization. Journal of Neurochemistry. 1997b;68:2186–2193. doi: 10.1046/j.1471-4159.1997.68052186.x. [DOI] [PubMed] [Google Scholar]
- Parsey RV, Hastings RS, Oquendo MA, Huang YY, et al. Lower serotonin transporter binding potential in the human brain during major depressive episodes. American Journal of Psychiatry. 2006;163:52–58. doi: 10.1176/appi.ajp.163.1.52. [DOI] [PubMed] [Google Scholar]
- Poline JB, Worsley KJ, Holmes AP, Frackowiak RS, et al. Estimating smoothness in statistical parametric maps: variability of p values. Journal of Computer Assisted Tomography. 1995;19:788–796. doi: 10.1097/00004728-199509000-00017. [DOI] [PubMed] [Google Scholar]
- Praschak-Rieder N, Willeit M, Wilson AA, Houle S, et al. Seasonal variation in human brain serotonin transporter binding. Arch Gen Psychiatry. 2008;65:1072–1078. doi: 10.1001/archpsyc.65.9.1072. [DOI] [PubMed] [Google Scholar]
- Praschak-Rieder N, Wilson AA, Hussey D, Carella A, et al. Effects of tryptophan depletion on the serotonin transporter in healthy humans. Biological Psychiatry. 2005;58:825–830. doi: 10.1016/j.biopsych.2005.04.038. [DOI] [PubMed] [Google Scholar]
- Pritchard JK, Stephens M, Rosenberg NA, Donnelly P. Association mapping in structured populations. American Journal of Human Genetics. 2000;67:170–181. doi: 10.1086/302959. [DOI] [PMC free article] [PubMed] [Google Scholar]
- Schaid DJ, Olson JM, Gauderman WJ, Elston RC. Regression models for linkage: issues of traits, covariates, heterogeneity, and interaction. Human Heredity. 2003;55:86–96. doi: 10.1159/000072313. [DOI] [PubMed] [Google Scholar]
- Seaman SR, Muller-Myhsok B. Rapid simulation of P values for product methods and multiple-testing adjustment in association studies. American Journal of Human Genetics. 2005a;76:399–408. doi: 10.1086/428140. [DOI] [PMC free article] [PubMed] [Google Scholar]
- Seaman SR, Muller-Myhsok B. Rapid simulation of P values for product methods and multiple-testing adjustment in association studies. American Journal of Human Genetics. 2005b;76:399–408. doi: 10.1086/428140. [DOI] [PMC free article] [PubMed] [Google Scholar]
- Staley JK, Krishnan-Sarin S, Zoghbi S, Tamagnan G, et al. Sex differences in [123I]beta-CIT SPECT measures of dopamine and serotonin transporter availability in healthy smokers and nonsmokers. Synapse. 2001;41:275–284. doi: 10.1002/syn.1084. [DOI] [PubMed] [Google Scholar]
- Szabo Z, McCann UD, Wilson AA, Scheffel U, et al. Comparison of (+)-(11)C-McN5652 and (11)C-DASB as serotonin transporter radioligands under various experimental conditions. Journal of Nuclear Medicine. 2002;43:678–692. [PMC free article] [PubMed] [Google Scholar]
- Talbot PS, Frankle WG, Hwang DR, Huang Y, et al. Effects of reduced endogenous 5-HT on the in vivo binding of the serotonin transporter radioligand 11C-DASB in healthy humans. Synapse. 2005;55:164–175. doi: 10.1002/syn.20105. [DOI] [PubMed] [Google Scholar]
- Trivedi MH, Rush AJ, Ibrahim HM, Carmody TJ, et al. The Inventory of Depressive Symptomatology, Clinician Rating (IDS-C) and Self-Report (IDS-SR), and the Quick Inventory of Depressive Symptomatology, Clinician Rating (QIDS-C) and Self-Report (QIDS-SR) in public sector patients with mood disorders: a psychometric evaluation. Psychological Medicine. 2004a;34:73–82. doi: 10.1017/s0033291703001107. [DOI] [PubMed] [Google Scholar]
- Trivedi MH, Rush AJ, Ibrahim HM, Carmody TJ, et al. The Inventory of Depressive Symptomatology, Clinician Rating (IDS-C) and Self-Report (IDS-SR), and the Quick Inventory of Depressive Symptomatology, Clinician Rating (QIDS-C) and Self-Report (QIDS-SR) in public sector patients with mood disorders: a psychometric evaluation. Psychological Medicine. 2004b;34:73–82. doi: 10.1017/s0033291703001107. [DOI] [PubMed] [Google Scholar]
- Varnas K, Halldin C, Hall H. Autoradiographic distribution of serotonin transporters and receptor subtypes in human brain. Human Brain Mapping. 2004;22:246–260. doi: 10.1002/hbm.20035. [DOI] [PMC free article] [PubMed] [Google Scholar]
- Wilson AA, Ginovart N, Hussey D, Meyer J, et al. In vitro and in vivo characterisation of [11C]-DASB: a probe for in vivo measurements of the serotonin transporter by positron emission tomography. Nuclear Medicine and Biology. 2002;29:509–515. doi: 10.1016/s0969-8051(02)00316-5. [DOI] [PubMed] [Google Scholar]
- Wilson AA, Ginovart N, Schmidt M, Meyer JH, et al. Novel radiotracers for imaging the serotonin transporter by positron emission tomography: Synthesis, radiosynthesis, and in vitro and ex vivo evaluation of 11C-labeled 2-(phenylthio)araalkylamines. Journal of Medicinal Chemistry. 2000;43:3103–3110. doi: 10.1021/jm000079i. [DOI] [PubMed] [Google Scholar]
- Young RC, Biggs JT, Ziegler VE, Meyer DA. A rating scale for mania: reliability, validity and sensitivity. British Journal of Psychiatry. 1978b;133:429–435. doi: 10.1192/bjp.133.5.429. [DOI] [PubMed] [Google Scholar]
- Young RC, Biggs JT, Ziegler VE, Meyer DA. A rating scale for mania: reliability, validity and sensitivity. British Journal of Psychiatry. 1978a;133:429–435. doi: 10.1192/bjp.133.5.429. [DOI] [PubMed] [Google Scholar]
Associated Data
This section collects any data citations, data availability statements, or supplementary materials included in this article.
Supplementary Materials
Supplemental table 1: General Linear Model results including thalamus binding potential (BPND) by rs7333412 genotype and scores for current symptoms of depression, mania, and anxiety, measured by the Inventory for Depressive Symptoms –Clinician rated (IDS-C) (Trivedi et al., 2004), Montgomery-Asberg Depression Rating Scale (MADRS) (Montgomery and Asberg, 1979), Young Mania Rating Scale (YMRS) (Young et al., 1978), and Hamilton Anxiety Scale (HAM-A) (Hamilton, 1959) (n=43).