

Abstract
Although myogenic mechanisms have been hypothesized to play a role in cerebrovascular regulation, previous data from both animals and humans have not provided an unequivocal answer. However, cerebral autoregulation is explicitly non-linear and most prior work relied on simple linear approaches for assessment, potentially missing important changes in autoregulatory characteristics. Therefore, we examined cerebral blood flow responses to augmented arterial pressure oscillations with and without calcium channel blockade (nicardipine) during blood pressure fluctuations (oscillatory lower body negative pressure, OLBNP) across a range of frequencies in 16 healthy subjects. Autoregulation was characterized via a robust non-linear method (projection pursuit regression, PPR). Blockade resulted in significant tachycardia, a modest but significant elevation in mean arterial pressure, and reductions in mean cerebral blood flow and end-tidal CO2 during OLBNP. The reductions in flow were directly related to the reductions in CO2 (r= 0.57). While linear cross-spectral analysis showed that the relationship between pressure–flow fluctuations was preserved after blockade, PPR showed that blockade significantly altered the non-linearity between pressure and flow, particularly at the slowest fluctuations. At 0.03 Hz, blockade reduced the range of pressure fluctuations that can be buffered (7.5 ± 1.0 vs. 3.7 ± 0.8 mmHg) while increasing the autoregulatory slope (0.10 ± 0.05 vs. 0.24 ± 0.08 cm s−1 mmHg−1). Furthermore, the same rate of change in pressure elicited a change in flow more than twice as large as at baseline. Thus, our results show that myogenic mechanisms play a significant role in cerebrovascular regulation but this may not be appreciated without adequately characterizing the non-linearities inherent in cerebrovascular regulation.
Key points
The autoregulatory capacity of the cerebral vasculature allows for maintenance of relatively stable blood flow in the face of fluctuating arterial pressure to protect neural tissue from wide swings in oxygen and nutrient delivery.
We recently found that neurogenic control plays an active role in autoregulation. Although myogenic pathways have also been hypothesized to play a role, previous data have not provided an unequivocal answer.
We examined cerebral blood flow responses to augmented arterial pressure oscillations with and without calcium channel blockade, and characterized autoregulation via a robust non-linear method.
Blockade significantly altered the non-linearity between pressure and flow, particularly at the slowest fluctuations, and the same rate of change in pressure elicited a larger change in flow than at baseline.
These results show that myogenic mechanisms also play a significant role in cerebrovascular regulation, and help us better understand physiological mechanisms that underlie cerebral autoregulation in humans.
Introduction
The autoregulatory capacity of the cerebral vasculature allows for maintenance of relatively stable blood flow in the face of fluctuating arterial pressure to protect neural tissue from wide swings in oxygen and nutrient delivery. However, despite its clear physiological and clinical importance, the mechanisms that underlie cerebral autoregulation are incompletely understood. There is substantial evidence that cerebral autoregulation manifests itself as a non-linear interaction between arterial pressure and cerebral blood flow fluctuations at frequencies slower than ∼0.07 Hz (i.e. slower than ∼15 s) (Hamner et al. 2004; Tan, 2012), and we recently found that alpha-adrenergic or cholinergic blockade increases the linearity of the relationship within the time scales of active autoregulation (<0.07 Hz) (Hamner et al. 2010, 2012). This earlier work indicates that intact autonomic neural control is important for cerebral autoregulation. However, it has been presumed that myogenic mechanisms also play an important role. In vivo and in vitro studies on animals have shown that these mechanisms primarily act through a calcium-dependent pathway in smooth muscle in response to changes in vascular wall tension (Gonzalez et al. 1994; Wesselman et al. 1996; Harder et al. 1998; Potocnik et al. 2000). Briefly, when perfusion pressure increases, greater stretch of smooth muscle activates phospholipase C. This initiates a rapid cascade of events leading to inhibition of potassium channels, which, in turn, lowers the membrane potential of the vascular smooth muscle. Reduced membrane voltage causes influx of calcium and vasoconstriction (Harder et al. 1998). This myogenic response to changes in vascular smooth muscle wall tension can be key to flow regulation in other vascular beds, most notably the renal vasculature (Pires et al. 2001; DiBona & Sawin, 2004). Moreover, calcium channel blockade in rats impairs the ability of the cerebral vasculature to buffer against extrinsically induced fluctuations in cerebral perfusion pressure below 0.1 Hz (i.e. 10 s) (Kolb et al. 2007). Thus, there is evidence that myogenic mechanisms could be involved in cerebral autoregulation.
Exploration of the myogenic role in cerebral autoregulation in humans has been limited and has produced equivocal results. One set of experiments found attenuated responses to ischaemic thigh cuff release after nicardipine administration (Endoh et al. 2000, 2002), but these data were obtained from subjects under propofol anaesthesia, which has direct effects on cerebral autoregulation (Matta et al. 1995; Ederberg et al. 1998; Harrison et al. 1999). A more recent study utilized externally induced blood pressure fluctuations (via –120 mmHg oscillatory lower body negative pressure) to engage autoregulatory mechanisms in awake humans, and reported that oral administration of the calcium antagonist nimodipine did not alter the transfer function relationship at frequencies below 0.1 Hz (Tzeng et al. 2011). Although this would indicate minimal involvement of myogenic mechanisms in human cerebral autoregulation, the stimulus of 120 mmHg lower body negative pressure approaches extreme hypovolaemic stress (i.e. acute haemorrhagic shock; Cooke et al. 2004) and probably exceeded the autoregulatory capacity of the cerebrovasculature (Leung et al. 2013). Further, most prior work has relied on simple linear approaches (e.g. autoregulatory indices and transfer function analyses) to assess cerebral autoregulation. However, cerebral autoregulation as classically defined is an explicitly non-linear regulatory mechanism. Therefore, linear approaches may be insufficient to quantify important changes in the characteristics of cerebral autoregulation.
Therefore, we sought to clarify the role of myogenic mechanisms in cerebral autoregulation in humans. We used moderate oscillatory lower body negative pressure to elicit arterial pressure fluctuations that are within a reasonable physiological range, and used our recently developed analysis based on projection pursuit regression (PPR; Tan, 2012) to explore the arterial pressure – cerebral blood flow relationship before and after calcium channel blockade via nicardipine. The level of oscillatory lower body negative pressure (−30 mmHg) we used results in blood pressure oscillations that are ∼15–20 mmHg in magnitude, similar to blood pressure changes occurring during movement from seated to standing (Narayanan et al. 2001). In addition, PPR is uniquely suited to assess the non-linear characteristics of cerebral autoregulation (Tan, 2012) and intravenously administered nicardipine quickly and effectively blocks calcium channels on vascular smooth muscle with a known time of onset (Cheung et al. 1990; Song et al. 1997) that may not be achieved via oral agents (Eichelbaum & Echizen, 1984). Thus, our approach allowed us to accurately pinpoint the role of myogenic mechanisms in cerebrovascular regulation in humans.
Methods
Subjects
Sixteen volunteers aged 21–30 years (seven females) gave informed consent for this study. Volunteers were non-smokers and free of elevated resting blood pressures and overt cardiovascular and neurological disorders. None of the participants was using prescription medications. All participants had abstained from caffeine-containing beverages for at least 12 h, and from alcoholic beverages and exercise for at least 24 h prior to the study. All protocols were approved by the institutional review board at Spaulding Rehabilitation Hospital (2008-P-000992), and conformed to the Declaration of Helsinki. All studies were conducted between 08:00 and ∼12:00 h.
Experimental protocols
For each subject, a 20-gauge catheter was inserted into an antecubital vein for drug infusion. Subsequently, subjects were instrumented for electrocardiographic lead II (Dash 2000; GE Medical Systems, Waukesha, WI), beat-by-beat photoplethysmographic arterial pressures (Finapres; Ohmeda) and oscillometric brachial pressures (Dash 2000; GE Medical Systems, Waukesha, WI). Oscillometric brachial pressures were employed as a calibration for the continuous Finapres measures. A transcranial Doppler ultrasonograph (2 MHz probe; DWL MultiDop T2; DWL Elektronische Systeme, Singen, Germany) was used to measure cerebral blood flow velocity at the M1 segment of the middle cerebral artery at a depth of 50–65 mm. A Mueller-Moll probe fixation device was used to hold the probe in place. Although this signal is velocity and not flow, several studies suggest that the diameter of the middle cerebral artery remains relatively constant despite changes in blood pressure induced by lower body negative pressure (Serrador et al. 2000) or thigh-cuff deflation (Newell et al. 1994). Moreover, under various stimuli, there are close correlations between relative changes in cerebral flow velocity and flow assessed via various techniques: xenon (133Xe), single-photon emission computed tomography (SPECT), magnetic resonance imaging and direct Fick calculations from the arterial to jugular venous oxygen difference (Larsen et al. 1994, 1995; Jorgensen, 1995). Thus, cerebral flow velocity was used as a surrogate for cerebral flow. Expired CO2 was monitored by an infrared carbon dioxide analyser (Vacuumed) connected to a nasal cannula. All signals were digitized and stored at 1 kHz (PowerLab, ADInstruments, Colorado Springs, CO, USA) and stored for offline analysis.
Following instrumentation, data were collected during 5 min of supine rest. Subsequently, oscillatory lower body negative pressure (OLBNP) was used in a manner similar to that previously described (Hamner et al. 2001, 2004). Briefly, the subject's lower body was sealed in a tank and a vacuum pump connected to a timing mechanism controlled suction intervals. Suction was applied at −30 mmHg across six frequencies (0.03, 0.04, 0.05, 0.06, 0.07 and 0.08 Hz). It is difficult to generate low frequency fluctuations below 0.03 Hz via OLBNP. Below this frequency, the cardiovascular system counter-regulates against the arterial pressure fluctuations elicited by OLBNP before the oscillatory cycle is finished. Nonetheless, we and others have previously shown that cerebral autoregulation is most effective at slow fluctuations (<0.1 Hz; slower than 10 s) (Zhang et al. 1998; Hamner et al. 2004), and thus the range of fluctuations used in our study (0.03–0.08 Hz) represents a range of autoregulatory function (i.e. from a pronounced autoregulatory region at 0.03 Hz to none or a modest one at 0.08 Hz). The duration at each frequency provided ∼15 oscillations so that the range of frequencies encompassing the previously observed cerebral autoregulation (Hamner et al. 2004) could be studied reliably over a relatively short period of time. The order of OLBNP frequencies was not randomized in this study. However, our earlier data show that when the frequencies were randomized, the pressure–flow relationship is qualitatively similar to that observed here (Hamner et al. 2012; Tan, 2012). Therefore, it is unlikely that randomization of OLBNP frequencies would have an impact on our results.
Calcium channel blockade
Following the baseline, subjects received nicardipine hydrochloride as a 3 mg i.v. bolus infused over 8–10 min to block calcium channels and reduce vascular myogenic responsiveness. Nicardipine at this dose effectively blocks calcium channels on vascular smooth muscle based on previously published data and dose–response curves during systemic administration (Cheung et al. 1990; Song et al. 1997). Intravenous nicardipine has a rapid onset of action (1–2 min) with an elimination half-life of 50–70 min in humans (Higuchi & Shiobara, 1980). After nicardipine infusion, data were collected while the subject rested quietly for approximately 5 min before the OLBNP protocol was repeated exactly as described above.
Data analysis
Data were analysed using custom software written in Matlab (version 7.10; Mathworks, Natick, MA, USA) and in R-Language (R Core Team, 2012). The 1 kHz waveforms of arterial pressure and cerebral blood flow were decimated to 5 Hz and low pass filtered with a cutoff of 0.4 Hz to provide mean values. Filtering, as opposed to interpolated means, was used to provide signals that were independent of possible changes in the electromechanical delay from R-wave to generation of a pressure–flow pulse. These mean waveforms as well as breath-by-breath CO2 and beat-by-beat R–R intervals were subsequently averaged within each OLBNP frequency to provide overall means.
Projection pursuit regression was used to quantify the relationship between fluctuations in arterial pressure (independent variable) and cerebral blood flow (dependent variable). To avoid potentially confounding effects of random fluctuations, cerebral flow and arterial pressure were band-pass filtered at the OLBNP frequency with a bandwidth of 0.01 Hz before application of PPR (using signals without band-pass filtering did not change the qualitative shape of the relationship between arterial pressure and cerebral flow but reduced the goodness-of-fit). Briefly, PPR is a non-linear, non-parametric, atheoretical method wherein a model is not posited a priori, but derived directly from the variables of interest (i.e. from arterial pressure and cerebral blood flow), allowing any non-linearity inherent in the input–output relationship to be revealed via inspection of the ridge functions. This is a decided advantage when exploring a relationship that is not yet explicitly defined. PPR modifies the usual linear regression by allowing linear functions of input to be passed through individual non-linearities (so-called ‘ridge functions’) that are determined by best data fits (i.e. without any a priori assumptions on linearity or the shape of the relationship). The outputs from these ridge functions are then summed, and the adequacy of the fit to the data is determined via maximum likelihood. Although using more than one ridge function reduces the mean squared error, it may obscure physiological interpretation of the ridge functions due to potential interactions among them. Therefore, for this research, PPR was limited to only one ridge function.
Subsequently, ridge functions for each individual subject and each frequency of OLBNP were parameterized as a piecewise linear function for subsequent statistical analyses. This parameterization statistically identifies points where the relationship between arterial pressure and cerebral blood flow fluctuations change and the ranges within which the relationship is approximately linear (so as to derive the ‘gain’ of the relationship within each region; see Fig. 1). The gain (i.e. the linear slope) of the pressure–flow relationship within each region (for each OLBNP frequency) provides a measure of the effectiveness of cerebrovasculature in buffering against pressure changes within that region (lower gain indicates more effective counter-regulation of pressure fluctuations). The theory and implementation of PPR are extensively described elsewhere (Friedman & Tukey, 1974; Friedman & Stuetzle, 1981). In addition, we have previously described the application of PPR to characterize the arterial pressure – cerebral blood flow relationship in detail, and demonstrated that this method accurately and consistently characterizes this relationship across individuals and across separate study days (Tan, 2012). To facilitate comparison of our results to earlier studies, traditional cross-spectral coherence and gain were also calculated in a manner similar to that previously described (Hamner et al. 2004).
Figure 1. A representative ridge function at 0.03 Hz arterial pressure fluctuations.
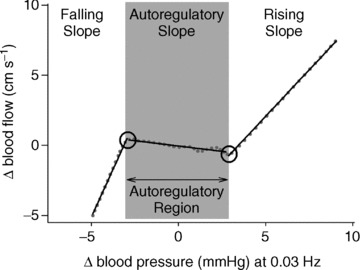
The dotted line shows the ridge function obtained from PPR, and the continuous line shows the piecewise linear fit. The linear slopes within each region wherein the pressure–flow relationship is linear represent the effectiveness of cerebrovasculature to buffer against pressure changes within that region.
Statistics
Normal distribution of all variables was confirmed via Q–Q plots, and Box–Cox transformation was applied to obtain normally distributed values when necessary for subsequent statistical analyses. However, for ease of interpretation, all values presented in the text and tables are in standard units. All comparisons were made via two-way repeated-measures analysis of variance (ANOVA) with treatment (before and after nicardipine) and OLBNP frequency as independent factors. If a significant interaction between frequency and condition was observed, paired t tests were performed to determine at which frequency a significant effect of myogenic blockade occurred. All data are presented as means ± SEM. Differences were considered significant at P < 0.05.
Results
At rest, calcium channel blockade significantly reduced R–R interval, without any effect on mean arterial pressure, cerebral blood flow or end-tidal CO2 (Table 1). During OLBNP, blockade resulted in a tachycardia, a modest but significant elevation in mean arterial pressure, and reductions in mean cerebral blood flow and end-tidal CO2 (Table 2). The reductions in flow were directly related to the reductions in CO2 (Pearson's correlation coefficient r= 0.57, P < 0.01). Blockade increased the magnitude of pressure fluctuations across all frequencies and tended to reduce the magnitude of cerebral blood flow fluctuations at slower (<0.05 Hz) but not faster frequencies (frequency × condition interaction, P= 0.07; Table 3). However, the latter tendency was abolished when the hypocapnia during blockade was taken into account (frequency × condition interaction was not significant, P= 0.36, when end-tidal CO2 was taken into account as a covariate).
Table 1.
Haemodynamic variables before and after calcium channel blockade at rest
| Baseline | Blockade | P* | |
|---|---|---|---|
| R–R interval (ms) | 1070 ± 35 | 887 ± 34 | < 0.01 |
| Mean arterial pressure (mmHg) | 83 ± 3 | 82 ± 3 | 0.71 |
| Cerebral blood flow (cm s−1) | 53 ± 4 | 52 ± 4 | 0.79 |
| End-tidal CO2 (mmHg) | 35 ± 2 | 34 ± 2 | 0.57 |
Values are mean ± SEM. *P value from one-way repeated measures ANOVA.
Table 2.
Haemodynamic variables during oscillatory lower body negative pressure before and after calcium channel blockade
| OLBNP frequency | ||||||||
|---|---|---|---|---|---|---|---|---|
| Two-way ANOVA | Condition | 0.03 Hz | 0.04 Hz | 0.05 Hz | 0.06 Hz | 0.07 Hz | 0.08 Hz | |
| R–R interval (ms) | Freq P= 0.08 | Baseline | 1060 ± 29 | 1091 ± 31 | 1089 ± 33 | 1077 ± 33 | 1078 ± 37 | 1052 ± 36 |
| Cond P < 0.01 | Ca2+ blockade | 931 ± 29 | 954 ± 29 | 967 ± 33 | 960 ± 33 | 950 ± 37 | 950 ± 36 | |
| Freq × Cond P= 0.79 | ||||||||
| Mean arterial | Freq P < 0.01 | Baseline | 83.3 ± 3.8 | 83.9 ± 3.6 | 85.7 ± 3.8 | 86.7 ± 3.9 | 87.0 ± 3.7 | 88.2 ± 3.8 |
| pressure (mmHg) | Cond P= 0.01 | Ca2+ blockade | 86.5 ± 2.9 | 88.5 ± 2.9 | 91.5 ± 3.1 | 92.4 ± 3.5 | 92.1 ± 3.4 | 92.5 ± 3.3 |
| Freq × Cond P= 0.85 | ||||||||
| Cerebral blood | Freq P < 0.01 | Baseline | 55.5 ± 3.8 | 56.5 ± 4.1 | 56.1 ± 4.1 | 54.6 ± 3.9 | 54.4 ± 4.2 | 53.5 ± 4.3 |
| flow (cm s−1) | Cond P < 0.01 | Ca2+ blockade | 48.9 ± 4.0 | 47.8 ± 4.0 | 47.2 ± 3.6 | 47.0 ± 3.7 | 46.4 ± 3.6 | 45.7 ± 3.4 |
| Freq × Cond P= 0.71 | ||||||||
| CO2 (mmHg) | Freq P= 0.40 | Baseline | 32 ± 3 | 33 ± 3 | 33 ± 3 | 33 ± 3 | 32 ± 3 | 32 ± 3 |
| Cond P < 0.01 | Ca2+ blockade | 31 ± 3 | 30 ± 2 | 32 ± 2 | 31 ± 2 | 30 ± 3 | 30 ± 2 | |
| Freq × Cond P= 0.75 | ||||||||
Values are mean ± SEM. Freq, frequency; Cond, condition; Freq × Cond, frequency and condition interaction term.
Table 3.
Spectral power density of arterial pressure and cerebral blood flow fluctuations during oscillatory lower body negative pressure before and after calcium channel blockade
| OLBNP frequency | ||||||||
|---|---|---|---|---|---|---|---|---|
| Two-way ANOVA | Condition | 0.03 Hz | 0.04 Hz | 0.05 Hz | 0.06 Hz | 0.07 Hz | 0.08 Hz | |
| Arterial pressure spectral density (mmHg2 Hz−1) | Freq P= 0.17 | Baseline | 3.97 ± 0.72 | 4.64 ± 0.58 | 5.28 ± 1.07 | 5.33 ± 1.09 | 3.92 ± 0.85 | 3.49 ± 0.52 |
| Cond P < 0.01 | Ca2+ blockade | 5.64 ± 1.00 | 7.58 ± 1.61 | 7.79 ± 1.71 | 7.86 ± 1.39 | 6.66 ± 1.41 | 4.15 ± 0.82 | |
| Freq × Cond P= 0.74 | ||||||||
| Cerebral flow spectral density (cm2 s−2 Hz−1) | Freq P= 0.67 | Baseline | 3.23 ± 0.72 | 3.23 ± 0.72 | 2.54 ± 0.56 | 2.88 ± 0.84 | 2.45 ± 0.62 | 2.09 ± 0.48 |
| Cond P= 0.14 | Ca2+ blockade | 1.87 ± 0.55 | 1.68 ± 0.32 | 2.60 ± 0.46 | 2.42 ± 0.39 | 2.68 ± 0.51 | 2.24 ± 0.53 | |
| Freq × Cond P= 0.07 | ||||||||
Values are mean ± SEM. Freq, frequency; Cond, condition; Freq Cond, frequency and condition interaction term.
Calcium channel blockade did not change the coherence between arterial pressure and cerebral blood flow but reduced the gain relationship between pressure and flow across all frequencies of OLBNP (condition effect P < 0.01; Fig. 2). However, it is possible that the modest hypocapnia during blockade and the subsequent decrease in mean cerebral blood flow impacted the observed cross-spectral relationships. Therefore, we performed an additional analysis using end-tidal CO2 as a covariate. The significant effect of blockade on cross-spectral gain was abolished when the decrease in end-tidal CO2 was taken into account (P= 0.48 for blockade effect when end-tidal CO2 was used as a covariate). Thus, cross-spectral analysis did not show any effect of calcium channel blockade on the relationship between arterial pressure and cerebral blood flow fluctuations.
Figure 2. Linear cross-spectral coherence and gain relationship between arterial pressure and cerebral blood flow at baseline and after calcium channel blockade.
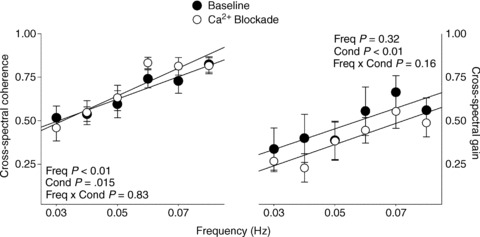
The significant effect of blockade on cross-spectral gain is abolished when the change in end-tidal CO2 is accounted for (P= 0.48).
While cross-spectral analysis showed that the relationship between pressure and flow fluctuations was preserved after blockade, the linear nature of the cross-spectral analysis precludes exploration of alterations in the non-linearities. This is the utility of PPR. PPR explained more than half the variation between arterial pressure and cerebral blood flow fluctuations (average R2= 0.54 ± 0.01; median = 0.56, >0.3 in 90% of data sets), and revealed the characteristic non-linear relationship between pressure and flow fluctuations across frequencies and individuals (see Fig. 1 for a representative subject at baseline during 0.03 Hz OLBNP). The relationship entailed two relatively passive regions wherein changes in arterial pressure are transmitted into cerebral blood flow almost linearly, and an autoregulatory region within which changes in blood pressure were buffered against (Fig. 1).
The most pronounced effect of calcium blockade was evident at the slowest fluctuations. Calcium blockade significantly reduced the falling and rising slopes of the pressure–flow relationship across all OLBNP frequencies (condition effect P < 0.01, condition × frequency interaction P > 0.20 for both slopes), and this effect was largest at 0.03 Hz OLBNP (Fig. 3). In addition, at 0.03 Hz, calcium blockade reduced the range of pressure fluctuations that could be effectively buffered against (from 7.5 ± 1.0 to 3.7 ± 0.8 mmHg) while increasing the autoregulatory slope (from 0.10 ± 0.05 to 0.24 ± 0.08 cm s−1 mmHg−1) (Figs 3 and 4). Given the effect of the modest hypocapnia on cross-spectral gain, we also explored whether hypocapnia explained the observed effects of blockade on the non-linear pressure–flow relationship. When CO2 was used as a covariate, significant effects of blockade on autoregulatory range and slope, as well as rising slope, remained, whereas its effect on falling slope was slightly diminished (P < 0.01 vs. P= 0.09).
Figure 3. Gain relationship between arterial pressure and cerebral blood.
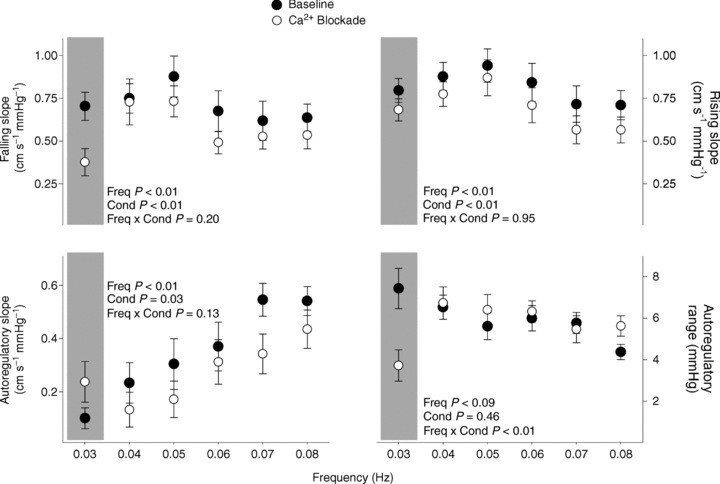
Gain relationship between arterial pressure and cerebral blood within relatively pressure-passive (upper panels) and autoregulatory regions (lower left panel), and the range of blood pressures with which autoregulation is most effective (lower right panel), revealed by PPR.
Figure 4. Characteristic non-linear relationship between arterial pressure and cerebral blood flow fluctuations at 0.03 Hz at baseline and after calcium channel blockade.

The dashed lines show the average across all subjects, and shaded regions denote 95% confidence intervals. The width of the striped bars on each plot denotes the range of autoregulatory region, and their height denotes average autoregulatory gain (±SEM). Higher autoregulatory gain indicates less efficient autoregulation. *P < 0.05.
To provide a better understanding of how changes in the frequency-dependent non-linearities alter cerebral autoregulation, we derived the rate of cerebral blood flow changes as a function of the rate of change in arterial pressure from the non-linear pressure–flow relationships at 0.03 Hz. Given that the autoregulatory range at any OLBNP frequency reflects the absolute magnitude of pressure fluctuations at that frequency, the range and the frequency can provide the rate of change in arterial pressure that can be buffered against: (Δpressure s−1) = (autoregulatory range) × (frequency). The rate of cerebral blood flow changes that result from pressure changes can be obtained from the autoregulatory slope: (Δflow sec−1) = (Δpressure s−1) × (autoregulatory slope). This provides a simple physiological relationship that describes the effectiveness of autoregulation. Figure 5 shows the rates of blood pressure and cerebral flow change before and after blockade. On average, while the rate of pressure change was comparable before and after blockade, the resultant change tended to increase after blockade (paired t test, P= 0.11).
Figure 5. Average (±SEM) rates of blood pressure and cerebral blood flow change at baseline and after calcium channel blockade.
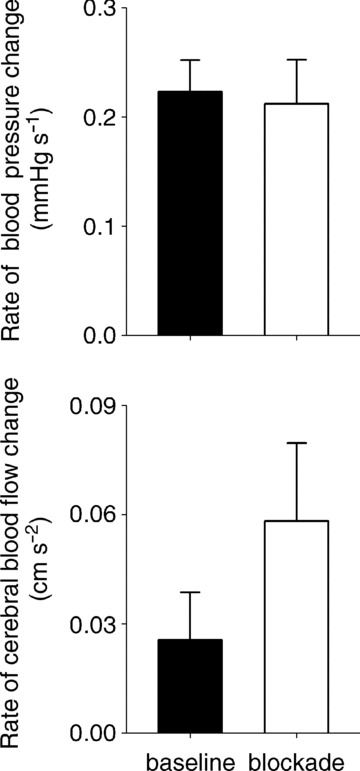
The rate of pressure change was calculated as (Δ pressure s−1) = (autoregulatory range at 0.03 Hz) × (0.03 Hz), and rate of flow change was calculated as (Δ flow s−1) = (Δ pressure s−1) × (autoregulatory gain at 0.03 Hz).
Discussion
Prior studies have shown an important role for autonomic mechanisms in cerebrovascular regulation. For example, systemic alpha-adrenergic (Hamner et al. 2010) and muscarinic (Hamner et al. 2012), as well as complete ganglionic (i.e. sympathetic and parasympathetic) blockade (Zhang et al. 2002) increase the coherence and the gain relationship between arterial pressure and cerebral blood flow fluctuations within the time scales of most active cerebral autoregulation (0.03–0.06 Hz, or ∼15–30 s fluctuations). Hence, intact autonomic control is necessary for effective cerebral autoregulation. Our current results show that, in addition, myogenic mechanisms are among the physiological effectors of cerebrovascular regulation.
After calcium channel blockade, the range of pressures for which cerebral autoregulation is effective was halved, and the slope of autoregulation was increased by almost 5-fold. As a result, after calcium channel blockade, a given rate of change in pressure elicited a change in flow more than twice that observed at baseline. This is consistent with the known physiology of smooth muscle myogenic function. When perfusion pressure increases, greater stretch of smooth muscle activates phospholipase C. This results in a rapid cascade of events leading to inhibition of potassium channels which lowers the membrane potential of the vascular smooth muscle, resulting in influx of calcium that causes vasoconstriction (Harder et al. 1998). Therefore, blockade of calcium channels inhibits myogenic responsiveness, and can alter the relationship between pressure and flow in a number of vascular beds (Gonzalez et al. 1994; Wesselman et al. 1996; Potocnik et al. 2000). Our results strongly suggest a myogenic role in autoregulation and provide a more precise characterization of calcium-mediated myogenic mechanisms in the cerebral vasculature.
While the autoregulatory slope was reduced after blockade at most frequencies, it was higher at the slowest frequency (0.03 Hz). This simply indicates that the frequency dependence of cerebral autoregulation was diminished after calcium blockade. Indeed, while the difference in autoregulatory slopes at the lowest and the highest frequencies was markedly different at baseline (paired t test, P < 0.001), this difference was almost abolished after blockade (P= 0.04). The effect of calcium channel blockade was markedly stronger at lower frequencies (i.e. slower fluctuations; see Fig. 3). This result is consistent with the rate dependency of myogenic responses observed in other vascular beds. For example, in isolated skeletal muscle arterioles, myogenic vasoconstrictive responses to a given rate of pressure change increases with increasing duration of the pressure change, presumably due to cumulative activation of stretch-dependent calcium channels with different activation thresholds (Grande & Mellander, 1978). In addition, myogenic vasoconstrictor responses in isolated arterioles demonstrate a rate-sensitive component (Grande et al. 1977). The rate dependency of myogenic responses observed in isolated arterioles and in our study may support a prior result in humans. Tzeng et al. (2011) found that calcium blockade impaired the gain relationship between cerebral blood flow responses to the rate of pressure change. However, they used a simplified linear approximation of a Windkessel that was derived from data across all subjects, rather than subject specific. Hence, their findings may not be reflective of a consistent response and are not directly comparable to ours.
Our result from cross-spectral analysis show that pharmacological blockade of myogenic mechanisms does not impact the linear gain and coherence of this relationship. This result is similar to prior results (Tzeng et al. 2011). Both the study by Tzeng et al. (2011) and ours were limited by the lowest frequency of pressure–flow fluctuations explored (0.05 and 0.03 Hz, respectively), and it is possible that lower OLBNP frequencies may have resulted in even greater effects of calcium channel blockade on cerebrovascular autoregulation that may have been detected by cross-spectral analysis. However, note that intact cerebral autoregulation manifests itself as a lack of coherence (i.e. a lack of linear dependence) between pressure–flow fluctuations at slow frequencies (Hamner et al. 2004; Tan, 2012). This low coherence limits the utility of cross-spectral analysis at the low frequencies where autoregulation is most active: if the relationship does not display a high coherence, one cannot assess the gain and phase of this relationship with any amount of certainty. In other words, effective counter-regulation of pressure fluctuations creates uncertainty in simple linear estimates of gain and phase relationships in the system. In fact, our current study demonstrates the inadequacy of a linear approach (cross-spectral analysis) to accurately reveal changes in an essentially non-linear phenomenon (autoregulation). When we applied PPR, we found that that the non-linear characteristic of the relationship between slow (∼ 30 s) pressure and flow fluctuations was changed, and that the gain relationship derived from cross-spectral analysis reflected only a quarter of this effect (linear correlation was 0.54, indicating that the percentage variance explained, R2, was 0.29). Moreover, our results show that the rate of blood flow change in response to a given rate of change in blood pressure almost doubled after calcium channel blockade. Hence, while the results from linear cross-spectral measures merely indicate that the cerebral autoregulation is intact, they are inadequate to reveal whether blockade impacts the non-linearity inherent in this relationship.
There are four points that deserve consideration. First, we did not randomize the order of nicardipine administration, and one might suspect that haemodynamic responses may differ between the first and the second application of OLBNP. However, we have previously shown that the cross-spectral relationship between arterial pressure and cerebral blood flow fluctuations does not change even when different levels of OLBNP (−20 and −40 mmHg) are used consecutively within the same experimental session (Hamner et al. 2004), and the pressure–flow relationship assessed via PPR is reproducible across different experimental sessions (Tan, 2012). Therefore, our results are unlikely to be due to a potential difference in responses elicited by the first and second application of OLBNP. Second, we observed a mild but significant reduction in end-tidal CO2. A reduction in end-tidal CO2 during OLBNP has been observed following similar vasodilatory drugs (Hamner et al. 2010) and may result from the combination of venous pooling due to orthostatic stress and vasodilation due to calcium channel blockade. Reduced CO2, in turn, resulted in a reduction in overall cerebral blood flow. However, when we statistically accounted for the change in end-tidal CO2, the significant effect of calcium channel blockade on autoregulatory range and slope as well as rising slope remained. Third, we observed an increase in the magnitude of arterial pressure fluctuations after blockade. This increase is probably due to vasodilation, and may have an impact on the estimated relationship, particularly on the range of pressure fluctuations that can be buffered against (i.e. on autoregulatory range). However, we observed a clear reduction in autoregulatory range after blockade. Thus, if increased pressure fluctuations had an effect on our results, this effect does not counter our conclusion, but instead suggests that the reduction in autoregulatory range is underestimated. Lastly, intravenous nicardipine administration is reported to increase plasma catecholamine levels even after sinoaortic denervation (Damase-Michel et al. 1987), suggesting a possible centrally mediated tonic activation of the sympathetic system. Given this and the prepotent role of the sympathetic system in cerebral autoregulation (Hamner et al. 2010), it may be surmised that a reflex increase in sympathetic tone may have masked the full effect of calcium channel blockade. We cannot rule out this possibility. Nevertheless, if true, this does not counter our conclusion that myogenic mechanisms play an important role in cerebral autoregulation, but in fact it suggests that their importance is underestimated. Therefore, although there may be an interaction between myogenic mechanisms and sympathetic outflow, this interaction does not impact our conclusion that myogenic mechanisms play a significant role in cerebrovascular regulation.
Conclusions
Our results show that while the non-linear nature of the relationship between slow (∼30 s) pressure and flow fluctuations remained, its characteristics were changed. Thus, our results extend prior studies, and show that myogenic, in addition to sympathetic and cholinergic, mechanisms play a significant role in cerebrovascular regulation. Our study further demonstrates the clear advantage of simple but robust approaches over traditional analysis for accurate characterization of alterations in cerebrovascular regulation when the physiological controllers are impaired. This method was previously explored to characterize the relationship between arterial pressure and cerebral blood flow fluctuations (Tan, 2012), but the current work shows that it can provide unique information on the physiological mechanisms underlying cerebrovascular regulation. Future studies are needed to consolidate sympathetic, cholinergic and myogenic effectors of cerebral flow into a comprehensive model of cerebrovascular regulation.
Acknowledgments
None.
Glossary
- OLBNP
oscillatory lower body negative pressure
- PPR
projection pursuit regression
Additional information
Competing interests
The authors have no conflicts of interest to disclose or declare.
Author contributions
J.A.T. conceived and designed the experiments. C.O.T. and J.W.H. performed the experiments and collected the data. C.O.T. analysed the data. C.O.T. drafted the manuscript, and J.A.T. revised it. All authors have seen and approved the final version of the manuscript.
Funding
This research was supported by National Heart, Lung, and Blood Institute Grant HL-093113.
References
- Cheung DG, Gasster JL, Neutel JM, Weber MA. Acute pharmacokinetic and hemodynamic effects of intravenous bolus dosing of nicardipine. Am Heart J. 1990;119:438–442. doi: 10.1016/s0002-8703(05)80065-1. [DOI] [PubMed] [Google Scholar]
- Cooke WH, Ryan KL, Convertino VA. Lower body negative pressure as a model to study progression to acute hemorrhagic shock in humans. J Appl Physiol. 2004;96:1249–1261. doi: 10.1152/japplphysiol.01155.2003. [DOI] [PubMed] [Google Scholar]
- Damase-Michel C, Valet P, Montastruc JL. Nicardipine causes sympathetic activation that does not involve baroreceptor reflex tachycardia in conscious sinoaortic-denervated dogs. Eur J Pharmacol. 1987;142:145–149. doi: 10.1016/0014-2999(87)90665-0. [DOI] [PubMed] [Google Scholar]
- DiBona GF, Sawin LL. Effect of renal denervation on dynamic autoregulation of renal blood flow. Am J Physiol Renal Physiol. 2004;286:F1209–1218. doi: 10.1152/ajprenal.00010.2004. [DOI] [PubMed] [Google Scholar]
- Ederberg S, Westerlind A, Houltz E, Svensson SE, Elam M, Ricksten SE. The effects of propofol on cerebral blood flow velocity and cerebral oxygen extraction during cardiopulmonary bypass. Anesth Analg. 1998;86:1201–1206. doi: 10.1097/00000539-199806000-00011. [DOI] [PubMed] [Google Scholar]
- Eichelbaum M, Echizen H. Clinical pharmacology of calcium antagonists: a critical review. J Cardiovasc Pharmacol. 1984;6(Suppl 7):S963–967. [PubMed] [Google Scholar]
- Endoh H, Honda T, Komura N, Shibue C, Watanabe I, Shimoji K. The effects of nicardipine on dynamic cerebral autoregulation in patients anesthetized with propofol and fentanyl. Anesth Analg. 2000;91:642–646. doi: 10.1097/00000539-200009000-00027. [DOI] [PubMed] [Google Scholar]
- Endoh H, Honda T, Ohashi S, Hida S, Shibue C, Komura N. The influence of nicardipine-, nitroglycerin-, and prostaglandin E1-induced hypotension on cerebral pressure autoregulation in adult patients during propofol-fentanyl anesthesia. Anesth Analg. 2002;94:169–173. doi: 10.1097/00000539-200201000-00032. [DOI] [PubMed] [Google Scholar]
- Friedman JH, Stuetzle W. Projection pursuit regression. Am Stat Assoc. 1981;76:817–823. [Google Scholar]
- Friedman JH, Tukey JW. A projection pursuit algorithm for exploratory data analysis. IEEE Trans Comput. 1974;23:881–889. [Google Scholar]
- Gonzalez R, Fernandez-Alfonso MS, Rodriguez-Martinez MA, Fuertes E, Angulo J, Sanchez-Ferrer CF, Marin J. Pressure-induced contraction of the juxtamedullary afferent arterioles in spontaneously hypertensive rats. Gen Pharmacol. 1994;25:333–339. doi: 10.1016/0306-3623(94)90063-9. [DOI] [PubMed] [Google Scholar]
- Grande PO, Lundvall J, Mellander S. Evidence for a rate-sensitive regulatory mechanism in myogenic microvascular control. Acta Physiol Scand. 1977;99:432–447. doi: 10.1111/j.1748-1716.1977.tb10396.x. [DOI] [PubMed] [Google Scholar]
- Grande PO, Mellander S. Characteristics of static and dynamic regulatory mechanisms in myogenic microvascular control. Acta Physiol Scand. 1978;102:231–245. doi: 10.1111/j.1748-1716.1978.tb06067.x. [DOI] [PubMed] [Google Scholar]
- Hamner JW, Cohen MA, Mukai S, Lipsitz LA, Taylor JA. Spectral indices of human cerebral blood flow control: responses to augmented blood pressure oscillations. J Physiol. 2004;559:965–973. doi: 10.1113/jphysiol.2004.066969. [DOI] [PMC free article] [PubMed] [Google Scholar]
- Hamner JW, Morin RJ, Rudolph JL, Taylor JA. Inconsistent link between low-frequency oscillations: R–R interval responses to augmented Mayer waves. J Appl Physiol. 2001;90:1559–1564. doi: 10.1152/jappl.2001.90.4.1559. [DOI] [PubMed] [Google Scholar]
- Hamner JW, Tan CO, Lee K, Cohen MA, Taylor JA. Sympathetic control of the cerebral vasculature in humans. Stroke. 2010;41:102–109. doi: 10.1161/STROKEAHA.109.557132. [DOI] [PMC free article] [PubMed] [Google Scholar]
- Hamner JW, Tan CO, Tzeng YC, Taylor JA. Cholinergic control of the cerebral vasculature in humans. J Physiol. 2012;590:6343–6352. doi: 10.1113/jphysiol.2012.245100. [DOI] [PMC free article] [PubMed] [Google Scholar]
- Harder DR, Roman RJ, Gebremedhin D, Birks EK, Lange AR. A common pathway for regulation of nutritive blood flow to the brain: arterial muscle membrane potential and cytochrome P450 metabolites. Acta Physiol Scand. 1998;164:527–532. doi: 10.1111/j.1365-201x.1998.tb10702.x. [DOI] [PubMed] [Google Scholar]
- Harrison JM, Girling KJ, Mahajan RP. Effects of target-controlled infusion of propofol on the transient hyperaemic response and carbon dioxide reactivity in the middle cerebral artery. Br J Anaesth. 1999;83:839–844. doi: 10.1093/bja/83.6.839. [DOI] [PubMed] [Google Scholar]
- Higuchi S, Shiobara Y. Comparative pharmacokinetics of nicardipine hydrochloride, a new vasodilator, in various species. Xenobiotica. 1980;10:447–454. doi: 10.3109/00498258009033779. [DOI] [PubMed] [Google Scholar]
- Jorgensen LG. Transcranial Doppler ultrasound for cerebral perfusion. Acta Physiol Scand Suppl. 1995;625:1–44. [PubMed] [Google Scholar]
- Kolb B, Rotella DL, Stauss HM. Frequency response characteristics of cerebral blood flow autoregulation in rats. Am J Physiol Heart Circ Physiol. 2007;292:H432–H438. doi: 10.1152/ajpheart.00794.2006. [DOI] [PubMed] [Google Scholar]
- Larsen FS, Olsen KS, Ejlersen E, Hansen BA, Paulson OB, Knudsen GM. Cerebral blood flow autoregulation and transcranial Doppler sonography in patients with cirrhosis. Hepatology. 1995;22:730–736. [PubMed] [Google Scholar]
- Larsen FS, Olsen KS, Hansen BA, Paulson OB, Knudsen GM. Transcranial Doppler is valid for determination of the lower limit of cerebral blood flow autoregulation. Stroke. 1994;25:1985–1988. doi: 10.1161/01.str.25.10.1985. [DOI] [PubMed] [Google Scholar]
- Leung LY, Wei G, Shear DA, Tortella FC. The acute effects of hemorrhagic shock on cerebral blood flow, brain tissue oxygen tension and spreading depolarization following penetrating ballistic-like brain injury. J Neurotrauma. 2013;30:1288–1298. doi: 10.1089/neu.2012.2715. [DOI] [PubMed] [Google Scholar]
- Matta BF, Lam AM, Strebel S, Mayberg TS. Cerebral pressure autoregulation and carbon dioxide reactivity during propofol-induced EEG suppression. Br J Anaesth. 1995;74:159–163. doi: 10.1093/bja/74.2.159. [DOI] [PubMed] [Google Scholar]
- Narayanan K, Collins JJ, Hamner J, Mukai S, Lipsitz LA. Predicting cerebral blood flow response to orthostatic stress from resting dynamics: effects of healthy aging. Am J Physiol Regul Integr Comp Physiol. 2001;281:R716–R722. doi: 10.1152/ajpregu.2001.281.3.R716. [DOI] [PubMed] [Google Scholar]
- Newell DW, Aaslid R, Lam A, Mayberg TS, Winn HR. Comparison of flow and velocity during dynamic autoregulation testing in humans. Stroke. 1994;25:793–797. doi: 10.1161/01.str.25.4.793. [DOI] [PubMed] [Google Scholar]
- Pires SL, Barres C, Sassard J, Julien C. Renal blood flow dynamics and arterial pressure lability in the conscious rat. Hypertension. 2001;38:147–152. doi: 10.1161/01.hyp.38.1.147. [DOI] [PubMed] [Google Scholar]
- Potocnik SJ, Murphy TV, Kotecha N, Hill MA. Effects of mibefradil and nifedipine on arteriolar myogenic responsiveness and intracellular Ca2+ Br J Pharmacol. 2000;131:1065–1072. doi: 10.1038/sj.bjp.0703650. [DOI] [PMC free article] [PubMed] [Google Scholar]
- R Core Team. R: A Language and Environment for Statistical Computing. [2.14.0] Vienna, Austria: R Foundation for Statistical Computing; 2012. [Google Scholar]
- Serrador JM, Picot PA, Rutt BK, Shoemaker JK, Bondar RL. MRI measures of middle cerebral artery diameter in conscious humans during simulated orthostasis. Stroke. 2000;31:1672–1678. doi: 10.1161/01.str.31.7.1672. [DOI] [PubMed] [Google Scholar]
- Song D, Singh H, White PF, Gadhiali M, Griffin JD, Klein KW. Optimal dose of nicardipine for maintenance of hemodynamic stability after tracheal intubation and skin incision. Anesth Analg. 1997;85:1247–1251. doi: 10.1097/00000539-199712000-00012. [DOI] [PubMed] [Google Scholar]
- Tan CO. Defining the characteristic relationship between arterial pressure and cerebral flow. J Appl Physiol. 2012;113:1194–1200. doi: 10.1152/japplphysiol.00783.2012. [DOI] [PMC free article] [PubMed] [Google Scholar]
- Tzeng YC, Chan GS, Willie CK, Ainslie PN. Determinants of human cerebral pressure-flow velocity relationships: new insights from vascular modelling and Ca2+ channel blockade. J Physiol. 2011;589:3263–3274. doi: 10.1113/jphysiol.2011.206953. [DOI] [PMC free article] [PubMed] [Google Scholar]
- Wesselman JP, VanBavel E, Pfaffendorf M, Spaan JA. Voltage-operated calcium channels are essential for the myogenic responsiveness of cannulated rat mesenteric small arteries. J Vasc Res. 1996;33:32–41. doi: 10.1159/000159129. [DOI] [PubMed] [Google Scholar]
- Zhang R, Zuckerman JH, Giller CA, Levine BD. Transfer function analysis of dynamic cerebral autoregulation in humans. Am J Physiol Heart Circ Physiol. 1998;274:H233–241. doi: 10.1152/ajpheart.1998.274.1.h233. [DOI] [PubMed] [Google Scholar]
- Zhang R, Zuckerman JH, Iwasaki K, Wilson TE, Crandall CG, Levine BD. Autonomic neural control of dynamic cerebral autoregulation in humans. Circulation. 2002;106:1814–1820. doi: 10.1161/01.cir.0000031798.07790.fe. [DOI] [PubMed] [Google Scholar]