

To the Editor
Each human exome contains thousands of nonsynonymous single nucleotide variants (nSNVs) of unknown effect, whose potential impact on biological function is now routinely assessed using computational methods for use in biomedical research and in clinical genome profiling reports. Of the variants receiving a non-neutral (function-damaging) prediction, those at evolutionarily conserved sites are frequently of heightened interest for scientists and clinicians, because these sites are among the most critical for proper protein function. Indeed, a majority of amino acid mutations that have been investigated experimentally are located at ultra-conserved sites, which show no amino acid residue difference in diverse species spanning over five hundred million years of evolution (Supplementary Fig. 1).1 Functionally damaging mutants at these sites are likely to have significant consequences in health and disease.
For these ultra-conserved sites, we estimated the false positive rate (FPR) of Condel2 and PolyPhen-23 by using a standard collection of neutral variants (HumVar3) that was used to train and test these two state-of-the-art tools. Our analysis revealed a very high FPR for Condel (89%) and PolyPhen-2 (75%). For 73% of the neutral nSNVs in HumVar, both tools produced a damaging prediction. The overall accuracy of these tools at ultra-conserved positions was also low (55% and 60%, respectively). Therefore, predictions produced by current computational tools may mislead downstream experimental and clinical investigations aimed at studying functionally important sites.
To remedy this problem, we have developed a method that adaptively fits the best prediction model for nSNV sites evolving at distinctly different rates, as revealed by multispecies comparison (ultra-, well- and less-conserved, Supplementary Fig. 1). Our Evolutionary Diagnosis (EvoD) method considers fundamental evolutionary properties of affected site and amino acid changes, including measures of the biochemical severity and evolutionary probability of the amino acid change, as well as multi-level taxonomic evolutionary rates and timespans of the position affected. Within a sparse-learning framework, the ability of these properties to explain the observed (training) data was evaluated in EvoD for establishing an efficient predictive statistical model (Supplementary Methods). A web server for evaluating novel variants using EvoD is available at http://barn.asu.edu/EvoD.
At ultra-conserved sites, EvoD led to large reductions in the FPR: 55% for Condel and 41% for PolyPhen-2. We retrieved the population allele frequency of the neutral HumVar nSNVs at ultra-conserved sites from a 5,400 exome dataset4 and found that EvoD improved diagnoses across the spectrum of rare (<0.1%) to common (>5%) alleles (Fig. 1a). The balanced accuracy of EvoD was also significantly higher at ultra-conserved sites (Table 1; P < 10-10). Furthermore, EvoD’s performance was consistent across ultra-, well-, and less-conserved sites, whereas Condel and PolyPhen-2 showed uneven performance across these classes (Table 1).
Figure 1.
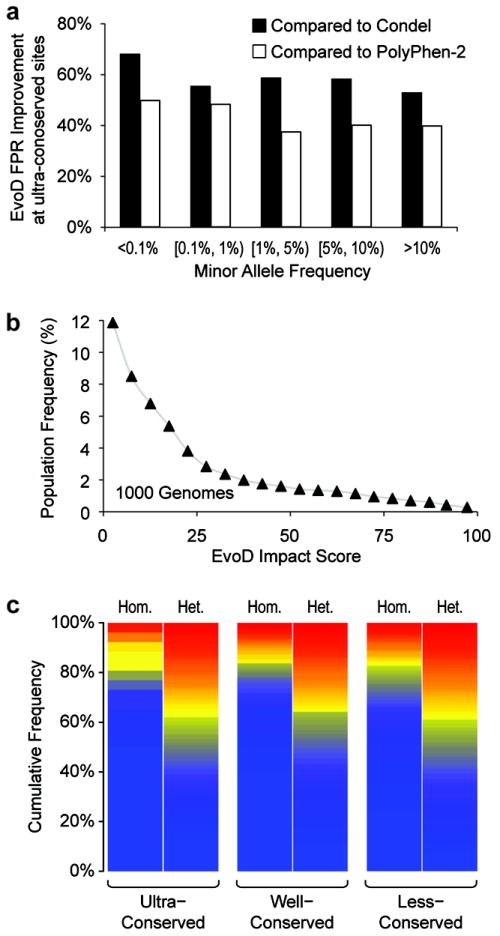
Performance and application of the new EvoD method. (A) Improvement in reducing the False Positive Rate, FPR, for nSNVs occurring with different population frequencies at ultra-conserved sites (Condel: black bars; PolyPhen-2:white bars). Allele frequency data for HumVar2 neutral nSNVs were retrieved from the 5,400 exome dataset4. (B) The relationship of EvoD impact scores and the population frequencies of 244,272 nSNVs from the 1000 Genomes Project. Each point shows the average allele frequency for nSNVs with impact scores in increments of 5. (C) Neutrality heat maps based on EvoD predictions for homozygous (Hom.) and heterozygous (Het.) nSNVs from eight HapMap exomes that occur at ultra-, well- and less-conserved sites. Heat maps were constructed by sorting nSNVs by impact score and assigning colors from dark blue (most neutral) to red (most non-neutral) on a linear scale according to the estimated P-value.
Table 1.
Performance of EvoD, Condel and PolyPhen-2 (PP2) evaluated using the HumVar2 dataset.
| Method | Evol. Consv. | HumVar2 Neutral
|
HumVar2 Disease-associated
|
Diagnosis Rate
|
Accuracy
|
||||||
|---|---|---|---|---|---|---|---|---|---|---|---|
| True Negative | False Positive | False Negative | True Positive | TNR | FPR | FNR | TPR | BAcc | MCC | ||
| EvoD | Ultra | 604 | 317 | 2,528 | 7,045 | 66% | 34% | 26% | 74% | 70% | 39% |
| Well | 2,622 | 1,247 | 1,360 | 4,636 | 68% | 32% | 23% | 77% | 73% | 45% | |
| Less | 6,883 | 3,382 | 4,98 | 1,409 | 67% | 33% | 26% | 74% | 70% | 41% | |
|
|
|||||||||||
| Condel | Ultra | 103 | 818 | 111 | 9,462 | 11% | 89% | 1% | 99% | 55% | 21% |
| Well | 1,500 | 2,369 | 393 | 5,602 | 39% | 61% | 7% | 93% | 66% | 38% | |
| Less | 6,183 | 4,082 | 588 | 1,319 | 60% | 40% | 31% | 69% | 65% | 30% | |
|
|
|||||||||||
| PolyPhen-2 | Ultra | 226 | 664 | 556 | 8,552 | 25% | 75% | 6% | 94% | 60% | 26% |
| Well | 2,585 | 1,356 | 1,190 | 4,589 | 66% | 34% | 21% | 79% | 73% | 45% | |
| Less | 9,398 | 898 | 1,177 | 625 | 91% | 9% | 65% | 35% | 63% | 31% | |
TPR: True Positive Rate (sensitivity), FPR: False Positive Rate, TNR: True Negative Rate (specificity), FNR: False Negative Rate. BAcc: Balanced Accuracy; MCC: Matthews Correlation Coefficient6. BAcc = ½(TPR + TNR)/2; MCC = (TPR×TNR − FPR×FNR)/√([TPR+FPR]×[TPR+FNR]×[TNR+FPR]×[TNR+FN]R).
For each nSNV, the EvoD statistical model also produced an impact score that reflected the degree of neutrality: most neutral = 0 and most non-neutral = 100. In an analysis of 244,272 nSNVs from the 1000 Genomes Project, we found that the population frequency of nSNPs decayed with increasing impact score (Fig. 1b). Therefore, we used the empirical distribution of EvoD scores to determine the statistical significance of a neutral or non-neutral diagnosis (P-value) adaptively for variants at ultra-, well-, and less-conserved sites (Supplementary Fig. 2).
Using EvoD, we analyzed nSNVs in an example set of eight personal HapMap exomes5, which contains a total of 13,372 nSNVs at ultra-conserved sites. 4% of these were predicted to be non-neutral (P < 0.05). An overwhelming majority (94%) of these non-neutral nSNVs were found in heterozygous genotypes that would neutralize the negative effects of recessive alleles. Similar results were observed for 35,367 nSNVs at well- and less-conserved sites, which were also reflected in the neutrality heat maps showing the EvoD impact scores of nSNVs in heterozygous genotypes (Fig. 1c). In contrast, the fraction of homozygous nSNVs with high EvoD impact scores is much smaller at ultra-conserved sites (Fig. 1c). EvoD predicted no more than one homozygous nSNV per exome to be non-neutral (P < 0.05) in ultra-conserved sites, which is consistent with the fact that individuals contributing to HapMap sequencing do not suffer from any known Mendelian disease.
Our results show that an evolution-aware approach to training and testing computational tools leads to better functional predictions for nSNVs, particularly at the most functionally important positions.
Supplementary Material
Acknowledgments
We thank Nevin Gerek, Crystal Hepp, and Mia Champion for many insightful comments, and Joshua Akey for providing the 5,400 exomes data. Ms. Carol Williams provided editorial support. This research was supported by a research grant from the National Library of Medicine (R01 LM010834) and a Postbaccalaureate Research Education Program grant (R25GM071798) from National Institutes of Health.
Footnotes
COMPETING FINANCIAL INTERESTS
The authors declare no competing financial interests.
Note: Supplementary information is available on the Nature Methods website.
References
- 1.Gray VE, Kukurba KR, Kumar S. Bioinformatics. 2012;336 doi: 10.1093/bioinformatics/bts. [DOI] [PMC free article] [PubMed] [Google Scholar]
- 2.Gonzalez-Perez A, Lopez-Bigas N. Am J Hum Genet. 2011;88:440–449. doi: 10.1016/j.ajhg.2011.03.004. [DOI] [PMC free article] [PubMed] [Google Scholar]
- 3.Schmidt S, et al. Nat Methods. 2010;7:248–249. doi: 10.1038/nmeth0410-248. [DOI] [PMC free article] [PubMed] [Google Scholar]
- 4.Tennessen JA, et al. Science. 2012;337:64–69. doi: 10.1126/science.1219240. [DOI] [PMC free article] [PubMed] [Google Scholar]
- 5.Ng SB, et al. Nature. 2009;461:272–276. doi: 10.1038/nature08250. [DOI] [PMC free article] [PubMed] [Google Scholar]
- 6.Matthews BW. Biochim Biophys Acta. 1975;405:442–451. doi: 10.1016/0005-2795(75)90109-9. [DOI] [PubMed] [Google Scholar]
Associated Data
This section collects any data citations, data availability statements, or supplementary materials included in this article.