

Abstract
Language is being increasingly harnessed to not only create natural human-machine interfaces but also to infer social behaviors and interactions. In the same vein, we investigate a novel spoken language task, of inferring social relationships in two-party conversations: whether the two parties are related as family, strangers or are involved in business transactions. For our study, we created a corpus of all incoming and outgoing calls from a few homes over the span of a year. On this unique naturalistic corpus of everyday telephone conversations, which is unlike Switchboard or any other public domain corpora, we demonstrate that standard natural language processing techniques can achieve accuracies of about 88%, 82%, 74% and 80% in differentiating business from personal calls, family from non-family calls, familiar from unfamiliar calls and family from other personal calls respectively. Through a series of experiments with our classifiers, we characterize the properties of telephone conversations and find: (a) that 30 words of openings (beginnings) are sufficient to predict business from personal calls, which could potentially be exploited in designing context sensitive interfaces in smart phones; (b) our corpus-based analysis does not support Schegloff and Sack’s manual analysis of exemplars in which they conclude that pre-closings differ significantly between business and personal calls – closing fared no better than a random segment; and (c) the distribution of different types of calls are stable over durations as short as 1–2 months. In summary, our results show that social relationships can be inferred automatically in two-party conversations with sufficient accuracy to support practical applications.
Keywords: conversation telephone speech, social networks, social relationships
1. Introduction and Motivation
Increasingly language is being exploited to gain insights into human behavior and social interactions. Speech and natural language processing has been applied, for example, to infer opinions from spoken utterances and text [4, 12], social dominance and stance from dialogues [23, 22], speaker’s emotion from speech [11], links between evolution of language and sexual selection [3], summary from dialogues [24], social interaction style from conversations [9], and sexual interaction styles – friendly, flirtatious, awkward, and assertive – in speed-dating conversations [14].
In the same vein, this paper examines the task of inferring social relationships between conversants engaged in everyday conversations, a task that has not been examined in the literature before. This task is motivated by the need to quantify social interactions with one’s social relationships – broadly referred to as social engagement in epidemiological literature – in older adults. Social engagement has been known to influence risk for cognitive decline and depression for more than a decade now [1, 6, 7]. However, further studies to probe this link have been stymied by the lack of objective and automated methods for measuring it. In addition to studying the task, we demonstrate the feasibility of characterizing social engagement from everyday telephone conversations using spoken language processing techniques.
The task of classifying social relationships has not been performed before mostly due to the lack of a naturalistic collection of everyday conversations. Public corpora like Switchboard and Fisher do not capture everyday conversations with different types of social relationships. In this paper (Section 2), we describe our corpus that was collected from a few homes of older adults. To facilitate the data collection, subjects were assured that the data will not be manually transcribed. This precludes labeling all the conversations with types of social relationships by a listener. Instead, we were able to have our subjects self-identify a few numbers. With these limitations, we describe our experiments on classifying relationships using standard natural language processing techniques and report results in Section 4. In addition, to the self-identified relationships, we were able to utilize reverse listing to label a larger number of business calls. For a deeper analysis, we focused on this larger data set to characterize our classifier and differences in nature of these calls. Our observations are reported and discussed in Section 6. Finally, we conclude our paper by summarizing our key contributions, which we hope will stimulate further research on this topic in the community.
2. A Corpus of Everyday Telephone Conversations
Given our larger motivation to study social relationships in the context of studying aging, we collected telephone conversations from 10 volunteers, 79 years or older, over a period of approximately 12 months. The study was approved by the Institutional Review Board at Oregon Health & Science University. All participants signed written informed consent. Subjects were all native English speakers with no hearing or speaking impairment, recruited from the greater Portland area in Oregon, USA. Two pairs of the volunteers were married, hence our collection consisted of calls from 8 households. Audio was captured directly from the phone line with a small, external USB recording device, that was connected to a data collection computer. The recording software also logged information about call direction (incoming vs outgoing), time of call, duration, DTMF tones and caller ID when available.
As mentioned before, privacy-concerns precluded us from manually transcribing or annotating the conversations. Operating within this constraint, we obtained reference labels by asking our subjects to self-identify their relationships. Based on the advice of our clinical study coordinators, who felt comfortable requesting such information from not more than 20 numbers, we shortlisted ten most frequent and ten longest calls for each household. Subjects were asked to identify their relationship with the speakers at these numbers as immediate family, near relatives, close friends, casual friends, strangers and business. Though no further obligations were presented to the subject, providing additional information on speakers not already identified was encouraged.
This corpus is unlike publicly available corpora such as the Switchboard corpus [8], which contains elicited conversations between unfamiliar speakers, discussing a topic from a pre-determined list (e.g. music, crime, air pollution). In contrast, the conversations in our corpus are completely natural, covering a wide range of topics, conversational partners and types of interactions. Moreover, our corpus is comprehensive and includes all outgoing/incoming calls from their homes.
Our corpus consists of 12,067 digitized land-line telephone conversations. In this work, we discard conversations with less than 30 automatically transcribed words. This is done primarily to get rid of spurious and/or noisy recordings related to device failure as well as incorrectly dialed telephone numbers. Moreover, short conversations are less likely to provide enough social context to be useful. This resulted in about 8,558 conversations, of which 2,728 were identified as residential conversations and 1,095 were identified as business conversations using reverse listings. This left 4,395 unlabeled records, for which the reverse listing was either inconclusive or for which the phone number information was missing and/or improperly recorded. Apart from labeling conversations as business or residential, we also labelled them with 3 other binary labels. The labels supplied by subjects to the 20 telephone numbers were grouped into family vs. non-family as well as family vs. residential non-family. We also created familiar vs. non-familiar labels. Here caller IDs appearing 5 or more times in the record are considered familiar. While these methods allowed us to label only a fraction of the calls in our data, their purpose was to build classifiers and then infer the labels for the rest of the data.
One might intuit that surface features such as time and duration of the conversation might help distinguish at least the business calls from residential calls. We find that these simplistic features are not particularly useful. The conversations in our corpus vary in duration from 10 to 10000 words and the distribution of several classes overlap considerably, as shown in Figure 1. There was a slightly higher proportion of calls to/from residences among the very short (< 100 words) and very long (> 1,000 words) conversations. Calls to/from a family members were slightly longer on average, as were those between a familiar contact. However, the differences are not sufficient to effectively discriminate the two classes from duration alone. Figure 1 and Figure 2 show the distributions for call initiation along the residential/business axis. Obvious differences manifest on the office hours (8am – 5pm) boundary, though again, they are inadequate for classification. This likely due to the fact that increasingly business is conducted through call centers with extended hours of operations. These observations were subsequently verified in experiments reported in Section 4. Moreover, the distribution of the distribution of these superficial features are less separable between friends, family and other types of social relationships. In short, we need to exploit the content.
Figure 1.
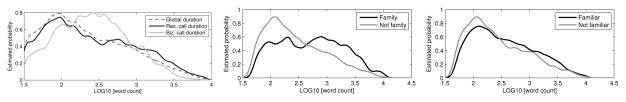
Distribution of durations of conversations with business vs. residential, family vs. non-family, and familiar vs. non-familiar numbers.
Figure 2.
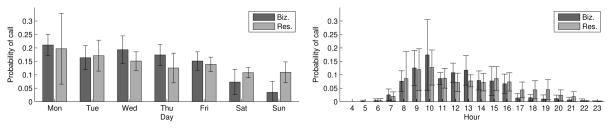
Distribution of conversations by hour of the day and the day of the week, averaged over 8 homes, with one standard deviation error bars.
3. Automatic Speech Recognition
Conversations in our corpus were automatically transcribed using an ASR system. Our ASR system is structured after IBM’s conversation telephony system which was among the top performing systems in the evaluation of speech recognition technology for telephony by National Institute of Standards and Technology [19]. The acoustic models were trained on about 2000 hours of telephone speech from Switchboard and Fisher corpora [8]. The system has a vocabulary of 47K and uses a trigram language model with about 10M n-grams, estimated from a mix of transcripts and web-harvested data. Decoding is performed in three stages using speaker-independent models, vocal-tract normalized models and speaker-adapted models. The three sets of models are similar in complexity with 4000 clustered pentaphone states and 150K Gaussians with diagonal covariances. Our system does not include discriminative training and performs at word error rate of about 24% on NIST RT Dev04. Even though our ASR system was trained on a publicly available corpus of telephony speech, our corpus differs from the training data in its diversity of content and speaking style as noted earlier. Unfortunately, we cannot report accuracy on a more representative sample, as privacy constraints preclude listening to the telephone conversations.
4. Classification Experiments
In this section we examine the utility of using the automatically generated transcripts for classifying social relationships. For these experiments, we utilized the subset of data for which we had labels. Recall that phone numbers associated with family and friends were only identified during an exit interview for a small subset of the data. This leaves the labeling for the majority of the corpus incomplete. Even residential vs. business labels are often missing due to missing or improperly recorded DTMF or caller ID. Furthermore, we expect to use a classifier to reflect the true nature of the conversations and expect to employ the classifier subsequently for correcting the errors, for example when personal conversations occur on business lines and vice versa.
Aside from differentiating personal calls from business calls, we investigate classification of different types of social relationships. These tasks are presented as the following binary classification problems:
Task 1: residential vs business.
Task 2: family vs non-family.
Task 3: familiar vs unfamiliar.
Task 4: family vs other residential.
The categories are not all mutually exclusive and a given conversation can have multiple contextual labels (i.e., familiar and business). The number of conversations in each category are tabulated in Table 1 and from each home in Table 2. Since the class labels are considerably skewed between the four tasks, for ease of comparing the results we balanced the class labels. Note, later, in Section 6, we also report classification results on the skewed distributions to show the performance on a real-world application. Empirically, we found that dropping data from the more numerous classes had little impact on classification performance. We revisit the unbanlanced nature of our classes in Section 5, where we report performance on actual skewed distributions. From the balanced partitions, we randomly select 85% of data to be used in 30-fold cross-validated training. The remaining 15% is used as a verification set to report recognition accuracies. Since we are concerned with the accuracy that can be achieved within the framework of our application for studying aging, where it is feasible to obtain limited set of self-identified labels, we have not partitioned the training and test data to avoid calls from the same home appearing in both partitions. Also, our larger goal is to stratify the calls according to the social relationship irrespective of the telephone numbers, so we disregarded the telephone numbers while partitioning the data. We estimated optimal classifiers using support vector machine (SVM), as implemented in libSVM [5], whose parameters were tuned using cross-validation data. Our experiments showed that removal of stop words, the ten most numerous words in the corpus, was beneficial. Similarly, SVM with radial basis function as kernels, were better than linear classifier. So, they were adopted in all reported results.
Table 1.
Number of conversations belonging to each binary category.
| Class | Res. | Biz. | Family | Not Family | Familiar | Not Familiar |
|---|---|---|---|---|---|---|
| Res. | 2675 | 0 | 1151 | 1523 | 2230 | 445 |
| Biz. | 0 | 1093 | 0 | 1093 | 526 | 567 |
| Family | 1151 | 0 | 1151 | 0 | 1115 | 36 |
| Not family | 1524 | 1093 | 0 | 7240 | 2016 | 5224 |
| Familiar | 2230 | 526 | 1115 | 2016 | 3131 | 0 |
| Not familiar | 445 | 567 | 36 | 5224 | 0 | 5260 |
|
| ||||||
| Total | 2675 | 1093 | 1151 | 7240 | 3131 | 5260 |
Table 2.
Number of total records selected from each home.
| Home | Res. | Biz. | Family | Not Family | Familiar | Not Familiar | Res. Not Family |
|---|---|---|---|---|---|---|---|
| 1 | 12 | 32 | 2 | 102 | 44 | 382 | 16 |
| 2 | 230 | 399 | 45 | 201 | 653 | 356 | 394 |
| 3 | 160 | 180 | 183 | 166 | 487 | 469 | 164 |
| 4 | 15 | 21 | 1 | 76 | 46 | 266 | 30 |
| 5 | 86 | 61 | 43 | 146 | 220 | 401 | 143 |
| 6 | 372 | 147 | 506 | 130 | 952 | 210 | 265 |
| 7 | 87 | 178 | 65 | 208 | 284 | 663 | 143 |
| 8 | 131 | 75 | 306 | 122 | 445 | 384 | 28 |
|
| |||||||
| Total | 1093 | 1093 | 1151 | 1151 | 3131 | 3131 | 1183 |
4.1. N-gram Features
As in other similar classification tasks, we extracted n-gram counts as features from each conversation. In our experiments we found that inverse document frequency features reduced the variance in cross-validation performance. Here, document refers to a single phone conversation. To control sparsity, we use only those n-gram tokens appearing in 10 or more conversations. This gives 7.6K out of 25K total unigrams, 42K of 720K bigrams and 31K of 2.3M trigrams.
The results in Table 3 show that significant and exploitable differences exist for each of the classes investigated. For the majority of our experiments we achieved over 70% classification accuracy; an encouraging result given that features were extracted from erroneous ASR transcripts. The unigram vector with radial basis function (RBF) kernel performed the best, yielding 87.2% accuracy on the residential vs. business classification task. Differentiating with respect to the familiarity of the caller proved to be the most difficult task. This could perhaps be due to the exceptions to the 5 call threshold, for example, between old friends with whom subjects speak infrequently.
Table 3.
Accuracy on evaluation data of binary classifications of four types of interactions; (1): residential vs business, (2): family vs non-family, (3): familiar vs non-familiar, and (4): family vs other residential.
| Features | Task 1 | Task 2 | Task 3 | Task 4 |
|---|---|---|---|---|
| Unigram | 87.2 | 76.6 | 72.9 | 78.0 |
| Unigram (linear) | 86.6 | 76.9 | 70.0 | 76.9 |
| Bigram | 85.1 | 77.8 | 73.5 | 77.2 |
| Trigram | 83.2 | 74.0 | 71.4 | 76.3 |
|
| ||||
| Surface | 69.6 | 72.0 | 62.1 | 75.7 |
| Unigram + Surface | 86.9 | 81.2 | 74.4 | 77.2 |
Compared to the unigram, we observed varying levels of performance loss with higher order n-gram features, both during cross-validation as well as verification. This is similar to observations on other similar tasks. This may be due to higher sparsity or increased effect of ASR errors on them. When only the surface features such as duration of the calls were extracted, the performance was significantly poor in all tasks. When surface features were augmented to unigrams, we found small improvements to the family vs other and familiar vs non-familiar tasks. These comparisons are useful in planning future experiments, while weighing the trade-off between surface features which can be extracted easily without any privacy concerns and the utility of recording the conversations.
4.2. Feature Reduction
Feature reduction via unigram agglomeration can potentially induce more robust features – lessening impact of inherent unigram sparsity, as well as ASR transcription error. We investigated three lower dimensionality feature sets: 1) stemmed words, 2) tags from a hand-crafted dictionary from social psychology, and 3) latent semantic analysis features.
Word stemming is used to map families of words down to a morphological base (e.g. jump, jumps, jumped, jumping → jump). Stemming is employed in many natural language processing applications where the morphological variants of words are viewed as a source of noise on top of the more important content-conveying word stem. We use an implementation of the Porter stemmer for our experiments [21]. While the stemmer does miss many mappings (e.g. geese, goose) it results in a reduction of the dictionary down to approximately 5k stemmed words post-pruning.
We investigate feature reduction with a hand-crafted dictionary of salient words, called LIWC or Linguistic Inquiry and Word Count, employed in a number of social psychology studies [13]. This dictionary attempts to group words into 64 categories such as pronouns, activity words, positive emotion and health using prior linguistic knowledge. The words in each conversations were mapped to these categories and each conversation was represented as a 64-dimension feature vector. The categories have significant overlap and a given word can map to zero or more categories. The clear benefit of LIWC is that the word categories have very clear and pre-labeled meanings. However, the categories do not take into account the context of the words. Moreover, since the categories are not defined under any sort of mathematical criteria, there are no guarantees the resultant feature will possess any useful discriminative information.
As alternative data-driven feature reduction method, we investigated Latent Semantic Analysis (LSA), an unsupervised projection. LSA outputs a weighted combination of unigram frequencies obtained via matrix decomposition [10], and as such the projected features are not easy to interpret. The K most dominant projections are used for the LSA features. Results reported in Table 4, show that the agglomerating features improves performance marginally over unigram features for three tasks. Stemming gives the best performance for two of the four tasks. Relying on hand-crafted LIWC degrades the performance substantially in all tasks. Unsupervised feature reduction using latent semantic analysis helps all tasks, except distinguishing family from other residential relationships, for which unigrams with no reduction gives the best results.
Table 4.
Effect of agglomerating unigrams using different methods on the four tasks; (1): residential vs business, (2): family vs non-family, (3): familiar vs non-familiar, and (4): family vs other residential.
| Features | Task 1 | Task 2 | Task 3 | Task 4 |
|---|---|---|---|---|
| Unigram | 87.2 | 76.6 | 72.9 | 78.0 |
|
| ||||
| Unigram-stem | 87.8 | 76.0 | 74.3 | 76.0 |
| LIWC | 77.1 | 74.6 | 64.8 | 69.1 |
|
| ||||
| LSA-1000 | 86.3 | 76.6 | 72.9 | 62.1 |
| LSA-500 | 87.8 | 76.6 | 73.8 | 63.4 |
| LSA-250 | 86.9 | 76.7 | 73.9 | 64.6 |
| LSA-100 | 83.9 | 77.3 | 70.5 | 66.0 |
| LSA-10 | 79.9 | 74.7 | 71.1 | 70.9 |
4.3. Syntactic Features
Part of speech (POS) tags are often used to characterize syntactic structures in written language and are often to robust to typical ASR errors (e.g., misrecognized names are often still tagged as nouns). We examine them here in order to quantify their relative compatibility with erroneous ASR transcripts. The ASR transcripts (including stop words) were tagged using the Stanford tagger [20]. Using a tag set of 36 categories, various feature vectors were then built.
As evident from results reported in Table 5, relying on POS features alone sacrifices performance. For each task, approximately 10% absolute performance was lost. Though not as discriminative as the lexical unigrams, this result suggests that POS features are very useful. This is significant in applications were privacy requirements do not allow storing information that reveals content. Furthermore, previous work has shown that POS features can be extracted reliably even when ASR performance degrades significantly.
Table 5.
Comparison of POS features in isolation and in combination with unigrams on the four tasks; (1): residential vs business, (2): family vs non-family, (3): familiar vs non-familiar, and (4): family vs other residential.
| Features | Task 1 | Task 2 | Task 3 | Task 4 |
|---|---|---|---|---|
| Unigram | 87.2 | 76.6 | 72.9 | 78.0 |
|
| ||||
| POS-unigram | 78.4 | 66.8 | 59.8 | 67.1 |
| POS-bigram | 77.7 | 70.8 | 63.9 | 70.5 |
| Unigram × POS | 84.2 | 76.3 | 72.5 | 79.8 |
| Unigram + POS | 86.9 | 76.0 | 72.6 | 77.5 |
POS features may complement unigram features and to test this we encoded them in two ways. Depending on context, a word can be associated with different tags. This was coded using features consisting of word-POS tuples, denoted by × sign in the table. Alternatively, POS features can be augmented as additional features to unigrams, denoted by + sign. The POS information benefited the classification of family from other residential calls, the only task which stubbornly refused to show any gains from the three feature reduction methods in Table 4.
4.4. Supervised Feature Selection
From the previous subsections, we have seen that agglomerating unigrams failed to yield any significant increase in robustness. Because of this, we now test the sensitivity of the unigram feature to reduction via supervised feature selection. In contrast to using prior linguistic knowledge to reduce features, supervised feature selection can optimize desirable cost functions. Moreover, supervised feature selection methods can help identify salient features that, for example, signal personal vs business conversations. The most obvious feature selection strategy is to rank the features according to mutual information and prune those with low scores. For this purpose, we estimate point-wise mutual information between lexical features and class labels. For each classification task, we compute the mutual information for each word within the training data. Words with the lowest mutual information are truncated first.
Table 6 shows the results for supervised truncation to 5000, 1000, 500 and 250 unigrams. Further reduction proved impractical due to sparsity and appearance of empty feature vectors. It is immediately apparent that the unigrams are robust to different levels of pruning. Three of the classifiers show benefit from pruning. Further, we examined the top 30 most salient words according to point-wise mutual information for distinguishing business from personal call, where the words easy to interpret. The words, shown in Table 7, are remarkably indicative of the classes. While presence of Bob may be influenced by its relevance for a particular household, subsequent results in Section 6.1 confirms that the classifiers generalize across homes. Personal calls are signaled by reference to social relationships, social activities and such, while business calls are associated with words used in formal settings and customer service. We saw negligible performance degradation given a 1000 word dictionary, and modest performance loss was observed even with a reduction down to 250 words.
Table 6.
Comparison of feature selection using point-wise mutual information with unigrams on the four tasks; (1): residential vs business, (2): family vs non-family, (3): familiar vs non-familiar, and (4): family vs other residential.
| Features | Task 1 | Task 2 | Task 3 | Task 4 |
|---|---|---|---|---|
| Unigram | 87.2 | 76.6 | 72.9 | 78.0 |
|
| ||||
| MI-5K | 87.8 | 77.5 | 72.6 | 77.5 |
| MI-1K | 86.6 | 78.6 | 73.2 | 76.0 |
| MI-500 | 84.5 | 78.3 | 73.5 | 76.6 |
| MI-250 | 85.1 | 77.2 | 72.8 | 76.6 |
Table 7.
Words selected using point-wise mutual information for tasks (1): business/residential label, (2): family/non-family, (3): familiar/non-familiar and (4): family/other residential.
| Task 1 | Task2 | Task3 | Task4 |
|---|---|---|---|
| dinner, customer, quality, hello, representative, thank, red, enjoy, goodness, scared, cute, purposes, grand, o’clock, press, pictures, body, girls, monitored, downstairs | few, glad, already, computer, killed, eat, weekend, guy, dad, moved, hair, awhile, worked, email, mom, often, heard, went, loved, spend | Friday o’clock, morning, tomorrow, leave, early, left, until, trying, feel, enough, she’s, ready, yesterday, big, him, after, high, definitely, house | Bob, taught, weekend, talks, brought, apart, hope, his, cheat, mom, hair, computer, loved, grandma, glad, went, thanks-giving, choice, killed, weather |
4.5. Unsupervised Feature Selection using Latent Dirichlet Allocation Model
Unsupervised clustering and feature selection can make use of data for which we have no labels. In our case, unlabeled data amounts to about 50% of our corpus. Motivated by this consideration, we examined unsupervised clustering using Latent Dirichlet Allocation or LDA [2]. Unlike LSA, LDA creates topics with associated vocabulary, hence the new features can more readily be interpreted like in other feature selection techniques.
LDA models a document as a bag of words and generates a document by: (a) sampling a topic distribution θ for the document using a per-document Dirichlet topic distribution with a hyper-parameter α, (b) sampling a topic z for each word in the document using a multinomial distribution using the topic mixture θ, and (c) sampling the word from a per-topic multinomial word distribution with a hyper-parameter β [2]. The number of topics are assumed to be given. The per-document topic distribution and the per-topic word distribution can be automatically estimated to maximize the likelihood of training data. The sparsity of these two distributions can be controlled by tweaking α and β; lower values increase sparsity.
For our experiments, we estimated a maximum likelihood K-topic LDA model from the 8.3K training set. Experimentally, we found best cross-validation results were obtained when α and β were set to 0.01 and 0.1 respectively. Conversations were represented by a K-dimensional feature vector corresponding to the log-topic-distribution under the estimated model, and SVM classifiers were trained on them. From the results of the LDA experiments in Table 8 for different numbers of topics, we find that the unsupervised features do not improve performance over unigrams. They are effective in differentiating business from personal calls, achieving an accuracy of 85.84% with mere 30 topics – giving it a significant advantage over LSA of similar size. When the number of clusters are reduced to two, the LDA model still separates the business and residential conversations with relatively high accuracy. This suggests the LDA model was able to approximately learn our classes in an unsupervised manner.
Table 8.
Comparison of unsupervised LDA topic features with unigrams on the four tasks; (1): residential vs business, (2): family vs non-family, (3): familiar vs non-familiar, and (4): family vs other residential.
| Features | Task 1 | Task 2 | Task 3 | Task 4 |
|---|---|---|---|---|
| Unigram | 87.2 | 76.6 | 72.9 | 78.0 |
|
| ||||
| LDA-50 | 83.5 | 72.5 | 63.3 | 70.8 |
| LDA-30 | 85.8 | 71.7 | 63.4 | 69.9 |
| LDA-10 | 81.4 | 74.0 | 65.6 | 73.7 |
| LDA-2 | 77.4 | 69.9 | 58.0 | 67.9 |
Indeed, when peering into words which constituted the topics, a business vs personal trend did seem to emerge. Table 9 lists words strongly associated with the two topics and clearly the unsupervised clustering appears to have automatically differentiated the business-oriented calls from the rest. On closer examination, we found that most of the probability was distributed in a limited number of words in the business-oriented topic. On the contrary, the probability was more widely distributed among words in the other cluster, reflecting the diversity of content in personal calls.
Table 9.
Per-topic word distribution learned using unsupervised clustering with LDA.
| Topic 1 | Topic 2 |
|---|---|
| Invalid, helpline, eligibility, transactions, promotional, representative, mastercard, touchtone, activation, nominating, receiver, voicemail, digit, representatives, Chrysler, ballots, staggering, refills, resented, classics, metro, represented, administer, transfers, reselling, recommendations, explanation, floral, exclusive, submit | Adorable, aeroplanes, Arlene, Astoria, baked, biscuits, bitches, blisters, blue-grass, bracelet, brains, bushes, calorie, casinos, Charlene, cheeses, chit, Chris, clam, clientele, cock, cookie, copying, crab, Davenport, debating, dementia, dictionary, dime, Disneyland, eek, Eileen, fascinated, follies, fry, gained |
In summary, we find that the unigram features are effective in characterizing the four types of distinctions in social interactions. The best accuracy in classifying business calls from personal calls (87.8%) was achieved with stemmed unigrams or 500 dimension LSA projection of unigrams. Unigrams with surface features gave the best performance of 81.2 and 74.4 for classifying family vs. non-family and familiar vs. non-familiar respectively. However, most of the information is contained in the unigrams and the additional contributions of surface features are very small. Tuples of unigrams and POS were most effective (79.8%) in distinguishing family from other residential calls. When there is no overlap of conversations from the same phone number between test and train, the unigrams perform at 83.6%, 73.0%, 70.0% and 70.2% for the four tasks in the order reported in Table 3 and the trends appear to be consistent for experiments that were repeated, namely, with feature selection using mutual information.
5. Performance on Actual Skewed Class Distributions
All of the above results were evaluated on balanced class distributions so that the difficulty of the task and different features can be easily compared across tasks. In realistic applications, the distributions of calls belonging to different types of relationships are considerably skewed. This was gauged by evaluating our classifiers on the available data not utilized in training them. The results are reported in Table 10 in terms of area under the curve (AUC). For comparison, we include the performance with only the surface features, which can be extracted without recording any speech. Clearly, the classifier based on the content and unigram features provides considerable improvement over the surface features in all cases. These classification results were achieved with bag of words model of conversations, which implies that privacy concerns in future studies may be addressed by transcribing the data near the source and possibly encoding the data using an encrypted dictionary.
Table 10.
Performance, area under the curve (AUC), on evaluation data for the four classification tasks; (1): residential vs business, (2): family vs non-family, (3): familiar vs non-familiar, and (4): family vs other residential.
| Features | Task 1 | Task 2 | Task 3 | Task 4 |
|---|---|---|---|---|
| Surface | 0.80 | 0.79 | 0.66 | 0.81 |
| Unigram | 0.94 | 0.87 | 0.82 | 0.88 |
6. Error Analysis
Having examined both supervised and unsupervised feature reduction and feature selection strategies, we now turn our attention to understanding the types of errors incurred by automatic classification in our corpus and the nature of these calls. As mentioned earlier, we have a much larger corpus of labeled data on distinguishing business from personal calls, and so we largely restrict our analysis to this task. For these experiments, we rely on simple lexical unigram features to avoid the need for empirically optimizing over additional feature selection or reduction parameters.
6.1. How Does Classification Accuracy Vary Across Homes?
The number of conversations that each residence contributed to training and test sets varied considerably, as shown in Table 1. To rule out the possibility that the average accuracy was not dominated by one or two homes, we computed the performance on held-out data for each home separately. Results, reported in Table 11, show that clear discrimination was achieved for each home. Encouragingly, homes 4 and 8 achieved very high classification scores despite cumulatively contributing less than 4% of the training corpus. Thus, our classifier appears to generalize across all homes.
Table 11.
Classification accuracy on evaluation data observed for each of the eight homes.
| Home | Records | Accuracy |
|---|---|---|
| 1 | 8 | 87.5 |
| 2 | 103 | 84.5 |
| 3 | 42 | 81.0 |
| 4 | 6 | 100.0 |
| 5 | 27 | 77.0 |
| 6 | 74 | 94.6 |
| 7 | 25 | 88.0 |
| 8 | 43 | 90.7 |
6.2. How Does Accuracy Vary With Conversation Length?
Classification accuracy is expected to improve with the length of conversations as longer conversations provide more evidence. In order to understand how quickly the accuracy degrades for shorter conversations, we stratified the conversations into 5 groups according to percentile length. The lengths were measured in terms of automatically recognized words. The performance for each group in the held-out set is reported in Table 12. As expected, the accuracy increases with length. Interestingly, performance appears to plateau at about 200–300 words. That is, about 2 minutes of conversation is sufficient to classify conversations with the highest performance.
Table 12.
Classification accuracy on 5 groups of conversations with different lengths. The split column gives the label distribution for the corresponding quintile.
| Word Counts | Split | Accuracy | |
|---|---|---|---|
| Percentile | Counts | Res/Biz | |
| 0–20 | 30–87 | 62.1/37.9 | 75.8 |
| 20–40 | 88–167 | 48.5/51.5 | 83.3 |
| 40–60 | 168–295 | 39.4/60.6 | 90.9 |
| 60–80 | 296–740 | 40.9/59.1 | 93.9 |
| 80–100 | 741+ | 59.4/40.6 | 93.8 |
6.3. How Consistent is the Classification Across Conversations from the Same Telephone Number?
Our corpus contains multiple conversations between the same conversants with as many as 300 in certain cases. By and large, we expect the type of conversation between same individuals to be consistent across all instances. To examine the consistency of the automatic classifier, we computed the average classification rate across all conversations between each pair of coversants. Then, plotted the number of conversants in each bin of accuracy, as shown in Figure 3. The majority of phone numbers are consistently classified correctly. Out of 125 conversants, 50 were recognized perfectly. At the other end of the spectrum, 5 conversants were consistently inaccurate (0–5% accuracy). Given the distribution of accuracies in Figure 3, these conversants are somewhat anomalous. On investigating further, we found that 2 were reference label errors – businesses mislabeled because of a residential address. The remaining 3 were legitimate business numbers consistently misclassified as personal calls. One of them, for example, belonged to a lighting goods store with 65 calls. While the errors may certainly indicate deficiencies of the classifier, these conversations we cannot rule out that the conversations are not social in nature.
Figure 3.
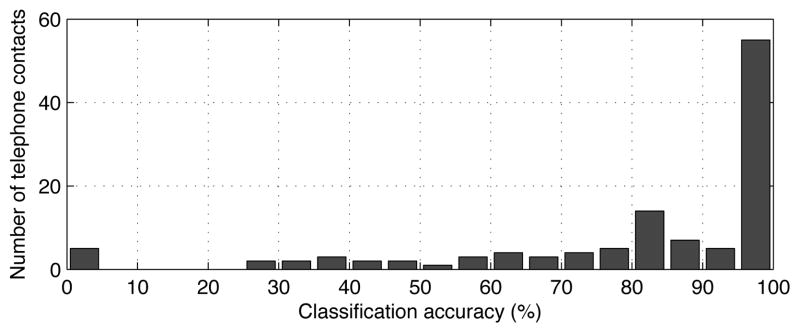
Histogram of classification accuracy of conversations from a given telephone number.
6.4. Can SVM Score Serve as a Confidence Measure?
For downstream processing, the ability to trade-off precision for recall is extremely useful. One way to achieve a flexible operating point is to treat the SVM score as a confidence measure and threshold it as appropriate. We utilize the absolute value of SVM score, the distance from the separating hyperplane, as a confidence measure. Ideally, a high confidence should correspond to high accuracy. To examine this correlation in detail, we divide the conversations in the held-out set into 5 groups based on their confidence and compute the average accuracy for each group separately, as reported in Table 13. Here, results shows clear correlation between classifier confidence and accuracy. The high correlation between confidence level and accuracy allows us to achieve an arbitrary precision, by selectively ignoring ‘hard to classify’ examples. Figure 4 shows accuracy at different levels of confidence-based pruning, with an area under the curve of 0.94. As an aside, both classes appear to have balanced distribution on both sides of the boundary with the possible exception of 80–100 percentile which has a disproportionate percentage (70%) of business calls. Further investigation revealed that many of these conversations correspond to automated customer service calls, calls which tended to have a very limited and thus recognizable vocabularies.
Table 13.
Classification accuracy for 5 groups of conversations with different SVM confidence or scores. The split column gives the label distribution for the corresponding quintile
| SVM Margin | Split | Accuracy | |
|---|---|---|---|
| Percentile | Range | Res/Biz | |
| 0–20 | 0–0.345 | 47.7/52.3 | 61.5 |
| 20–40 | 0.345–0.74 | 55.2/44.8 | 80.6 |
| 40–60 | 0.74–1.06 | 65.2/34.9 | 97.0 |
| 60–80 | 1.06–1.48 | 51.5/48.5 | 98.5 |
| 80–100 | 1.48+ | 29.7/70.3 | 100.0 |
Figure 4.
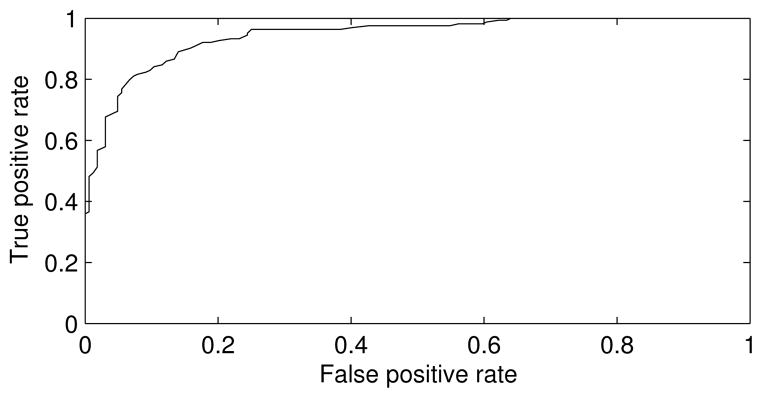
Receiver operator characteristic curve for the business classifier.
7. Nature of Everyday Telephone Conversations
Sociologists like Harvey Sacks and Emanuel Schegloff have analyzed everyday telephone conversations for more than a decade. Their analyses were limited to a narrow domains and a few hundred examples, handicapped by the unavailability of a naturalistic corpus and reliance on manual transcripts. Free from both these constraints, our corpus affords an opportunity to probe the nature of everday conversations using more data, both in number and diversity, and automated transcripts. We examine a few properties of conversations that are easily amenable for computational corpus-based analysis.
7.1. Openings and Closings
Schegloff and Sacks assert openings (beginnings) and closings (ends) of telephone conversations have certain identifiable structures [15]. For example, the structure of openings facilitates establishing identity of the conversants and the purpose of their call [16]. In the context of closing, they developed the idea that by using topically empty objects – they call pre-closings – such as ‘well’, ‘okay’, and ‘so’, conversants may pass their turn to allow the other party to start a new topic or mention any unmentioned mentionables before conversation ends [17]. They characterize two types of calls in the context of pre-closings. First, ‘monotopical’ or task-oriented business calls, where closing is performed as soon as the topic is closed. Second, calls where the number of topics are not so predefined, where pre-closings are utilized as floor-offering-exchanges. These pre-closings may be captured by unigrams from the endings and may help characterize personal calls.
Given the above assertions, we expect openings and closings to be informative about the type of conversations. Using our classifier, we compare the accuracy of predicting the type from openings, closings and random segments of the conversations. For different lengths of the three types of segments, the observed performance of the classifier is plotted in Figure 5. The results for the random segment were computed by averaging over 100 trials. Several important results are immediately apparent. Openings possess much higher utility than closings – at least, for the unigram feature. This is consistent with general intuition that the opening exchange is expected to clarify the nature and topic of the call. Closings of the automatic transcripts were found to be only as informative as random segments from the conversations. Thus, our observations do not support the pre-closing [17]. Perhaps, these pre-closings need additional contextual information to be useful indicators. A less intuitive finding is the fact that increasing the length of the opening segment does not improve its performance. We find that a 30-word segment from the opening appears to be sufficient to achieve high classification accuracy (87.20%).
Figure 5.

Comparison of classification accuracy in predicting the type of conversation from openings, closings and random segments. Error bars are one standard deviation.
7.2. Inherent Ambiguity in Short Conversations
At first glance, the results from the previous section appear to contradict the observation in Table 12 that accuracy degrades as conversations become shorter. This seems to suggest short conversations suffer poor recognition due to properties beyond a simple sparsity effect. To test this, we investigated the differences in short and long conversations in greater detail. We again separate calls into quintile groups based on word counts. However, we now calculate all features from a 30-word opening – eliminating effects directly related to duration of conversations. The results in Table 14 show that the ability to predict the type of conversation does not degrade when long conversations are truncated. In comparison to Table 12, there is a surprisingly small performance loss due to the artificial truncation. These observations suggest that the long and short conversations are inherently different in nature, at least in their openings. One potential reason could be that individuals are more careful in enunciating the reasons for calling if an extended phone conversation is anticipated.
Table 14.
Classification accuracy when the conversations are truncated to 30-words of openings, illustrating that the originally longer conversations are still easier to classify than originally shorter one.
| Original Length (# Words) | Split | Accuracy | |
|---|---|---|---|
| Percentile | Range | Res/Biz | |
| 0–20 | 30–87 | 62.1/37.9 | 78.6 |
| 20–40 | 88–167 | 48.5/51.5 | 82.8 |
| 40–60 | 168–295 | 39.4/60.6 | 91.4 |
| 60–80 | 296–740 | 40.9/59.1 | 87.8 |
| 80–100 | 741+ | 59.4/40.6 | 93.4 |
8. Estimating Distribution of Social Calls Robustly In a Shorter Duration Using Our Classifiers
As mentioned earlier, one of our goals is to estimate distributions of social calling habits for older adults so that we can study how it relates to subsequent cognitive decline. Moreover, for conducting future studies on larger cohorts, it is necessary to understand how the distribution changes with durations of observation windows. We computed reference distributions for the four relationship types using all the available data (spanning the whole year) with reference labels, a binary distribution in each case. Then compared this empirical distribution with estimates from shorter durations using Shannon-Jensen divergence. For each home, we averaged the divergence between the reference distribution and all instances of shorter duration window by sliding the window over the span of the year. The divergence were then averaged across all homes.
Initially, we estimated the shorter durations using only the self-reported reference labels, which covered a relatively small portion of the data. Alternatively, we infer the label on the unlabeled data using the classifiers and estimate the distributions. The results are juxtaposed in Figure 6.
Figure 6.

Jensen-Shannon divergence between empirical distributions of conversation types computed over a year and over shorter durations for the 4 binary categories. The thick and thin lines correspond respectively to estimates from all the available data and only from the data for which labels are available.
When we use only the reference labels, the distribution diverges substantially when the observation window is reduced to under 6.5 months. Using all the available calls with estimated labels significantly improves the divergence over shorter durations. The distribution of familiar and non-familiar did not benefit from the unlabelled data since the coverage for the two classes are already high. For the other three cases, the unlabelled data effectively reduces the observation duration required to estimate the distributions with a given divergence of true distribution. For example, in the case of business vs. residential, distribution estimated from observation of 1 month with all the data has the same divergence (0.025) as that using 5 months with only the reference labels. This demonstrates an additional utility of our classifiers in the context of understanding social calling habits or engagement of older adults.
9. Conclusions and Discussion
This paper has several contributions. Firstly, the paper examines a novel task in spoken language processing that has not been attempted before, the task of classifying social relationships between two conversants. We demonstrate that standard natural language processing techniques can, on balanced test sets, achieve accuracies of about 88%, 81%, 74% and 80% in classifying business from residential calls, family from non-family, familiar from non-familiar and family from other residential calls respectively.
Note, since we are concerned with the accuracy that can be achieved within the framework of our application for studying aging, where it is feasible to obtain limited set of self-identified labels, we have not partitioned the training and test data to avoid calls from the same home appearing in both partitions. Also, our larger goal is to stratify the calls according to the social relationship irrespective of the telephone numbers, so we disregarded the telephone numbers while partitioning the data. When there is no overlap of conversations from the same phone number between test and train, the unigrams perform at 83.6%, 73.0%, 70.0% and 70.2% respectively in the same order of tasks and the trends appear to be consistent for experiments that were repeated, namely, with feature selection using mutual information. On realistic skewed distribution of telephone calls, our classifiers achieve an AUC performance of about 0.94, 0.87, 0.81 and 0.88 respectively in the same order of tasks.
We find that the lexical features or words were significantly more useful in differentiating relationships than surface features. The above mentioned performances were achieved with bag-of-words features or unigrams. This implies that in future studies when privacy is a concern that precludes recording the audio, automatic speech recognizers can be employed at the source and the conversations can be encoded into fixed length vectors. Remarkably, only 30-words at the beginning of the conversations provided most information about the nature of the conversations. Both these results has potential applications in designing context-sensitive user interface in smartphones.
We investigated several strategies for feature reduction and feature selection. Stemming was found to be helpful in classifying family from non-family and familiar from non-familiar. Unsupervised feature reduction using latent semantic analysis gave consistent performance gains over unigram features in all the four classification tasks, except family vs other residential calls. This task benefited from feature tuples consisting of part-of-speech tags and unigrams. Unsupervised topic modeling using latent Dirichlet allocation did not improve performance over baseline, however the classifiers performed remarkably well fewer parameters in comparison to other forms of feature reduction or feature selection. Remarkably, when the number of unsupervised topics are limited to two, they naturally partition the data into business vs personal calls, with an accuracy of about 77.4%, well above chance. The resulting per topic word distribution shows that probability is spread relatively uniformly across words when the calls are of personal nature. This captures the intuitive notion that the personal calls may digress to many topics and contain a larger variety of words than business calls, where probability was found to concentrated in fewer words.
Our corpus of naturalistic telephone conversations affords us an opportunity to characterize a few properties of everday conversations using computational corpus-based analysis. Comparison of different segments of conversations reveal that conversants clarify the nature of the call right at the outset, as expected. This is in contrast with endings or other random segments of the conversations. This is similar to observations by Schegloff and Sacks. However, our classifiers, learned from unigrams, do not seem be find pre-closings, that is, topical empty words such as ‘okay’, ‘well’, and ‘so’, in the endings that characterize more open-ended personal calls than ‘monotopical’ business calls. Perhaps, this may be because our unigram features do not capture the context necessary to utilize them. Though we did find that shorter conversations were harder to classify, this appears to be a result of inherent ambiguity in such calls rather than sparseness problems. Using our classifiers, we are able to utilize calls with missing information and estimate the distribution of social calls with fewer months of observations, 1 month instead of 5 months, which is helpful in designing future studies on social relationships.
Obvious extensions to this work includes separating speakers, extracting social interaction cues from dialogue structures [23], detecting affect and emotional support [4, 18], extracting conversational topics and summaries [24], and even romantic interests [14]. Essentially, we have demonstrated the feasibility of assessing social engagement in older adults through their telephone conversations. Since our work largely utilizes words, not acoustics, our analysis of everyday interactions is relevant for future work on social engagement using other mediums of communication such as cell phone, email or Internet-based social networking, media more relevant to younger population. We hope our results will inspire more research on inferring social relationships and quantifying engagement objectively for clinical trials that are targeted toward improving social and emotional well-being.
We introduce a novel task, that of inferring social relationships from everyday conversations.
We collected a corpus of natural telephone conversations, unlike any other publicly available corpora.
We show that 30 words of the beginning of a conversation is sufficient to infer the relationship accuracy.
We show that classifiers are useful in estimating the social engagement using conversations spanning a 3-months.
Acknowledgments
This research was supported in part by NIH Grants 1K25AG033723, P30 AG008017, 5R01AG027481, and P30 AG024978, as well as by NSF Grants 1027834, 0964102, and 0905095. Any opinions, findings, conclusions or recommendations expressed in this publication are those of the authors and do not necessarily reflect the views of the NIH. We thank Nicole Larimer for help in collecting the data, Maider Lehr for testing the data collection devices and Katherine Wild for early discussions on this project. We are grateful to Brian Kingsbury and his colleagues for providing us access to IBM’s attila software tools. We thank the reviewers for their comments and suggestions.
Footnotes
Publisher's Disclaimer: This is a PDF file of an unedited manuscript that has been accepted for publication. As a service to our customers we are providing this early version of the manuscript. The manuscript will undergo copyediting, typesetting, and review of the resulting proof before it is published in its final citable form. Please note that during the production process errors may be discovered which could affect the content, and all legal disclaimers that apply to the journal pertain.
Contributor Information
Anthony Stark, Email: starkan@ohsu.edu.
Izhak Shafran, Email: zakshafran@gmail.com.
Jeffrey Kaye, Email: kaye@ohsu.edu.
References
- 1.Bassuk SS, Glass TA, Berkman LF. Social disengagement and incident cognitive decline in community-dwelling elderly persons. Ann Intern Med. 1999;131 (3):165–173. doi: 10.7326/0003-4819-131-3-199908030-00002. [DOI] [PubMed] [Google Scholar]
- 2.Blei DM, Ng AY, Jordan MI. Latent dirichlet allocation. J Mach Learn Res. 2003 Mar;3:993–1022. [Google Scholar]
- 3.Briscoe T. Language learning, power laws, and sexual selection. Mind and Society. 2008;7:65–76. [Google Scholar]
- 4.Camelin N, Bechet F, Damnati G, De Mori R. Detection and interpretation of opinion expressions in spoken surveys. Audio, Speech, and Language Processing, IEEE Transactions on. 2010 Feb;18 (2):369–381. [Google Scholar]
- 5.Chang C-C, Lin C-J. Libsvm : a library for support vector machines. ACM Transactions on Intelligent Systems and Technology. 2011:2. [Google Scholar]
- 6.Fabrigoule C, Letenneur L, Dartigues JF, Zarrouk M, Commenges D, Barberger-Gateau P. Social and leisure activities and risk of dementia: a prospective longitudinal study. Journal of the American Geriatrics Society. 1995;43 (5):485–490. doi: 10.1111/j.1532-5415.1995.tb06093.x. [DOI] [PubMed] [Google Scholar]
- 7.Glass TA, De Leon CFM, Bassuk SS, Berkman LF. Social engagement and depressive symptoms in late life: longitudinal findings. Journal of aging and health. 2006;18 (4):604–628. doi: 10.1177/0898264306291017. [DOI] [PubMed] [Google Scholar]
- 8.Godfrey J, Holliman E, McDaniel J. SWITCHBOARD: Telephone speech corpus for research and development. IEEE International Conference on Acoustics, Speech, and Signal Processing; 1992. pp. 517–520. [Google Scholar]
- 9.Jurafsky D, Ranganath R, McFarland D. Extracting social meaning: Identifying interactional style in spoken conversation. Proceedings of Human Language Technologies: The 2009 Annual Conference of the North American Chapter of the Association for Computational Linguistics. Association for Computational Linguistics; Boulder, Colorado. Jun, 2009. pp. 638–646. [Google Scholar]
- 10.Landauer TK, Foltz PW, Laham D. Introduction to latent semantic analysis. Discourse Processes. 1998:259–284. [Google Scholar]
- 11.Mower E, Mataric M, Narayanan S. A framework for automatic human emotion classification using emotion profiles. Audio, Speech, and Language Processing, IEEE Transactions on. 2011 Jul;19 (5):1057–1070. [Google Scholar]
- 12.O’Connor B, Balasubramanyan R, Routledge B, Smith N. From tweets to polls: Linking text sentiment to public opinion time series. International AAAI Conference on Weblogs and Social Media.2010. [Google Scholar]
- 13.Pennebaker JW, Francis ME, Booth RJ. Linguistic Inquiry and Word Count. Lawerence Erlbaum Associates; Mahwah, NJ: 2001. [Google Scholar]
- 14.Ranganath R, Jurafsky D, McFarland DA. Detecting friendly, flirtatious, awkward, and assertive speech in speed-dates. Computer Speech and Language 2012 [Google Scholar]
- 15.Sacks H, Schegloff EA, Jefferson G. A simplest systematics for the organization of turn-taking for conversation language. Language. 1974;50(4 1):696–735. [Google Scholar]
- 16.Schegloff EA. Sequencing in conversational openings. American Anthropologist. 1968;70 (6):1075–1095. [Google Scholar]
- 17.Schegloff EA, Sacks H. Opening up closings. Semiotica. 1973;8:289–327. [Google Scholar]
- 18.Shafran I, Mohri M. A comparison of classifiers for detecting emotions from speech. IEEE ICASSP. 2005;1:341–344. [Google Scholar]
- 19.Soltau H, Kingsbury B, Mangu L, Povey D, Saon G, Zweig G. The IBM 2004 conversational telephony system for rich transcription. IEEE International Conference on Acoustics, Speech, and Signal Processing. 2005;1:205–208. [Google Scholar]
- 20.Toutanova K, Manning CD. Enriching the knowledge sources used in a maximum entropy part-of-speech tagger. Joint SIGDAT Conference on Empirical Methods in Natural Language Processing and Very Large Corpora; 2000. pp. 63–70. [Google Scholar]
- 21.van Rijsbergen C, Robertson S, Porter M. British Library Research and Development Report. 1980. New models in probabilistic information retrieval. [Google Scholar]
- 22.Walker MA, Anand P, Abbott R, Grant R. Stance classification using dialogic properties of persuasion. HLT-NAACL. 2012:592–596. [Google Scholar]
- 23.Worgan SF, Moore RK. Towards the detection of social dominance in dialogue. Speech Communication. 2011;53 (910):1104–1114. [Google Scholar]
- 24.Zhang J, Chan R, Fung P. Extractive speech summarization using shallow rhetorical structure modeling. Audio, Speech, and Language Processing, IEEE Transactions on. 2010 Aug;18 (6):1147–1157. [Google Scholar]