

Abstract
Purpose
This multi-institutional phase I trial was designed to determine the maximum tolerated dose (MTD) of cilengitide (EMD 121974) and evaluate the use of perfusion MRI in patients with recurrent malignant glioma.
Patients and Methods
Patients received cilengitide twice weekly on a continuous basis. A treatment cycle was defined as 4 weeks. Treatment related dose limiting toxicity was defined as any grade 3 or 4 non-hematological toxicity or grade 4 hematological toxicity of any duration.
Results
A total of 51 patients were enrolled in cohorts of 6 patients to doses of 120, 240, 360, 480, 600, 1200, 1800, and 2400 mg/m2 administered as a twice weekly intravenous infusion. Three patients progressed early and were inevaluable for toxicity assessment. The dose limiting toxicities observed were: one thrombosis (120 mg/m2), one grade 4 joint and bone pain (480 mg/m2), one thrombocytopenia (600 mg/m2) and one anorexia, hypoglycemia, hyponatremia (800 mg/m2). The MTD was not reached. Two patients demonstrated complete response, three patients had partial response, and four patients had stable disease. Perfusion MRI revealed a significant relationship between the change in tumor relative cerebral blood flow (rCBF) from baseline and area under the plasma concentration versus time curve after 16 weeks of therapy.
Conclusions
1) Cilengitide is well tolerated to doses of 2400 mg/m2; 2) Durable complete and partial responses were seen in this phase I study; 3) Clinical response appears related to rCBF changes.
INTRODUCTION
Malignant primary brain cancer affects approximately 18,400 individuals in the United States a year.1 Treatment has relied on surgical resection and radiation therapy with emerging roles for chemotherapy.2 Unfortunately, survival for the most aggressive malignant glioma, glioblastoma multiforme (GBM), remains little changed over the past several decades.3
Malignant gliomas are intensely angiogenic and have the added detrimental behaviors of invasion and proliferation within the confines of the central nervous system.4-6 The role of cell surface adhesion molecules has been identified as an important contributor to tumorigenesis in gliomas. Among these molecules, the integrins have a unique role, particularly in the development and progression of cancers of the nervous system.
Integrins are a class of cell surface adhesion molecules important in many cellular behaviors including proliferation, survival, and migration.7 In glioma samples, the integrins αvβ3 and αvβ5 are expressed by both the tumor associated vasculature and tumor cells.8,9 Integrin signaling is mediated through interactions with the RGD (arginine-glycine-aspartic acid) peptide sequence present in select extracellular matrix proteins.10 A role for the integrins αvβ3 and αvβ5 in glioma angiogenesis is supported by expression on activated endothelial cells (EC) within the tumor compared to normal brain EC 9 enrichment of the CNS with the integrin αvβ3 and αvβ5 ligand, vitronectin and fibronectin,11, 13 and disruption of the integrin-ligand interaction both in vitro and in vivo by neutralizing antibodies or peptidimimetic compounds promoting vascular regression.12 Thus this class of integrins is a logical therapeutic target in malignant glioma.
Cilengitide (EMD121974, cyclo-L-Arg-Gly-L-Asp-D-Phe-N (Me) L-Val, Merck KGaA, Darmstadt, Germany) is a cyclic RGD containing peptide that binds to αvβ3 and αvβ5 with nanomolar affinity. In cell adhesion assays, it inhibited both αvβ3 and αvβ5 mediated cell adhesion with IC50 values in the low micromolar range and inhibited angiogenesis in the chick chorioallantoic membrane assay and rabbit cornea assay. 14
The rationale for the study of integrin antagonists in the setting of primary brain malignancies is thus provided. The present study was undertaken to determine the toxicities and maximum tolerated dose (MTD) of the integrin-antagonist, cilengitide in patients with recurrent malignant gliomas.
PATIENTS AND METHODS
This study was sponsored by the Cancer Therapy Evaluation Program at the National Cancer Institute and conducted by the New Approaches to Brain Tumor Therapy CNS Consortium (www.nabtt.org for participating institutions). The protocol was reviewed and approved by the Institutional Review Board at each participating institution and all patients signed informed consent.
Patients eligible for enrollment met the following criteria: ≥18 years of age, histologically proven malignant glioma, measurable progressive or recurrent tumor by MRI, recovered from toxicities of previous therapies, maintained on a stable dose of corticosteriods for ≥5 days, not had more than two prior chemotherapy regimens, Karnofsky performance status of ≥60%, adequate hematologic, renal, and hepatic function, and capable of providing informed consent.
Treatment Plan
This study was designed as an open-label, single-arm Phase I trial to evaluate the toxicities and determine the MTD of cilengitide in patients with recurrent malignant glioma. The study drug was infused intravenously over a one hour period on a twice a week schedule with a minimum of 72 hours between infusions for 4 weeks. This four week interval was considered a treatment cycle. The cohort size was 6 evaluable patients. The starting cohort received cilengitide at a dose of 120 mg/m2, and protocol defined dose increments were 120 mg/m2, up to a dose level of 600 mg/m2, then additional escalations to 1200, 1800, and 2400 mg/m2. The starting dose and schedule were selected based on animal studies that indicated anti-tumor activity with a pulsed treatment schedule that obtained peak plasma concentrations of 11-13 ug/mL and human studies that indicated a peak Cmax of 11-13 ug/mL was obtained with dose levels of 120 mg/m2 15. The MTD was defined as the dose level below the dose that induced DLTs in more than 2 of 6 patients or more than 4 of 12 patients in a cohort. Toxicity was evaluated according to the National Cancer Institute Common Toxicity Criteria version 3. Patients underwent evaluation of measurable disease by cranial MR every eight weeks of treatment.
Pharmacokinetics
For the cilengitide pharmacokinetic (PK) analysis, blood samples were collected in 7 cc green top (heparinized) tubes, centrifuged at 1000 g for 10 min to separate plasma, and stored at −70° C. The samples were taken at the following time points: immediately prior to infusion, 0.5, 1.0, 1.5, 2, 3, 4, 8, and 24 hours after start of infusion on study day 1. Samples analysis was carried out using high-performance liquid chromatography-tandem mass spectrometry (Applied Biosystems GmbH, Triple Quadrupole MS-Detector “API 3000”). Calculation of pharmacokinetic PK parameters was performed at Merck KGaA, Darmstadt, Germany by non-compartmental analysis using Kinetica Version 4.1.1. For each patient the maximum plasma concentration (Cmax) and time to maximum concentration (tmax) were the observed values. The area under the plasma concentration versus time curve (AUC) was calculated by the log-linear trapezoidal rule and extrapolated to infinity by linear regression analysis. The total body clearance of drug from plasma (CL) was calculated as dose/AUC. The volume of distribution at steady state (Vss) was calculated as dose*AUMC/(AUC)2-[T/2], where AUMC is the area under the first moment curve to infinity and T the duration of the infusion. The apparent terminal elimination half-life (t1/2) was calculated by dividing loge2 by the elimination rate constant (λz), estimated by linear regression of the final data points of the linear portion of the log-linear concentration-time plot.
Pharmacodynamic analysis
The post processing and perfusion analysis was performed using the MedX software (version 3.4.2; Sensor Systems, Sterling, VA) running a Sun Blade 1000 workstation (Sun Microsystems, Palo Alto, CA) with Solaris 8 Operating System. The methodology and quality control measures have been previously reported.16 Relative cerebral blood volume (rCBV) and relative cerebral blood flow (rCBF) determined at baseline and after 8 and 16 weeks of treatment were correlated with PK parameters and the clinical outcome, respectively.
Correlative Biology Studies
Perfusion MRI
A total of 21 patients (41%) were imaged multiple times; the other patients had only a baseline scan. The perfusion imaging sequences (dynamic contrast susceptibility; DCS), included a baseline scan prior to first administration of cilengitide and follow-up perfusion scans performed after every 8 weeks of treatment with cilengitide.
The Gradient Recalled Echo-Planar Imaging sequence was used for acquiring functional perfusion data. This study used a TR of 1900 ms and a TE of 50 ms, accommodating a 20% variation in both TR and TE to permit site specific acquisition settings. A 24 cm × 24 cm field of view was used and five to ten (depending on the size of the tumor) 6-8 mm axial slices passing through the center of the tumor were imaged over 40 to 65 functional time points. The contrast agent was injected with a power injector at a flow rate of 4.0 ml/sec.
Statistical Considerations
Patient characteristics and toxicities were summarized using appropriate descriptive statistics. Survival time was calculated from the start of treatment until death from any cause, and surviving patients were censored at the time of last follow-up. The method of Kaplan and Meier17 was used to estimate survival. Confidence intervals were calculated using standard methods. These analyses were performed using SAS version 9.1.3 (SAS Institute, Cary, NC).
Spearman correlation coefficients were utilized to determine possible relationships between rCBF and rCBV differences from baseline to week 8 and week 16 versus dose of cilengitide, Cmax and AUC. Analysis of variance procedures were used to assess dose effects on rCBV and rCBF. Wilcoxon’s signed rank test was also utilized to look at any change (over all doses) for differences in percentage of baseline rCBV and rCBF and time (8 or 16 weeks).
RESULTS
Patient Characteristics
Between August 2000 and February 2003, 51 patients were enrolled into the study. Their characteristics are described in Table 1. Twenty-eight patients were taking enzyme inducing anticonvulsant drugs (EIAD), 9 patients were taking non-EIAD and 14 were not taking anticonvulsants. All patients had prior surgery and completed radiation therapy. There were 37 with glioblastoma multiforme, 11 anaplastic astrocytoma, 1 anaplastic oligodendrogiioma, and 2 mixed anaplastic glioma. Two patients had no prior chemotherapies, 13 had one prior, and 35 had two prior chemotherapies. One patient included in the study did not meet eligibility criteria because he/she had 3 prior chemotherapies. Three patients progressed prior to completion of cycle one, were removed from treatment, and were replaced because they were inevaluable for DLT.
Table 1.
Grade 3 or 4 toxicities at least possibly related to cilengitide by dose level
| Toxicity | Dose Level (mg/m2)
|
Total (% Patients) n=51 | |||||||
|---|---|---|---|---|---|---|---|---|---|
| 120 n=6 | 240 n=7 | 360 n=6 | 480 n=8 | 600 n=6 | 1200 n=6 | 1800 n=6 | 2400 n=6 | ||
| Anorexia | 0 | 0 | 0 | 0 | 0 | 0 | 1 | 0 | 2 |
| Arthralgia | 0 | 0 | 0 | 1 | 0 | 0 | 0 | 0 | 2 |
| Diarrhea | 0 | 0 | 0 | 0 | 1 | 0 | 0 | 0 | 2 |
| Hyperglycemia | 0 | 0 | 0 | 1 | 0 | 0 | 1 | 0 | 4 |
| Hypokalemia | 0 | 0 | 0 | 0 | 0 | 0 | 1 | 0 | 2 |
| Hyponatremia | 0 | 0 | 0 | 0 | 0 | 0 | 1 | 1 | 4 |
| Myalgia | 0 | 0 | 0 | 1 | 0 | 0 | 0 | 0 | 2 |
| Platelets | 0 | 0 | 0 | 0 | 1 | 0 | 0 | 0 | 2 |
| Seizure | 0 | 0 | 0 | 0 | 0 | 0 | 0 | 1 | 2 |
| SGPT/ALT | 1 | 0 | 0 | 0 | 0 | 0 | 0 | 0 | 2 |
| SIADH | 0 | 0 | 0 | 0 | 0 | 0 | 0 | 1 | 2 |
| Uric acid | 0 | 0 | 0 | 0 | 0 | 0 | 1 | 0 | 2 |
Toxicity
Patient infusion with cilengitide did not produce any acute toxicities. There were no more than one DLT in each cohort, which was insufficient to define a MTD. The DLTs occurred at the dose levels of 120, 480, 600, and 1800 mg/m2. The event at 120 mg/m2 was a thrombosis, at 480 mg/m2 a grade 4 myalgia and arthralgia, at 600 mg/m2 a grade 3 thrombocytopenia (platelet count of 37,000) at the time of off study, and at 1800 mg/m2 one patient experienced grade 3 anorexia, hyperglycemia, hypokalemia, and hyponatremia. The only hematological toxicity was the thrombocytopenia, which was counted as a DLT because the platelet count was not repeated and the patient expired. There were no significant bleeding problems encountered with the administration of cilengitide. There were a total of 14 events with a grade of 3 or 4 and relationship of possibly to definitely related to cilengitide. These toxicities are listed in Table 1 with the corresponding dose level. Overall, these events were uncommon with 10 of the 14 occurring in less than 2% of patients. The more common, occurring in just 4% of patients, were hyperglycemia and hyponatremia, events typically associated with the underlying disease of malignant glioma and/or concurrent medications such as corticosteroids or anti-convulsants. These were slightly concentrated in the upper two dose levels (8 of the 14). Overall the study drug was well-tolerated and the majority of adverse events were attributed to the underlying disease.
Pharmacokinetics
The mean linear and semi-logarithmic plasma concentration-time profiles per dose level and the mean (standard deviation) PK parameters following single (day 1) infusion of cilengitide are shown in Figure 1 and Table 2, respectively. The relationship between dose and CL and Vss values, respectively, is illustrated in Figure 2. Mean values of cilengitide CL ranged between 5.9 and 12.1 L/h, which is low compared with hepatic and renal blood flow in man. The Vss was approximately 20 L, nominally equivalent to extra cellular fluid volume. The coefficient of variation for CL and Vss was not improved by dosing per body surface area. Together, the small volume of distribution and low plasma clearance were manifested as a relatively short apparent terminal half-life of about 2.5 and 3.0 hours. No changes in CL, Vss and t1/2 were observed between different doses and Cmax and AUC values increased dose proportionally over the entire dose range indicating linear pharmacokinetics. All PK parameters were comparable to those reported in previous Phase I studies of cilengitide15. Although the study was not stratified to test for differences in pharmacokinetics between patients taking P450 EIAD and those not, the dose cohorts of six patients allowed such an evaluation to be made. We did not see a difference in CL, AUC, or Cmax based on concurrent administration of EIAD (data not shown).
Figure 1.
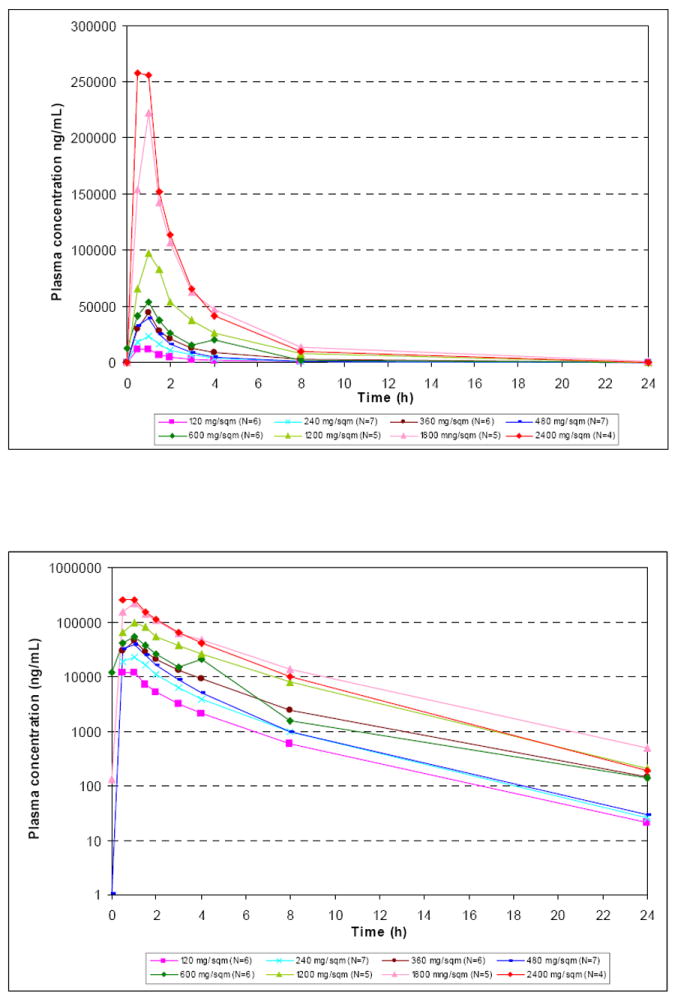
The mean concentration time profiles for the various doses of cilengitide evaluated in the present study.
Table 2.
Overview of pharmacokinetic parameters of cilengitide following a 1-h i.v. infusion
| Dose (mg/m²) | Cmax (μg/mL) | tmax* (h) | AUC0-∞ (μg/mL*h) | t1/2 (h) | CL (L/h/sqm) | CL (L/h) | Vss (L/sqm) | Vss (L) | |
|---|---|---|---|---|---|---|---|---|---|
|
| |||||||||
| 120 | Mean (SD) | 12.9 (1.7) | 1.0 | 30.8 (8.6) | 3.01 (0.28) | 4.23 (1.51) | 8.22 (2.24) | 10.2 (1.08) | 20.2 (2.77) |
| N=6 | Range | 11.2 – 16.1 | 0.5 - 1 | 16.9 – 42.5 | 2.69 - 3.4 | 2.83 - 7.12 | 6.12 - 12.5 | 9.1 - 12.1 | 15.9 - 24.1 |
| %CV | 35.6 | 27.2 | 10.6 | 13.7 | |||||
|
| |||||||||
| 240 | Mean (SD) | 26.1 (3.7) | 1.0 | 60.7 (13.1) | 2.77 (0.16) | 4.14 (1.1) | 8.00 (2.82) | 9.66 (1.14) | 18.6 (3.84) |
| N=6 | Range | 21.6 – 31.0 | 1 - 1 | 38.4 – 78.4 | 2.56 - 3.01 | 3.06 - 6.24 | 5.28 - 13.3 | 8.12 - 11.4 | 12.1 - 22.2 |
| %CV | 26.5 | 35.3 | 11.8 | 20.7 | |||||
|
| |||||||||
| 360 | Mean (SD) | 44.7 (7.4) | 1.0 | 128 (38.1) | 3.13 (0.43) | 3.02 (0.85) | 5.90 (1.60) | 9.37 (1.15) | 18.3 (2.16) |
| N=6 | Range | 35.2 – 56.9 | 1 - 1.1 | 81.7 - 195 | 2.71 - 3.79 | 1.85 - 4.41 | 3.43 - 7.90 | 8.35 - 11.6 | 15.3 - 20.8 |
| %CV | 28.1 | 27.0 | 12.3 | 11.8 | |||||
|
| |||||||||
| 480 | Mean (SD) | 38.3 (9.1) | 1.0 | 81.8 (21.1) | 2.69 (0.31) | 6.22 (1.65) | 12.1 (2.81) | 12.6 (2.69) | 24.7 (5.96) |
| N=7 | Range | 27.8 – 54.3 | 0.5 - 1.7 | 52.2 – 119 | 2.39 - 3.3 | 4.04 - 9.19 | 8.66 - 16.2 | 9.38 - 17.3 | 18.4 - 36.4 |
| %CV | 26.5 | 23.2 | 21.4 | 24.1 | |||||
|
| |||||||||
| 600 | Mean (SD) | 62.6 (3.8) | 1.0 | 139 (51.9) | 3.23 (0.37) | 4.65 (1.73) | 7.98 (1.18) | 10.6 (0.11) | 18.9 (4.21) |
| N=2 | Range | 59.9 – 65.3 | 1 - 1 | 102 - 176 | 2.97 - 3.5 | 3.42 - 5.87 | 7.15 - 8.81 | 10.5 - 10.6 | 16.0 - 21.9 |
| %CV | 37.3 | 14.7 | 1.0 | 22.3 | |||||
|
| |||||||||
| 1200 | Mean (SD) | 106 (35.3) | 1.3 | 319 (96.6) | 2.77 (0.39) | 4.04 (1.26) | 8.21 (2.46) | 11.7 (3) | 24.0 (6.86) |
| N=4 | Range | 84.8 - 158 | 0.5 - 1.5 | 213 - 431 | 2.29 - 3.15 | 2.78 - 5.63 | 6.12 - 11.3 | 7.65 - 14.9 | 14.5 - 30.7 |
| %CV | 31.2 | 29.9 | 25.7 | 28.5 | |||||
|
| |||||||||
| 1800 | Mean (SD) | 222 (33.7) | 1.0 | 578 (148) | 2.82 (0.47) | 3.29 (0.87) | 6.45 (1.79) | 8.81 (1.84) | 17.4 (4.23) |
| N=5 | Range | 168 – 256 | 1 - 1 | 426 - 749 | 2.48 - 3.63 | 2.4 - 4.22 | 4.59 - 8.99 | 6.88 - 11.3 | 12.1 - 21.6 |
| %CV | 26.3 | 27.8 | 20.3 | 24.4 | |||||
|
| |||||||||
| 2400 | Mean (SD) | 316 (128) | 1.0 | 626 (95.9) | 2.59 (0.14) | 3.92 (0.71) | 7.60 (1.54) | 9.08 (3.56) | 17.9 (7.81) |
| N=4 | Range | 185 - 470 | 0.5 - 1 | 482 - 683 | 2.47 - 2.75 | 3.51 - 4.98 | 6.50 - 9.80 | 5.97 - 12.9 | 11.1 - 25.4 |
| %CV | 18.1 | 20.3 | 39.2 | 43.7 | |||||
Cmax peak plasma concentration; AUC, area under the plasma concentration versus time curve; t1/2. terminal half life; CL, mean systemic clearance; Vss, apparent volume of distribution; SD, standard deviation.
Median.
Figure 2. Relationship between dose and CL and Vss of cilengitide, respectively.
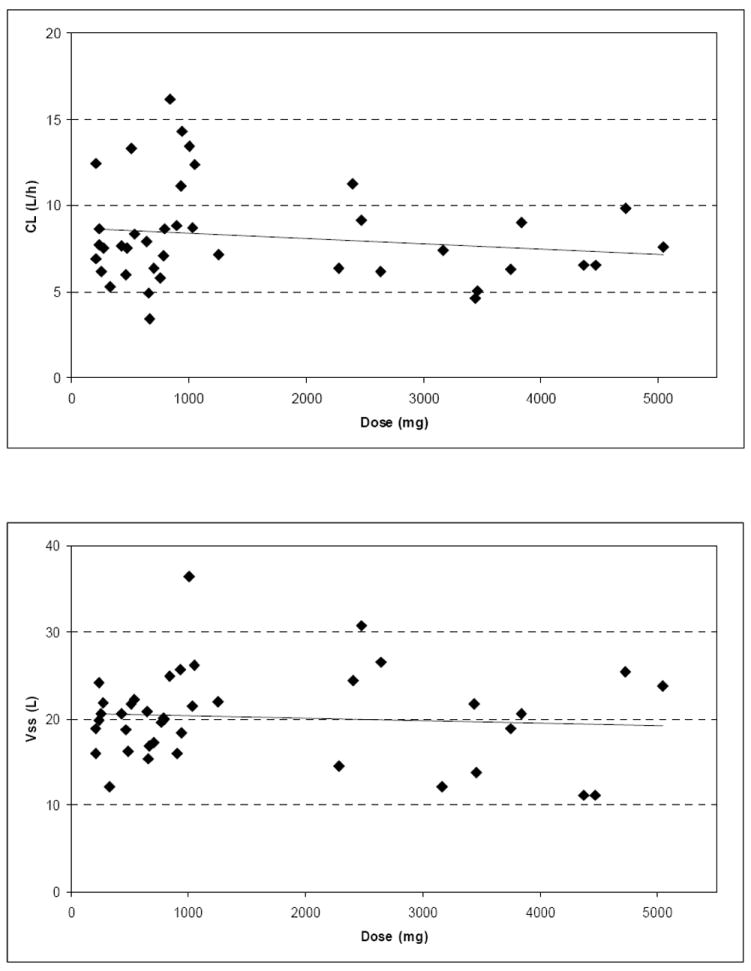
The relationship between various doses of cilengitide and the pharmacokinetic parameters CL and Vss.
Response Assessment
Of the 51 patients enrolled, there were a total of 5 objective responses. There were two complete responses (CR) in patients with an anaplastic astrocytoma and a GBM. These occurred at the 360 mg/m2 and 2400 mg/m2 dose levels. The CR at 2400 mg/m2 occurred following the completion of the second cycle. Both patients were able to be tapered completely off corticosteroids and demonstrated improving functional status after the initiation of cilengitide therapy. Both patients voluntarily discontinued therapy after 24 and 12 months and have been without clinical or radiographic evidence of recurrence at 29 and 15 months post treatment discontinuation, respectively. There were 3 patients that demonstrated a partial response with a mean duration of 9.3 months (range, 8-10 months). A total of 16 patients had a best response of stable disease with a mean duration of 5.4 months (range, 3 to 11 months).
Four (8%) of the 51 patients are alive after a minimum of 29 months of follow-up. The median survival time was 5.6 months (95% CI, 4.3 to 8.4 months). Kaplan-Meier estimates of survival stratified by dose level (< 600 mg/m2 and ≥ 600 mg/m2) did not differ (5.5 months for lower doses compared to 5.6 months for higher doses, log-rank p=0.95).
Correlative Biology Endpoint
Perfusion MRI
DCS-MRI, was performed to quantify the changes in rCBV and rCBF. The changes from baseline were correlated with the dose of cilengitide as well as the PK parameters of Cmax and AUC using Spearman correlation (Table 3). A negative relationship existed between the absolute change from baseline in rCBF and AUC at 16 weeks (R=-0.71; p=0.048) suggesting that an increased target exposure was more likely to result in normalization of the rCBF. A meaningful correlation did not appear for percent change from baseline in either perfusion parameter at either time point nor for rCBF at 8 weeks. We also looked for percentage differences over all doses between baseline and week 8 or week 16 for the rCBV and rCBV, however, no significant difference was noted. Trends toward significance were present but these comparisons were very underpowered to detect significant differences as would be the case in most phase I studies.
Table 3.
Spearman Rank Correlation Coefficients (Significance Values) for Cilengitide dose, Cmax, and AUC correlated with DCS-MRI rCBF and rCBV at Weeks 8 and 16
| Perfusion | Time | Dose | Cmax | AUC |
|---|---|---|---|---|
| rCBF | % Diff of Week 8 – Week 0 (n=25) |
0.16 (0.45) |
0.14 (0.51) |
0.12 (0.58) |
| Week 8 – Week 0 (n=25) |
0.18 (0.40) |
0.15 (0.47) |
0.13 (0.54) |
|
| % Diff of Week 16 – Week 0 (n=8) |
-0.46 (0.25) |
-0.31 (0.46) |
-0.64 (0.09) |
|
| Week 16 – Week 0 (n=8) |
-0.54 (0.17) |
-0.40 (0.33) |
-0.71 (0.05) |
|
| rCBV | % Diff of Week 8 – Week 0 (n=25) |
0.08 (0.70) |
0.08 (0.72) |
0.04 (0.84) |
| Week 8 – Week 0 (n=25) |
0.12 (0.56) |
0.12 (0.58) |
0.08 (0.72) |
|
| % Diff of Week 16 – Week 0 (n=8) |
-0.36 (0.39) |
-0.14 (0.74) |
-0.29 (0.49) |
|
| Week 16 – Week 0 (n=8) |
-0.36 (0.39) |
-0.14 (0.74) |
-0.29 (0.49) |
Abbreviations: AUC, area under the plasma concentration curve; Cmax, maximum plasma concentration; Diff, difference; DSC-MRI, dynamic susceptibility contrast-magnetic resonance imaging; rCBF, relative cerebral blood flow; rCBV, relative cerebral blood volume
In Figure 3, we attempted to model the relationship between the PK parameters Cmax and AUC and the pharmacodynamic (PD) parameters % of baseline rCBV and rCBF sorted by progressors and non-progressors using the inhibitory maximum effect (Emax) pharmacodynamic model. It was not possible to fit the data to the model in a meaningful way. However, from the data a slight difference between progressors and non-progressors could be seen. After 8 weeks of cilengitide treatment progressors showed more likely an increase in rCBV and rCBF compared to baseline values whereas non-progressors stayed at least at the same level or even slightly below. All other data showed no obvious trend between the PK parameters and the PD parameters percent of baseline rCBV and rCBF, respectively.
Figure 3.
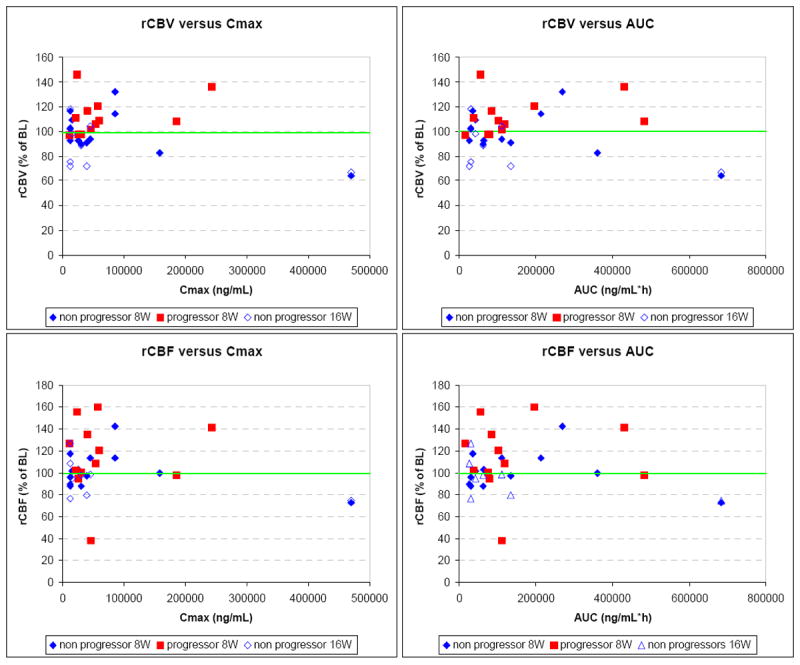
Relationship between pharmacokinetic and pharmacodynamic parameters: The percent of baseline rCBV (Top row) and rCBF (Bottom row) versus the Cmax (Right column) and AUC (Left column).
DISCUSSION
Cilengitide was shown to be well-tolerated with limited toxicities when administered as a twice a week infusion, continuously in patients with recurrent malignant glioma. Toxicities were independent of dose and there were insufficient DLTs to define a MTD. Most of the adverse events were mild and felt not to be attributed to cilengitide.
The pharmacokinetics of cilengitide in this study are comparable to those from other phase I studies of cilengitide.15 The target Cmax of 11-13 ug/mL was achieved at the lowest dose evaluated, 120 mg/m2, however the duration of target exposure as reflected in the AUC was less than 5% of the highest dose administered, 2400 mg/m2. The PK parameters for cilengitide were not affected by the concurrent administration of hepatic enzyme inducing anticonvulsants and there was overall little variability in PK parameters among the patients as would be expected for an intravenously administered compound. Dosing per body surface area had no impact on the coefficient of variation for CL and Vss
The correlative biology endpoints of this study support a role for DSC-MRI in the determination of a biological response. As we have previously reported, a normalization of the perfusion parameters (rCBV and rCBF) was associated with the clinical response in a statistically significant manner.16 In the present report, we were able to demonstrate a significant correlation or association between the PK parameter of AUC and change in the perfusion parameters of rCBF after 16 weeks of treatment. However, we were unable to fit the data to an inhibitory Emax model. An explanation for this lack of association may exist in the PD model chosen. The inhibitory Emax model has been successfully utilized in correlating the dose of the VEGF–receptor tyrosine kinase inhibitor, PTK787/ZK222584, the PK parameters, and the perfusion parameter (Ktrans) derived from dynamic contrast enhancement MRI.18,19 The use of this model to study the relationship between a drug and its biological response may best be served when that relationship approaches a linear behavior. For central nervous system cancers, that relationship may not be linear due to compartmentalization.
In addition, we should also consider that this relationship might be made more complex in glioma when the target is potentially expressed by both the tumor-associated vasculature and the tumor itself. It is possible that in the cases where we documented clinical responses, the associated changes in perfusion parameters were not directly related to an anti-angiogenic effect of cilengitide but due to an indirect mechanism through an anti-tumor effect. For patients with significant target expression by the tumor, actual tumor responses could be expected as opposed to patients with predominant expression by tumor EC where stabilization may be the best response. This appears to be supported by our previous efforts documenting a statistically significant relationship between normalization of the perfusion parameters and clinical response16 and the present study in which we report a statistically significant relationship between rCBF at 16 weeks and AUC (Table 3) and the PK/PD plots in which the data suggest a difference after 8 weeks of treatment with progressors more likely to have an increase in rCBV and rCBF (Figure 3).
In summary, this is the first report of biological activity by an integrin antagonist. Cilengitide demonstrated unexpected single-agent activity in patients with recurrent malignant glioma with limited toxicities. T2* DSC-MRI may be useful as a surrogate marker in the validation of clinical response, however, the utility to determine optimal biological dose is limited in glioma patients using the PD inhibitory Emax model. The current study suggest that flat dosing is appropriate for future studies with a suggestion that higher doses (>2,000mg) are associated with clinical responses. Ongoing studies with cilengitide in glioma are examining tissue expression of the integrin targets as well as benefits of high versus low doses of the drug on survival in newly diagnosed and recurrent disease patients.
Acknowledgments
Supported by grants from the National Cancer Institute U01 CA 62475 and R21 CA091560.
Footnotes
This work has been presented in part at the Society of Neuro oncology Annual Meeting 2004.
References
- 1.Published by the Central Brain Tumor Registry of the United States CBTRUS: Statistical Report: Primary Brain Tumors in the United States 1997-2001. 2004 [Google Scholar]
- 2.Stupp R, Mason WP, van den Bent MJ, et al. Radiotherapy plus concomitant and adjuvant temozolomide for glioblastoma. N Engl J Med. 2005;352:987–996. doi: 10.1056/NEJMoa043330. [DOI] [PubMed] [Google Scholar]
- 3.Tatter SB. Recurrent malignant glioma in adults. Curr Treat Options Oncol. 2002;3:509–524. doi: 10.1007/s11864-002-0070-8. [DOI] [PubMed] [Google Scholar]
- 4.Libermann TA, Nusbaum HR, Razon N, et al. Amplification, enhanced expression and possible rearrangement of EGF receptor gene in primary human brain tumors of glial origin. Nature. 1985;313:144–147. doi: 10.1038/313144a0. [DOI] [PubMed] [Google Scholar]
- 5.Watanabe K, Tachibana O, Sata K, et al. Overexpression of the EGF receptor and p53 mutations are mutually exclusive in the evolution of primary and secondary glioblastomas. Brain Pathol. 1996;6:217–223. doi: 10.1111/j.1750-3639.1996.tb00848.x. [DOI] [PubMed] [Google Scholar]
- 6.Westermark B, Heldin CH, Nister M. Platelet-derived growth factor in human glioma. Glia. 1995;15:257–263. doi: 10.1002/glia.440150307. [DOI] [PubMed] [Google Scholar]
- 7.Hynes RO. Integrins: a family of cell surface receptors. Cell. 1987;48:549–554. doi: 10.1016/0092-8674(87)90233-9. [DOI] [PubMed] [Google Scholar]
- 8.Bello L, Francolini M, Marthyn P, et al. αvβ3 and αvβ5 integrin expression in glioma periphery. Neurosurgery. 2001;49:380–390. doi: 10.1097/00006123-200108000-00022. [DOI] [PubMed] [Google Scholar]
- 9.Gladson CL. Expression of integrin alpha v beta 3 in small blood vessels of glioblastoma tumors. J Neuropathol Exp Neurol. 1996;55:1143–1149. doi: 10.1097/00005072-199611000-00005. [DOI] [PubMed] [Google Scholar]
- 10.Cheresh D. Human endothelial cells synthesize and express an Arg-Gly-Asp directed adhesion receptor involved in attachment to fibrinogen and von Willebrand factor. Proc Natl Acad Sci USA. 1987;84:6471–6475. doi: 10.1073/pnas.84.18.6471. [DOI] [PMC free article] [PubMed] [Google Scholar]
- 11.Gladson CL, Cheresh DA. Glioblastoma expression of vitronectin and the αvβ3 integrin: adhesion mechanism of transformed glial cells. J Clin Invest. 1991;88:1924–1932. doi: 10.1172/JCI115516. [DOI] [PMC free article] [PubMed] [Google Scholar]
- 12.MacDonald T, Taga T, Shimada HP, et al. Preferential susceptibility of brain tumors to antiangiogenic effects of an αv integrin antagonist. Neurosurgery. 2001;48:151–157. doi: 10.1097/00006123-200101000-00026. [DOI] [PubMed] [Google Scholar]
- 13.Chatterjee S, Matsumura A, Schradermeier J, et al. Human malignant glioma therapy using anti-αvβ3 integrin agents. J Neurooncol. 2000;46:135–144. doi: 10.1023/a:1006444300504. [DOI] [PubMed] [Google Scholar]
- 14.Germer M, Kanse SM, Kirkegaard T, et al. Kinetic analysis of integrin-dependent cell adhesion on vitronectin: the inhibitory potential of plasminogen activator inhibitor-1 and RGD peptides. Eur J Biochem. 1998;253:669–674. doi: 10.1046/j.1432-1327.1998.2530669.x. [DOI] [PubMed] [Google Scholar]
- 15.Eskens FA, Dumez H, Hoekstra R, et al. Phase I and pharmacokinetic study of continuous twice weekly intravenous administration of cilengitide (EMD 121974), a novel inhibitor of the integrins αvβ3 and αvβ5 in patients with advanced solid tumours. Eur J Cancer. 2003;39:917–926. doi: 10.1016/s0959-8049(03)00057-1. [DOI] [PubMed] [Google Scholar]
- 16.Akella NS, Twieg DB, Mikkelsen T, et al. Assessment of brain tumor angiogenesis inhibitors using perfusion magnetic resonance imaging: quality and analysis results of a phase I trial. J Magn Reson Imag. 2004;20:913–922. doi: 10.1002/jmri.20202. [DOI] [PubMed] [Google Scholar]
- 17.Kaplan EL, Meier P. Nonparametric esimation from incomplete observations. J Am Stat Assoc. 1958;53:457–481. [Google Scholar]
- 18.Morgan B, Thomas AL, Drevs J, et al. Dynamic contrast-enhanced magnetic resonance imaging as a biomarker for the pharmacological response of PTK787/ZK 222584, an inhibitor of the vascular endothelial growth factor receptor tyrosine kinases, in patients with advanced colorectal cancer and liver metastases: results from two phase I studies. J Clin Oncol. 2003;21:3955–3964. doi: 10.1200/JCO.2003.08.092. [DOI] [PubMed] [Google Scholar]
- 19.Thomas AL, Morgan B, Horsfield MA, et al. Phase I study of the safety, tolerability, pharmacokinetics, and pharmacodynamics of PTK787/ZK 222584 administered twice daily in patients with advanced cancer. J Clin Oncol. 2005;23:4162–4171. doi: 10.1200/JCO.2005.09.034. [DOI] [PubMed] [Google Scholar]