Abstract
Aims
Nephropathy is the leading secondary complication of metabolic syndrome. Nutritional supplement by chromium-picolinate is assumed to have renoprotective effects. However, potential toxic effects reported increase concerns about safety of chromium-picolinate. The experimental design aimed at determining, whether the treatment with clinically relevant doses of chromium-picolinate can harm individual oucomes through DNA damage and extensive alterations in central detoxification / cell-cycle regulating pathways in treatment of diabetes.
Methods
The study was performed in a double-blind manner. Well-acknowledged animal model of db/db-mice and clinically relevant doses of chromium-picolinate were used. As an index of DNA-damage, measurement of DNA-breaks was performed using “Comet Assay”-analysis. Individual and group-specific expression patterns of SOD-1 and P53 were evaluated to get insights into central detoxification and cell-cycle regulating pathways under treatment conditions.
Results
Experimental data revealed highly individual reaction under treatment conditions. Highest variability of DNA-damage was monitored under prolonged treatment with high dosage of CrPic. Expression patterns demonstrated a correlation with subcellular imaging and dosage-dependent suppression under chromium-picolinate treatment.
Interpretation and recommendations
Population at-risk for diabetes is huge and increasing in pandemic scale. One of the reasons might be the failed attempt to prevent the disease by application of artificial supplements and drugs with hardly recognised individual risks. Consequently, a multimodal approach of integrative medicine by predictive diagnostics, targeted prevention and individually created treatment algorithms is highly desirable.
Keywords: diabetes care, chromium-picolinate therapy, therapy response, patient profiles, subcellular imaging, molecular patterns, individual risks, navigating diagnostics, treatments tailored to patient, new guidelines, personalised medicine
Introduction
Diabetes mellitus (DM) as a chronic medical condition
Diabetes mellitus is considered as a group of multi-factorial metabolic disorders; its aetiology is highly complex (1). DM is characterised by hyperglycaemia with disturbances in the metabolism of carbohydrate, fat and lipid metabolism resulting from defects in pancreatic insulin secretion, insulin action or both leading to the clinical onset of DM type 2 that is the most prevalent form of Diabetes mellitus worldwide. Recent studies have identified the possibility of a new form of diabetes after finding that insulin is also produced by the brain. Reduced levels of the brain insulin production are considered as the Diabetes type 3 and seem to be linked to the pathology of Alzheimer's disease (2). Consequently, the positive therapeutic effects of treatments addressing the role of brain insulin deficiency and resistance are extensively under consideration. Innovative technologies for the targeted insulin delivery and novel insulin sensitizer agents are requested to implement multimodal diagnostic and therapeutic strategies for effective prediction and targeted prevention of different forms of DM.
Global prevalence of diabetics
Taking into account gestational, type 1, 2 and 3 Diabetes mellitus, currently this group of metabolic disorders affects more than 300 million people worldwide. World Health Organisation (WHO) reports predict that the dramatic rise in DM over the next 25 years would be mainly due to type 2 diabetes (3), which is the most prevalent form of diabetes accounting for 90 % of the cases worldwide (4). In the year of 2000 as well as today, India, China and USA are the three leading countries with the highest prevalence of DM. Over the next 30 years the number of people with diabetes is expected to double (5). Furthermore, the worldwide impact of undiagnosed DM ranges between 30% and 50%. Globally, DM is the fourth leading cause of death (6) and it is estimated that every 10 seconds a person dies from diabetes mellitus related complications (6).
Increased DM incidence and severity of secondary complications: Risk factors
There is an increased association between DM type 2 prevalence and various endogenous and exogenous factors such as low socioeconomic status, accelerated aging, female gender, unfavourable life style, lacking physical activity, poor diet, global urbanisation, low educational level, smoking, environmental risk factors, etc. (7–11).
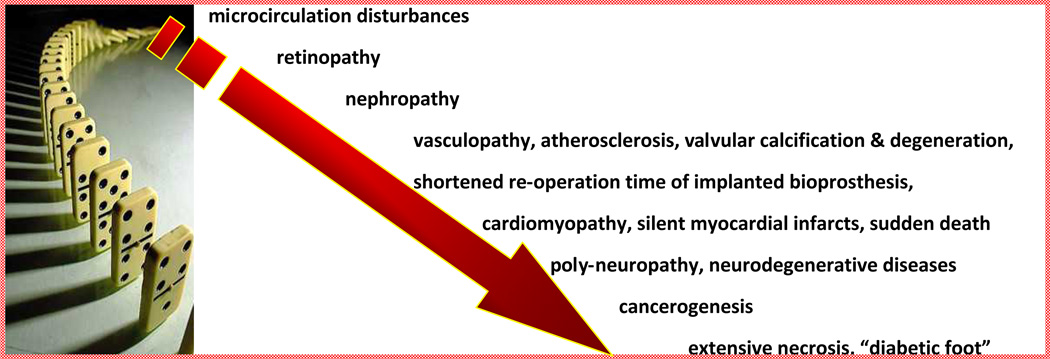
The increased oxidative and nitrosative stress, as a result of hyperglycaemic episodes, is known to complicate even well controlled cases of diabetes, thereby resulting in micro- and macrovascular outcomes (12). The reduced bioavailability of vasodilator nitric oxide (NO) and increased NO degradation by ROS (13, 14) result in endothelial dysfunction - main initiating event leading to various chronic complications such as disturbancies in microcirculation, retinopathy, angiopathy, nephropathy, poly-neuropathy, cardiomyopathy, etc. (Fig. 1).
Figure 1.
“Domino effect” in appearance of chronic complications, fatal impairments and sudden death associated with DM (15–17)
Two main contributors to chronic DM-complications are oxidative stress and subsequent activation of reactive oxygen species. Consequent DNA damage has been well documented in diabetic patients and animal models. Important is that sensitivity to oxidative stress differs among diabetics; increased sensitivity gives rise to a cascade of chronic complications appearing as “domino effect” (18–20). Secondary chronic complications in turn results in organ damage leading to shortened life span, sudden death and high mortality in the diabetics (6). DM patients are highly predisposed to cancer (19–21).
Diabetic Nephropathy and renoprotective chromium-picolinate treatments
Diabetic Nephropathy (DN) is one of the most frequent and severe DM complications and the leading cause of end-stage renal disease worldwide. It requires dialysis or kidney transplantation and is reported to be an independent risk factor for cardiovascular mortalities in diabetic patients (22–24). Chromium-picolinate (CrPic), a well absorbed form of chromium has become a very popular nutritional supplement for treating type 2 diabetics and diabetes-predisposed individuals (25). It is reported that CrPic generates sales for more than 100 million dollars annually (26) and is freely available in numerous forms including pills, sport drinks, nutrition bars and chewing gums (27). CrPic is commonly supplied in the range of 200–500 µg tablets as a daily dose (28). Big advantage of chromium-picolinate is high molecule stability: the coupling of chromium with the ligand picolinate has resulted in increasing its bioavailability and high absorbing capacity compared with dietary chromium (29).
Working hypothesis: Can chromium-picolinate harm individual outcomes?
A mechanism of chromium-picolinate action at molecular level is not completely understood. In 1999, Speetjens et al. reported that CrPic cleaves DNA: radicals in the presence of air and biological reductants, CrPic generates hydroxyl that leads to DNA damage (30). Further, organisms exposed to CrPic complexes have tendency to accumulate Cr(III) complexes intracellularly leading to genotoxic effects by formation of covalent bonds to DNA (31). Cytotoxic, genotoxic and mutagenic effects as well as activity damaging to mitochondria and induction of apoptosis have been reported for CrPic using mammalian cell cultures, Drosophila and animal models (32–35). Potential toxic effects reported have increased concerns about safety of CrPic. This article investigates, whether treatments with clinically relevant doses of chromium-picolinate can potentially harm individuals through DNA damage and extensive alterations in central detoxification / cell-cycle regulating pathways in treatment of diabetes.
Methods
Experimental design
The experimental design is scheduled in Table 1. The overall analytical procedure has been performed in “double-blind study” way.
Table 1.
Experimental design: A. To simulate DM type 2 a well-acknowledged animal model of db/db-mice was used. Animals were grouped into eight groups with 5–6 animals in each. Group 1 represented the healthy control. Group 2 was the model mice for type 2 DM. Groups 3 – 7 were diabetes-model mice treated under individual algorithms: 5 mg/kg CrPic from 6 weeks to 6 months of age (Group 3), 10 mg/kg CrPic from 6 weeks to 6 months of age (Group 4), 100 mg/kg CrPic from 6 weeks to 6 months of age (Group 5), 100 mg/kg CrPic from 3 months to 6 months of age (Group 6), and 250 mg/kg CrPic from 3 months to 6 months of age (Group 7). Two kidney tissue samples from different kidney parts, of the above groups of animals were collected and stored at − 80°C till the below described analysis were performed. B. As an index of DNA-damage, measurements of DNA-breaks were performed using quantitative “Comet Assay”-analysis. C. Both individual and group-specific expression patterns of SOD-1 and P53 were determined to characterise potential alterations in central detoxification and cell-cycle regulating pathways under treatment conditions.
| A. Animal Model | ||||||
|---|---|---|---|---|---|---|
| Group 1 | Group 2 | Group 3 | Group 4 | Group 5 | Group 6 | Group 7 |
|
Control mice |
Type 2 DM mice without treatment |
Type 2 DM mice Cr-Pic supplement: 5 mg/kg Duration: 6 weeks-6months of age |
Type 2 DM mice Cr-Pic supplement: 10 mg/kg Duration: 6 weeks-6months of age |
Type 2 DM mice Cr-Pic supplement: 100 mg/kg Duration: 6 weeks-6months of age |
Type 2 DM mice Cr-Pic supplement: 100 mg/kg Duration: 3–6months of age |
Type 2 DM mice Cr-Pic supplement: 250 mg/kg Duration: 3–6months of age |
|
B. Analytical approach to index DNA-damage: Quantitative subcellular imaging by “Comet Assay”-analysis under alkali condition; Analysis of comet patterns in groups of comparison and individually | ||||||
|
C. Analytical approach to index central detoxification and cell-cycle regulating pathways: individual and group-specific expression patterns of SOD-1 and P53 | ||||||
Quantitative subcellular imaging by “Comet Assay”-analysis
The single cell gel electrophoresis assay (CometAssay™, Trevigen, Inc., Cat. No. 4250-050-K, USA) is a simple and effective method for evaluating DNA damage in cells. It is based upon the ability of denatured, cleaved DNA fragments to migrate out of the cell under the influence of an electric field, whereas undamaged DNA remains within the confines of the nucleoid and migrates slower. The assessment of DNA damage is done via the evaluation of the DNA “comet” tail shape and migration pattern. The cells are immobilised in a bed of low melting point agarose, on a Trevigen CometSlide™. After cell lysis, samples are treated with alkali to unwind and denature the DNA and hydrolyse sites of damage. After performing electrophoresis, staining with a fluorescent DNA intercalating dye (SYBR® Green I) is done and the sample is visualised by epifluorescence microscopy. The alkaline electrophoresis is very sensitive and detects small amounts of damage.
Cell samples were prepared immediately before starting the assay and were handled under dimmed light to prevent DNA damage from ultraviolet light. Buffers were chilled to 4°C or on ice in order to inhibit endogenous damage occurring during sample preparation. Calcium and magnesium free PBS has been used to inhibit endonuclease activities.
For the comet staining diluted SYBR® Green I was used. 100 µl of the staining solution was pipetted onto each circle of dried agarose and the slides were placed in refrigerator for 15 to 20 minutes. Afterwards the excess SYBR solution has been removed by tapping the slides. Once the slides have completely dried at room temperature in the dark, the comets were counted under epifluorescence microscopy. DNA damage was designated to four classes based on the visual aspect considering the extend of DNA migration as published earlier (36). Comets with a bright head and almost no tail were classified as class I indicating minimal DNA damage. Whereas comets with no visible head and a long diffuse tail were classified as class IV revealing complete DNA fragmentation. Comets with intermediate characteristics were assigned to classes II and III based on the ratio R = T/r, in which T represents the comet’s tail length and r is the radius of the comet’s head. The characteristic value of R for class I is 1 and for class IV is ∞ (r = 0). Comet with R values ranging between 1<R>3 were designated as class II.
Evaluation of specific expression patterns by “Western-blot”-analysis
All analyses were performed two times for each sample. The cells / tissue were lysed by homogenisation in lysis buffer (9 M urea, Merck, Germany), 1 % DTT (Sigma, USA), 2 % CHAPS (Merck, Germany), 0.8 % Bio-Lyte, pH 3–10 (Bio-Rad, USA), 5 mM Pefabloc (Roche, Switzerland) followed by a centrifugation step. The protein concentration was quantified by the DC-Protein Assay (Bio-Rad, USA). Forty µg protein of each sample were loaded onto 12 % SDS-polyacrylamide gels and electrophoresed to separate proteins. The proteins were then transferred to nitrocellulose membranes (Hybond ECL, Amersham Biosciences, UK) and afterwards incubated at room temperature in blocking-buffer (58 mM NaHPO4, 17 mM NaH2PO4, 68 mM NaCl, 5 % nonfat dry milk powder; 0.1 % Tween 20) for 1 hour. Primary anti-body incubation was performed at room temperature using a 1:250 dilution of the specific anti-bodies (Santa Cruz, USA) in washing buffer I (58 mM NaHPO4, 17 mM NaH2PO4, 68 mM NaCl, 1 % non-fat dry milk powder, 0.1 % Tween 20) for 1 hour. The membranes were then washed four times in the same solution. The horseradish peroxidase-labelled anti-goat secondary antibody was incubated at room temperature with the membranes in washing buffer I followed by three washes in washing buffer II (58 mM NaHPO4, 17 mM NaH2PO4, 68 mM NaCl, 1 % nonfat dry milk powder; 0.3 % Tween 20) and three washes in washing buffer I. Then the membranes were reacted with chemiluminescent reagent ECL plus (Detection Kit, Amersham Biosciences, UK) for 1 hour and processed for auto-radiography. The individual signals were measured densitometrically using the “Quantity One” imaging system (Bio-Rad, USA).
Statistical Analysis
Statistical analyses were carried out using SPSS 17.0 software (SPSS, Chicago, USA). To examine the significance of differences amoung the groups of comparison, the univariable variance analyse Bonferroni was applied. To analyse interrelations of parameters in all groups, ANOVA (analysis of variance) test was used. The level of significance was chosen as p < 0.05.
Results
Quantitative subcellular imaging by “Comet Assay”-analysis
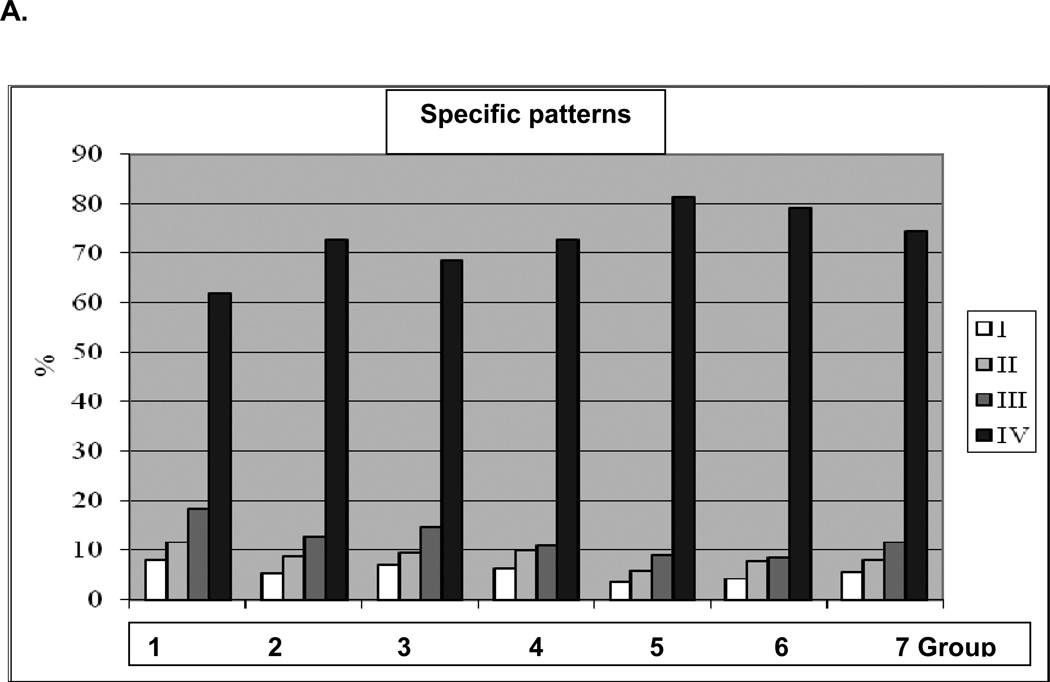
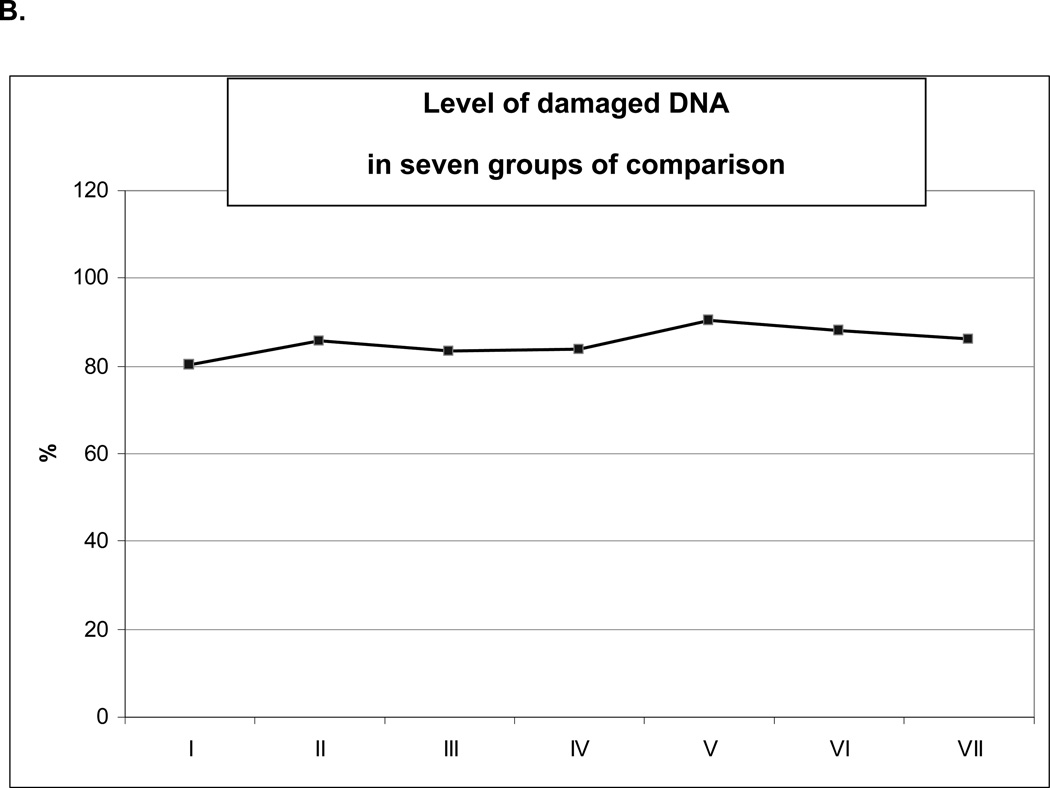
Altogether around 60 thousand comets have been analysed in this study. Individual comet patterns for each animal in 7 groups of comparison were monitored. Comet assay analysis revealed highly individual comet patterns and significant differences in comets distribution among and within groups of comparison. Summarised patterns characteristic for each group of comparison are presented in Fig. 2A. Corresponding ammount of damaged cells is given in Fig. 2B. Lowest amount of damaged cells was monitored in the control group 1. In contrast, the highest ammount of damaged cells has been monitored in group 5 with longest duration of the treatment and highest dosis of CrPic for this treatment algorythm. Fig. 2B will be, further, used to demonstrate correlations between subcellular imaging (“Comet Assay”) and expression patterns (“Western-blot” analysis).
Figure 2.
A. Comet patterns characteristic for each group of comparison.
B. Corresponding persentage of class III and IV comets representing damaged DNA in groups of comparison.
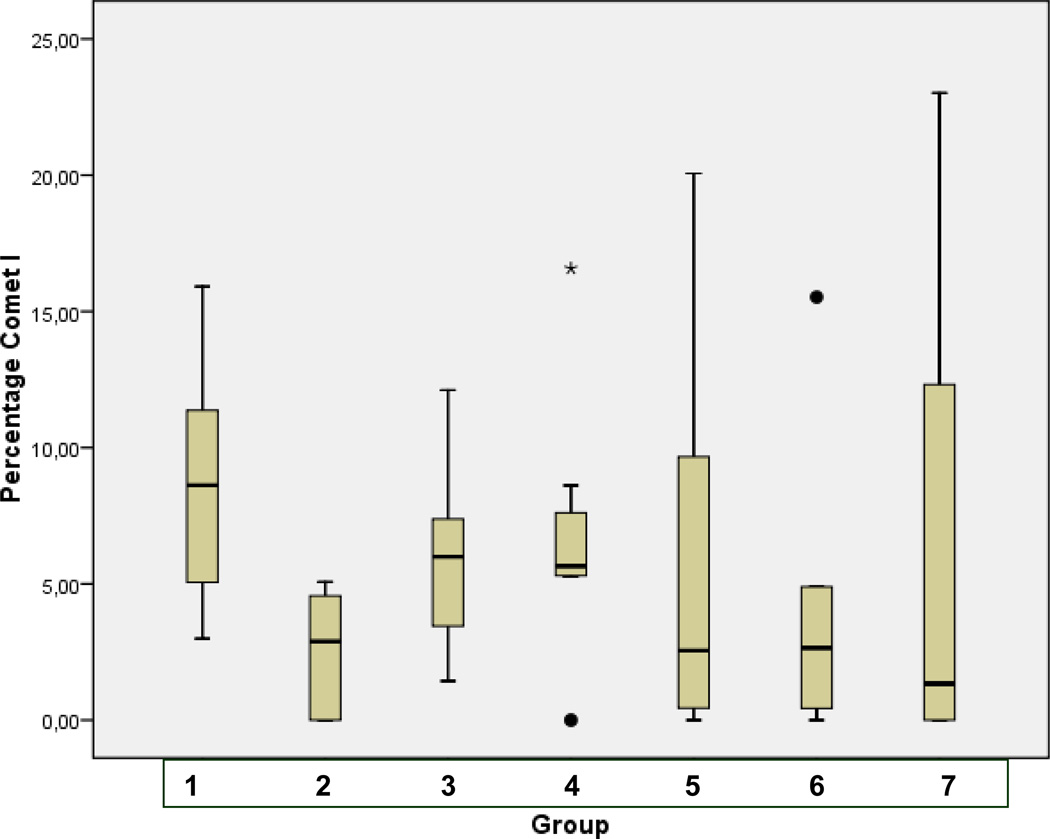
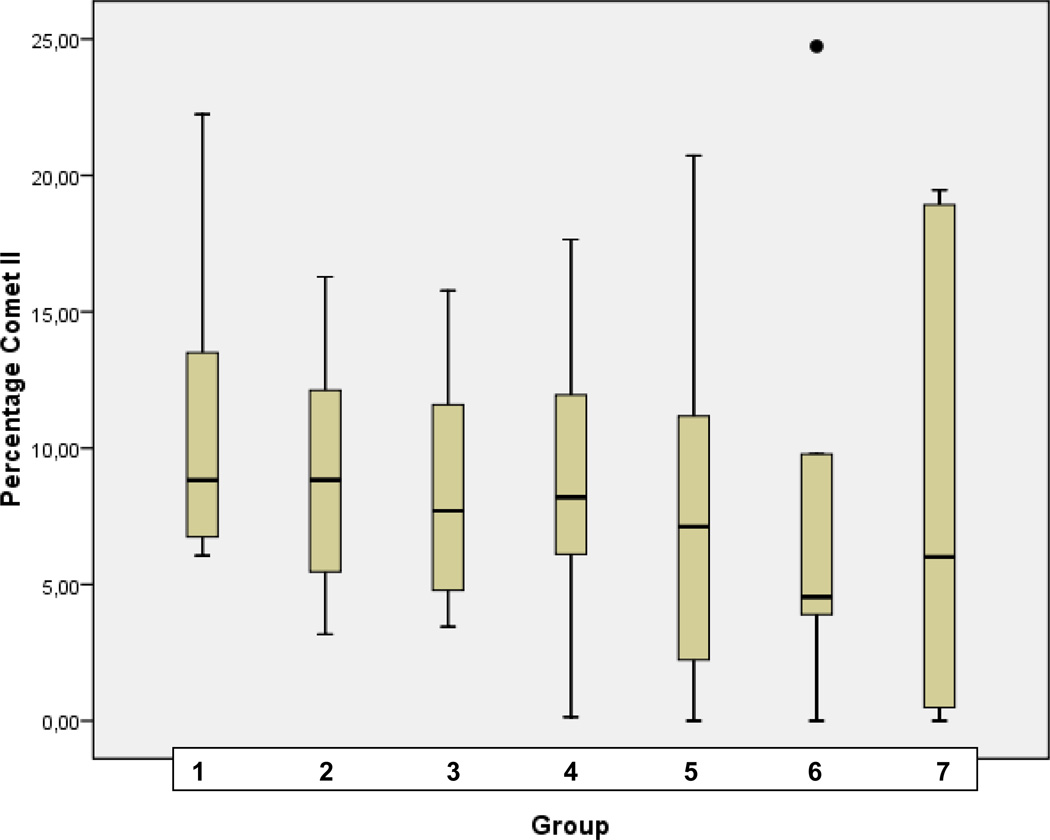
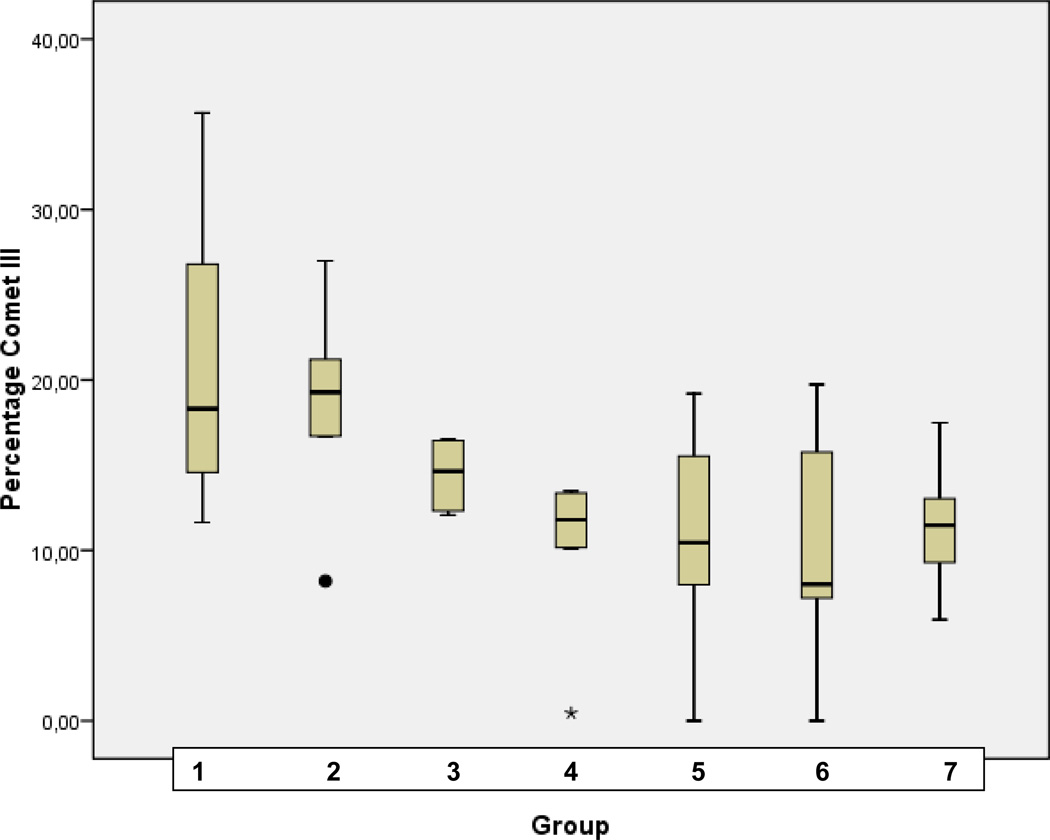
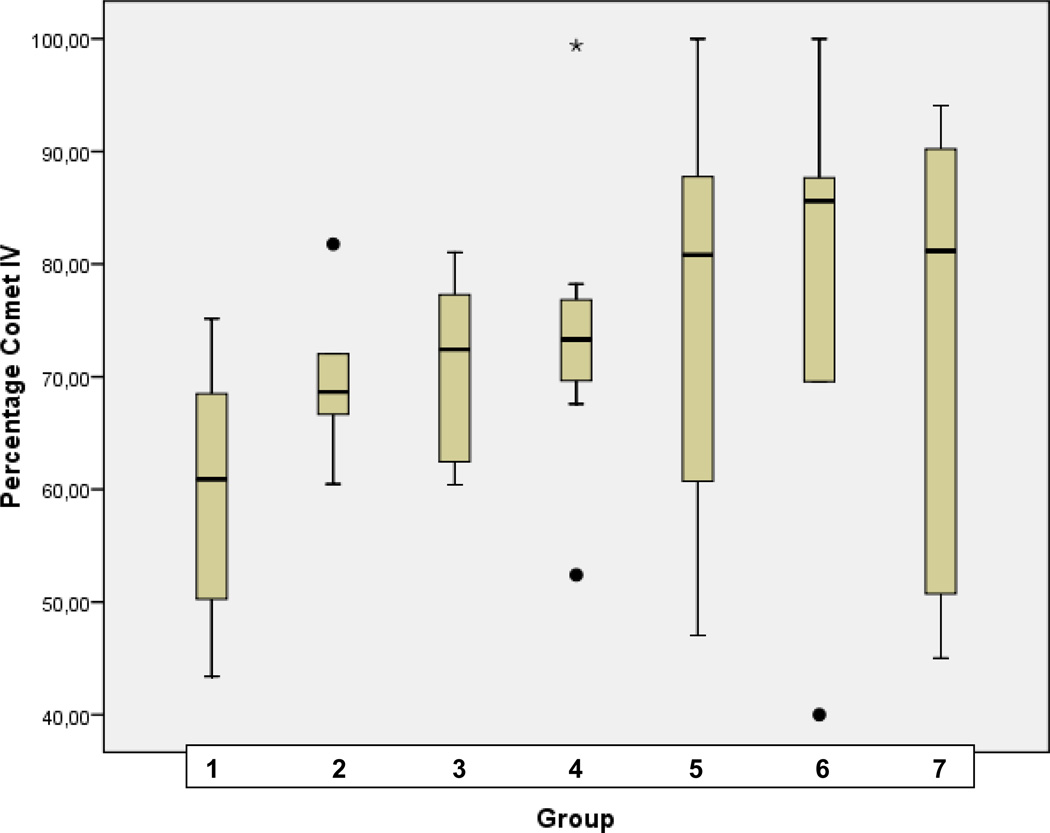
Statistical analysis for corresponding distribution of comet classes I, II, III, and IV in patterns of groups of comparison (1–7) is demonstrated in Fig. 3A, B, C, and D, respectively.
Fig. 3.
A Statistical analyses performed for the comet class I in groups of comparison (1–7) as described in Table 1 (“Experimental design”). Analyses were carried out using SPSS 17.0 software (SPSS, Chicago, USA) by the application of univariable variance analyse Bonferroni.
B Statistical analyses performed for the comet class II in groups of comparison (1–7) as described in Table 1 (“Experimental design”). Analyses were carried out using SPSS 17.0 software (SPSS, Chicago, USA) by the application of univariable variance analyse Bonferroni.
C Statistical analyses performed for the comet class III in groups of comparison (1–7) as described in Table 1 (“Experimental design”). Analyses were carried out using SPSS 17.0 software (SPSS, Chicago, USA) by the application of univariable variance analyse Bonferroni.
D Statistical analyses performed for the comet class IV in groups of comparison (1–7) as described in Table 1 (“Experimental design”). Analyses were carried out using SPSS 17.0 software (SPSS, Chicago, USA) by the application of univariable variance analyse Bonferroni.
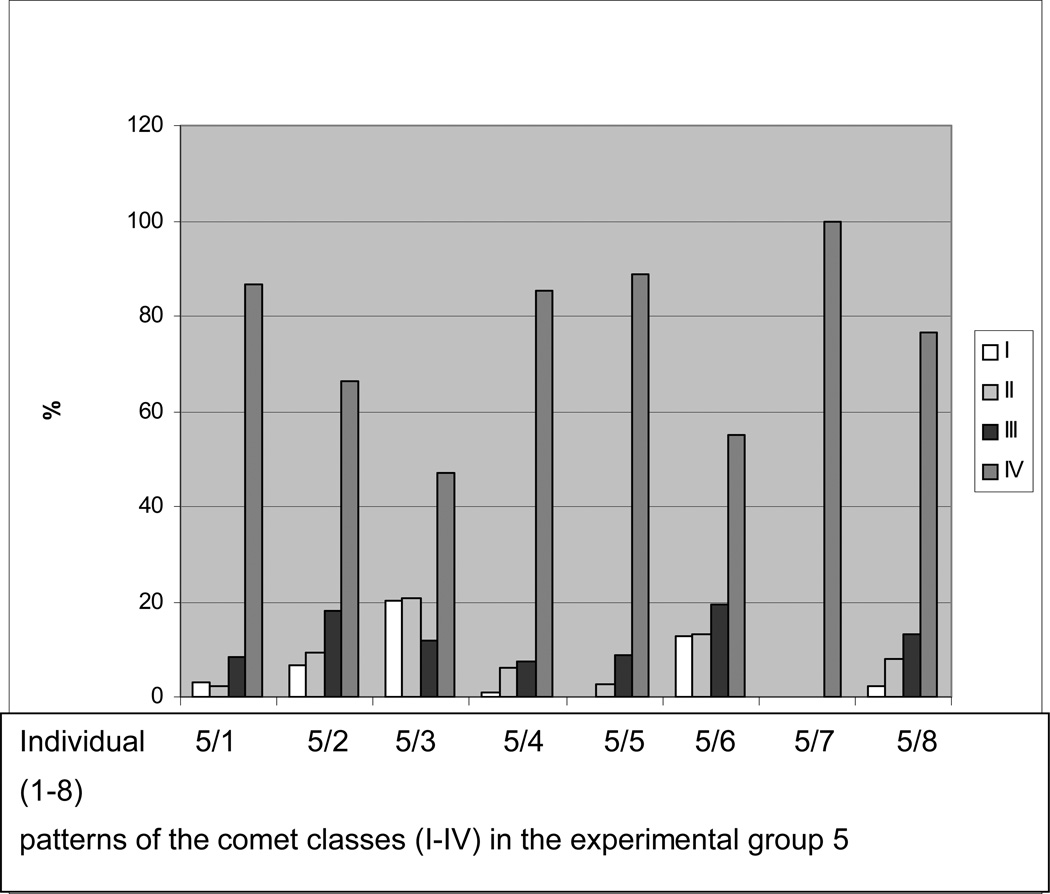
Individual comet patterns determined in the group 5 with high dosis of CrPic applied during the longest period of time is demonstrated in Figure 4.
Figure 4.
Individual comet patterns determined in the group 5 with high dosis of CrPic applied during the longest period of time (see Table 1, “Experimental design”). This group demonstrates the highest rate of individual reactions towards the treatment (see the statistical analysis in Figures 3A–D). The greatest contrast is created beween two individual patterns, namely 5/3 (four comet classes are clearly represented) versus 5/7 (the pattern is represented solely by comet class IV). Among 8 samples, 3 demonstrate underrepresentation of intact DNA, namely 5/4, 5/5 and 5/7.
Evaluation of specific expression patterns by “Western-blot”-analysis
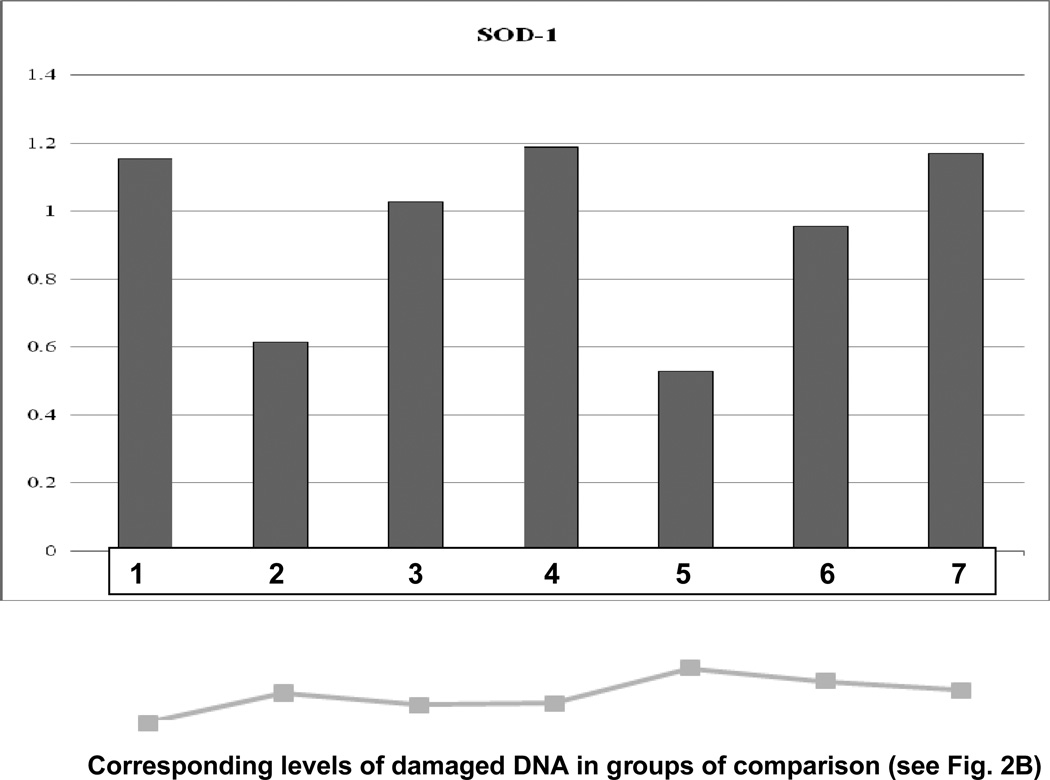
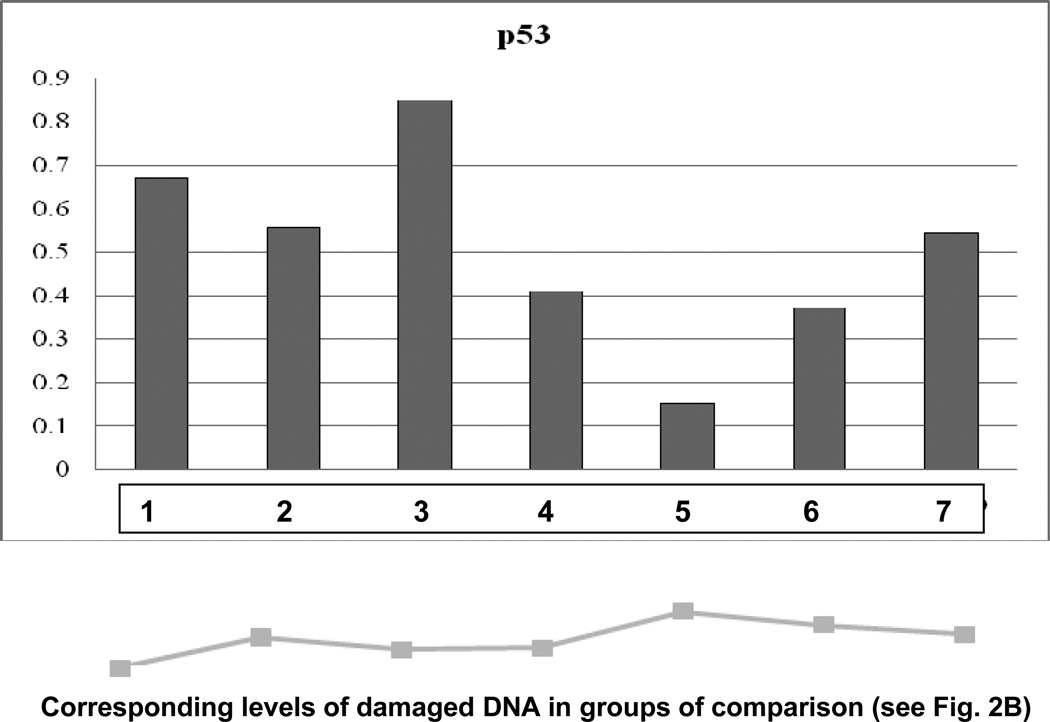
Molecular patterns characteristic for each group of comparison are demonstrated in Fig. 5A and 5B. Corresponding subcellular imaging of damages cells (see “Comet Assay” above) are given for each group to show the correlation between molecular and subcellular levels. The lowest level of both SOD-1 and P53 was monitored in group 5 with longest duration of the treatment and highest dosis of CrPic for this treatment algorythm. The suppression of both genes correlates well with the highest level of DNA damaged in this group.
Fig. 5.
A Specific expression patterns of SOD-1 monitored for each group of comparison. The expression levels were analysed by “Western-blot”. Normalised median values are represented. Expression rates of the target protein were normalised by corresponding rates of β-actin - the house keeping gene. The below graph shows percentage of corresponding amount of damaged DNA measured at subcellular level by “Comet Assay”-analysis.
B Specific expression patterns of P53 monitored for each group of comparison. The expression levels were analysed by “Western-blot”. Normalised median values are represented. Expression rates of the target protein were normalised by corresponding rates of β-actin, the house keeping gene. The below graph shows percentage of corresponding amount of damaged DNA measured at subcellular level by “Comet Assay”-analysis.
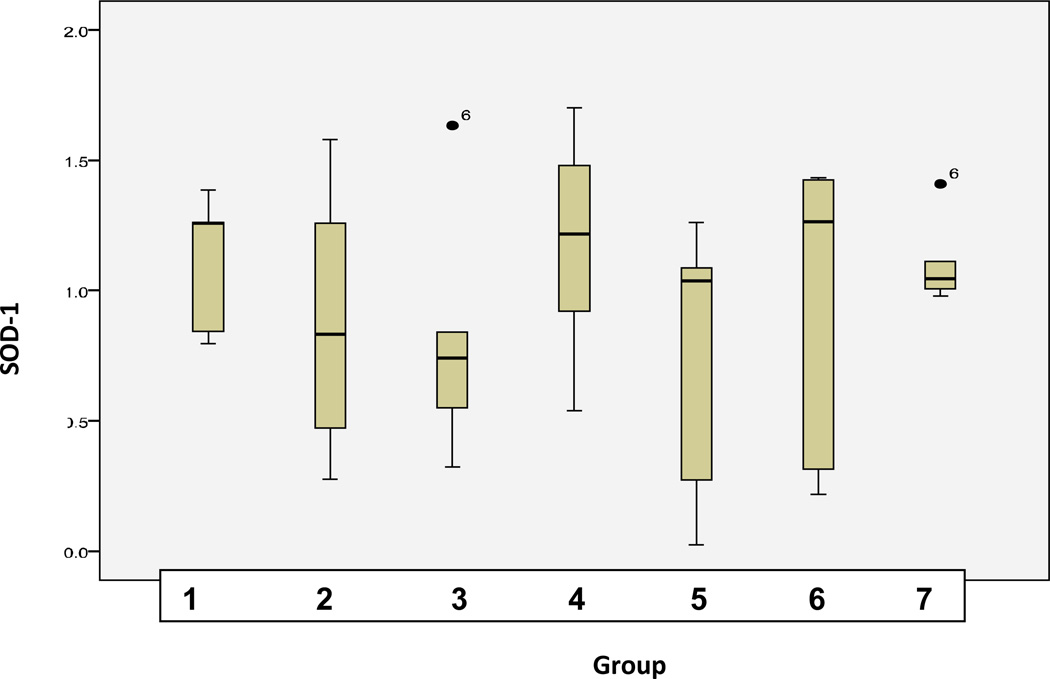
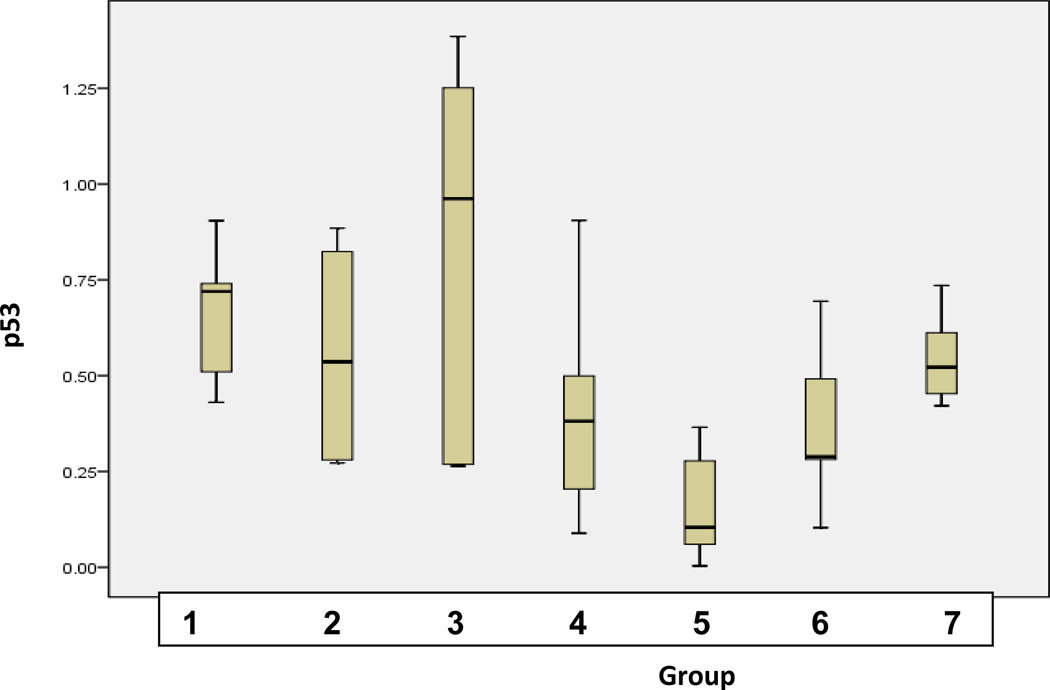
Statistical analysis was performed (Fig. 6) in order to examine the significance of interrelations for protein expression differences among groups of comparison. ANOVA (analysis of variance) test was used. The level of significance was chosen at p<0.05. The test showed significance of 0.531 for SOD-1 and 0.003 for p53.
Fig. 6.
A Statistical analyses of expression levels of SOD-1 measured in groups of comparison as described in Table 1 (“Experimental design”). Analyses were carried out using SPSS 17.0 software (SPSS, Chicago, USA) by the application of univariable variance analysis Bonferroni.
B Statistical analyses of expression levels of SOD-1 measured in groups of comparison as described inTable 1 (“Experimental design”). Analyses were carried out using SPSS 17.0 software (SPSS, Chicago, USA) by the application of univariable variance analysis Bonferroni.
Discussion
Subcellular imaging in untreated diabetic group revealed increased DNA-damage compared to the healthy control group
Quantitative subcellular imaging by “Comet Assay”-analysis revealed significantly higher DNA-damage in untreated diabetic group compared to healthy controls that is well in agreement with previous data published and reviewed earlier for diabetic patients (15, 19–21, 37). Both comets class III and IV were representatively increased in diabetic group that together give a clue about damaged DNA. In contrast, all controls obligatory demonstrated class I comets with intact DNA.
Individuality within untreated diabetic group
Although subcellular imaging generally revealed group-specific patterns when diabetic animals were compared with controls, however, high heterogeneity was demonstrated within untreated diabetic group: in some animals intact DNA (class I comets) was monitored, whereas only comet classes with damaged DNA was monitored for others. This heterogeneity clearly demonstrates individualized reaction of organism towards diabetic condition. This is a very important observation that well corresponds with the clinic picture of diabetes (15). Hence, we conclude that the animal model used is suitable for issue-related studies to simulate medical condition of diabetes.
Highly individual reaction of diabetic animals towards CrPic-treatments
Despite group-specific patterns, the subcellular imaging of comet assay indicated that each animal within a group responded individually to the same dosage of CrPic administered and treatment duration. Within diabetic groups, experimental animals demonstrated highly individual comet patterns with respect to single dosages and treatment algorithms. This observation is important in regard of highly individual response to the treatment algorithms applied. We conclude individual reaction of diabetic animals towards doses and duration of CrPic treatment. This observation can explain discrepancies in the literature concerning harmful effects of CrPic-therapy (28–33). Our interpretation is an individual reaction towards CrPic-treatments unpredictable for a patient-cohort as a whole.
Highest variability of DNA-damage under prolonged treatment with high dosage of CrPic
Statistical analysis revealed high variability of comet patterns under CrPic treatment. In particular, individual patterns differ in the level of intact and apoptotic DNA. However, among other groups of comparison, the highest level of variability has been monitored in the experimental group 5, where high dosage of CrPic has been applied during prolonged time-frame of the treatment. The samples of this group can be clearly ditinguished between two sub-groups, where A. all comet classes are repsented and B. intact DNA is underrepresented or even completely absent (see Figure 4). Particularities of this experimental group have been monitored also at the level of expression patterns – see the results interpretation provided below.
Comparative quantification of DNA-damage under CrPic treatment revealed group-specific patterns
The highest rate of apoptotic cells (class IV comets) was monitored in diabetic animals treated with the highest doses of CrPic namely in groups 5, 6 and 7. Further, the overall highest amount of damaged DNA was registered under the longest treatment with high doses of the agent (group 5). In contrast, almost no difference in comet distribution was monitored between groups 3 and 4 with low doses of CrPic (5 mg/kg and 10 mg/kg, correspondingly) and the comet patterns were intermediate between these of untreated diabetic and control animals.
Stress- and detoxification-specific protein expression profiling in groups of comparison
SOD-1 expression patterns were comparable with exception of two groups namely untreated diabetised animals (group 2) and diabetic animals under the longest treatment with high doses of CrPic (group 5): in both groups SOD-1 expression level was significantly lower. This result demonstrates suppressed central detoxification pathway in untreated diabetes and under the longest treatment with high doses of agent and correlates well with the highest DNA damage in the treated group 5. Further, statistical analysis revealed high heterogeneity of SOD-1 expression in both groups that supplementary to subcellular imaging as commented above stresses an individual reaction towards diabetic condition and high-doses CrPic treatments.
P53 expression patterns demonstrated even more conclusive result in groups of comparison, namely the dosage dependent suppression of P53 under CrPic treatments. Only the administration of the lowest doses of the agent (5 mg/kg, group 3) increased P53 expression, whereas a doubled amount of CrPic applied (10 mg/kg, group 4) was the dosage high enough to suppress P53 expression. The lowest P53 expression level accompanied with the highest DNA damage was monitored in group 5. A possible interpretation of the result may be a potential genotoxic and mutagenic effect of CrPic, further pronounced under long treatment with high doses of the agent as it has been proposed by several studies carried our earlier (29–35).
Interpretation, recommendations and outlook
Taken the above observations together we conclude possible risks for individual long-term effects, when chromium-picolinate is being used freely as a therapeutic nutritional modality agent without application of advanced diagnostic tools to predict individual risks and outcomes. Population at-risk for diabetes is huge and increasing in pandemic scale. One of the reasons might be the failed attempt to prevent the disease by application of artificial supplements and drugs with hardly recognised individual risks. Consequently, a multimodal approach of integrative medicine by predictive diagnostics, targeted prevention and individually created treatment algorithms is highly desirable.
Definitely CrPic-therapy is only one example of several therapy forms which currently are applied “across-the-board” in diabetes care. As discussed and reviewed earlier more individualised treatment algorithms are desirable to ensure the effective protection against diabetic retinopathy, poly-neuropathy, diabetes-related cardiovascular complications and cancer (15). Further field-related research is needed to establish possibly non-invasive diagnostic approaches for routine medical practice which would allow for an accurate prediction of individualised therapy risks and outcomes’ quality. A promising technological platform has been recently created using approaches with the detection of circulating nucleic acids in blood plasma (38) and clinical proteomics of body fluids (18).
Targeted measures require a creation of new guidelines essential to regulate (renoprotective) therapy approaches and application of more individualised therapeutic modalities for advanced Diabetes care. These measures should provide a legitimate regulation for well-timed predictive diagnostics, an effective prevention and creation of individualised treatment algorithms in pre/diabetes (39).
Acknowledgements
The project has been granted by NIH (“Is chromium-picolinate renoprotective in diabetes?”, National Institutes of Health, study no. 1R21 AT003012-01A1). The authors thank to Prof. Dr. M. Mozaffari (Medical College of Georgia, Augusta, USA) for providing tissue samples in the project. For the performance of “Western-blot” analysis, the authors thank to Mrs. G. Windisch-Schuster, Department of Radiology, University of Bonn. For the statistical analysis and assistance in preparation of the original paper (40), the authors thank to V. Peeva, M.Sc. and A. Shenoy, M.Sc., University of Bonn, Germany.
References
- 1.Golubnitschaja O. Three Levels of Prediction, Prevention & Individualised Treatment Algorithms to Advance Diabetes Care: Integrative Approach. In: Mozaffari MS, editor. Predictive, Preventive and Personalised Medicine in Advanced Diabetes Care. Springer; 2012. in press. [Google Scholar]
- 2.de la Monte SM. Contributions of brain insulin resistance and deficiency in amyloid-related neurodegeneration in Alzheimer’s disease. Drugs. 2012;72:49–66. doi: 10.2165/11597760-000000000-00000. [DOI] [PMC free article] [PubMed] [Google Scholar]
- 3.Rahim MA, Hussain A, Azad Khan AK, Sayeed MA, Keramat Ali SM, Vaaler S. Rising prevalence of type 2 diabetes in rural Bangladesh: a population based study. Diabetes. Res. Clin. Pract. 2007;77:300–305. doi: 10.1016/j.diabres.2006.11.010. [DOI] [PubMed] [Google Scholar]
- 4.Nolan JJ, O’Halloran D, McKenna TJ, Firth R, Redmond S. The cost of treating type 2 diabetes (CODEIRE) Ir Med J. 2006;99:307–310. [PubMed] [Google Scholar]
- 5.Wild S, Roglic G, Green A, Sicree R, King H. Global prevalence of diabetes: estimates for the year 2000 and projections for 2030. Diabetes Care. 2004;27:1047–1053. doi: 10.2337/diacare.27.5.1047. [DOI] [PubMed] [Google Scholar]
- 6.Kowluru V, Kowluru RA. Increased oxidative stress in diabetes regulates activation of a small molecular weight G-protein, H-Ras in the retina. Mol. Vis. 2007;13:602–610. [PMC free article] [PubMed] [Google Scholar]
- 7.Azimi-Nezhad M, Ghayour-Mobarhan M, Parizadeh MR, Safarian M, Esmaeili H, Parizadeh SM, Khodaee G, Hosseini J, Abasalti Z, Hassankhani B, Ferns G. Prevalence of type 2 diabetes mellitus in Iran and its relationship with gender, urbanisation, education, marital status and occupation. Singapore Med J. 2008;49:571–576. [PubMed] [Google Scholar]
- 8.Cebioglu M, Golubnitschaja O. New tendencies in the epidemiology of Diabetes mellitus. In: Golubnitschaja O, editor. Predictive Diagnostics and Personalized Treatment: Dream or Reality. New York: Nova Science Publishers Inc; 2009. pp. 151–156. [Google Scholar]
- 9.George B, Cebioglu M, Yeghiazaryan K. Inadequate diabetic care: global figures cry for preventive measures and personalized treatment. EPMA J. 2010;1:13–18. doi: 10.1007/s13167-010-0006-5. [DOI] [PMC free article] [PubMed] [Google Scholar]
- 10.Connolly V, Unwin N, Sherriff P, Bilous R, Kelly W. Diabetes prevalence and socioeconomic status: a population based study showing increased prevalence of type 2 diabetes mellitus in deprived areas. J Epidemiol Community Health. 2000;54:173–177. doi: 10.1136/jech.54.3.173. [DOI] [PMC free article] [PubMed] [Google Scholar]
- 11.Xu F, Yin XM, Zhang M, Leslie E, Ware R, Owen N. Family average income and diagnosed Type 2 diabetes in urban and rural residents in regional mainland China. Diabet. Med. 2006;23:1239–1246. doi: 10.1111/j.1464-5491.2006.01965.x. [DOI] [PubMed] [Google Scholar]
- 12.King GL. The role of inflammatory cytokines in diabetes and its complications. J Periodontol. 2008;79:1527–1534. doi: 10.1902/jop.2008.080246. [DOI] [PubMed] [Google Scholar]
- 13.Potenza MA, Gagliardi S, Nacci C, Carratu’ MR, Montagnani M. Endothelial dysfunction in diabetes: from mechanisms to therapeutic targets. Curr. Med. Chem. 2009;16:94–112. doi: 10.2174/092986709787002853. [DOI] [PubMed] [Google Scholar]
- 14.Skljarevski V, Veves A. Impact of diabetes on vasculature: focus on nervous system. Curr Diabetes Rev. 2005;1:245–253. doi: 10.2174/157339905774574284. [DOI] [PubMed] [Google Scholar]
- 15.Golubnitschaja O. Advanced Diabetes care: three levels of prediction, prevention & personalized treatment. Curr Diabetes Rev. 2010;6:42–51. doi: 10.2174/157339910790442637. [DOI] [PubMed] [Google Scholar]
- 16.Yeghiazaryan K, Bauriedel G, Schild HH, Golubnitschaja O. Prediction of degeneration of native and bioprosthetic aortic valves: issue-related particularities of diabetes mellitus. Infect Disord Drug Targets. 2008;8:88–99. doi: 10.2174/187152608784746547. [DOI] [PubMed] [Google Scholar]
- 17.Yeghiazaryan K, Skowasch D, Bauriedel G, Schild H, Golubnitschaja O. Degenerative valve disease and bioprostheses: risk assessment, predictive diagnosis, personalised treatments. EPMA J. 2011;2:91–105. doi: 10.1007/s13167-011-0072-3. [DOI] [PMC free article] [PubMed] [Google Scholar]
- 18.Golubnitschaja O. Clinical Proteomics in Application to Predictive Diagnostics and Personalized Treatment of Diabetic Patients. Curr Proteomics. 2008;5:35–44. [Google Scholar]
- 19.Cebioglu M, Schild HH, Golubnitschaja O. Diabetes mellitus as a risk factor for cancer: stress or viral etiology? Infect Disord Drug Targets. 2008;8:76–87. doi: 10.2174/187152608784746501. [DOI] [PubMed] [Google Scholar]
- 20.Cebioglu M, Schild HH, Golubnitschaja O. Diabetes mellitus as a Risk Factor for Cancer: Is Predictive Diagnosis Possible? In: Golubnitschaja O, editor. Predictive Diagnostics and Personalized Treatment: Dream or Reality? New York: Nova Science Publishers Inc; 2009. pp. 247–262. [Google Scholar]
- 21.Cebioglu M, Schild H, Golubnitschaja O. Cancer predisposition in diabetics: risk factors considered for predictive diagnostics and targeted preventive measures. EPMA J. 2010;1:130–137. doi: 10.1007/s13167-010-0015-4. [DOI] [PMC free article] [PubMed] [Google Scholar]
- 22.Antić M, Jotić A, Radović M, Seferović JP, Lalić NM, Jovanović D, Lezaić V. [Risk factors for the development of diabetic nephropathy] Srp Arh Celok Lek. 2009;137:18–26. doi: 10.2298/sarh0902018a. [DOI] [PubMed] [Google Scholar]
- 23.Lewis EJ, Lewis JB. Treatment of diabetic nephropathy with angiotensin II receptor antagonist. Clin. Exp. Nephrol. 2003;7:1–8. doi: 10.1007/s101570300000. [DOI] [PubMed] [Google Scholar]
- 24.Noh J-H, Kim S-K, Cho Y-J, Nam H-U, Kim I-J, Jeong I-K, Choi M-G, Yoo H-J, Ahn Y-H, Bae H-Y, Jang HC. Current status of diabetes management in elderly Koreans with diabetes. Diabetes. Res. Clin. Pract. 2007;77(Suppl 1):S71–S75. doi: 10.1016/j.diabres.2007.01.047. [DOI] [PubMed] [Google Scholar]
- 25.Jana M, Rajaram A, Rajaram R. Chromium picolinate induced apoptosis of lymphocytes and the signaling mechanisms thereof. Toxicol. Appl. Pharmacol. 2009;237:331–344. doi: 10.1016/j.taap.2009.04.006. [DOI] [PubMed] [Google Scholar]
- 26.Vincent JB. Elucidating a biological role for chromium at a molecular level. Acc. Chem. Res. 2000;33:503–510. doi: 10.1021/ar990073r. [DOI] [PubMed] [Google Scholar]
- 27.Andersson MA, Petersson Grawé KV, Karlsson OM, Abramsson-Zetterberg LAG, Hellman BE. Evaluation of the potential genotoxicity of chromium picolinate in mammalian cells in vivo and in vitro. Food Chem. oxicol. 2007;45:1097–1106. doi: 10.1016/j.fct.2006.11.008. [DOI] [PubMed] [Google Scholar]
- 28.Rhodes MC, Hébert CD, Herbert RA, Morinello EJ, Roycroft JH, Travlos GS, Abdo KM. Absence of toxic effects in F344/N rats and B6C3F1 mice following subchronic administration of chromium picolinate monohydrate. Food Chem. Toxicol. 2005;43:21–29. doi: 10.1016/j.fct.2004.08.006. [DOI] [PubMed] [Google Scholar]
- 29.Bailey MM, Sturdivant J, Jernigan PL, Townsend MB, Bushman J, Ankareddi I, Rasco JF, Hood RD, Vincent JB. Comparison of the potential for developmental toxicity of prenatal exposure to two dietary chromium supplements, chromium picolinate and [Cr3O(O2CCH2CH3)(6(H2O)3] +, in mice. Birth Defects Res. B Dev. Reprod. Toxicol. 2008;83:27–31. doi: 10.1002/bdrb.20140. [DOI] [PubMed] [Google Scholar]
- 30.Speetjens JK, Collins RA, Vincent JB, Woski SA. The nutritional supplement chromium(III) tris(picolinate) cleaves DNA. Chem. Res. Toxicol. 1999;12:483–487. doi: 10.1021/tx9900167. [DOI] [PubMed] [Google Scholar]
- 31.Kareus SA, Kelley C, Walton HS, Sinclair PR. Release of Cr(III) from Cr(III) picolinate upon metabolic activation. J. Hazard. Mater. 2001;84:163–174. doi: 10.1016/s0304-3894(01)00199-6. [DOI] [PubMed] [Google Scholar]
- 32.Manygoats KR, Yazzie M, Stearns DM. Ultrastructural damage in chromium picolinate-treated cells: a TEM study. Transmission electron microscopy. J. Biol. Inorg. Chem. 2002;7:791–798. doi: 10.1007/s00775-002-0357-z. [DOI] [PubMed] [Google Scholar]
- 33.Stearns DM, Silveira SM, Wolf KK, Luke AM. Chromium(III) tris(picolinate) is mutagenic at the hypoxanthine (guanine) phosphoribosyltransferase locus in Chinese hamster ovary cells. Mutat. Res. 2002;513:135–142. doi: 10.1016/s1383-5718(01)00301-1. [DOI] [PubMed] [Google Scholar]
- 34.Hepburn DDD, Xiao J, Bindom S, Vincent JB, O’Donnell J. Nutritional supplement chromium picolinate causes sterility and lethal mutations in Drosophila melanogaster. Proc. Natl. Acad. Sci. U.S.A. 2003;100:3766–3771. doi: 10.1073/pnas.0636646100. [DOI] [PMC free article] [PubMed] [Google Scholar]
- 35.Stallings DM, Hepburn DDD, Hannah M, Vincent JB, O’Donnell J. Nutritional supplement chromium picolinate generates chromosomal aberrations and impedes progeny development in Drosophila melanogaster. Mutat. Res. 2006;610:101–113. doi: 10.1016/j.mrgentox.2006.06.019. [DOI] [PubMed] [Google Scholar]
- 36.Golubnitschaja O, Moenkemann H, Kim K, Mozaffari MS. DNA damage and expression of checkpoint genes p21(WAF1/CIP1) and 14-3-3 sigma in taurine-deficient cardiomyocytes. Biochem. Pharmacol. 2003;66:511–517. doi: 10.1016/s0006-2952(03)00285-5. [DOI] [PubMed] [Google Scholar]
- 37.Golubnitschaja O. Diabetes mellitus. In: Golubnitschaja O, editor. Predictive Diagnostics and Personalized Treatment: Dream or Reality? New York: Nova Science Publishers Inc; 2009. pp. 147–150. [Google Scholar]
- 38.Gahan PB. Circulating nucleic acids in plasma and serum: roles in diagnosis and prognosis in diabetes and cancer. Infect Disord Drug Targets. 2008;8:100–108. doi: 10.2174/187152608784746484. [DOI] [PubMed] [Google Scholar]
- 39.Golubnitschaja O, Costigliola V. Common origin but individual outcomes: time for new guidelines in personalized healthcare. Per Med. 2010;7:561–568. doi: 10.2217/pme.10.42. [DOI] [PubMed] [Google Scholar]
- 40.Yeghiazaryan K, Peeva V, Shenoy A, Schild HH, Golubnitschaja O. Chromium-picolinate therapy in diabetes care: molecular and subcellular profiling revealed a necessity for individual outcome prediction, personalised treatment algorithms and new guidelines. Infect Disord Drug Targets. 2011;11:188–195. doi: 10.2174/187152611795589717. [DOI] [PMC free article] [PubMed] [Google Scholar]


