

Abstract
We investigated the relationship between state excise taxes and liquor prices in eight states, using 2012 data for 45 brands. We made 6,042 price observations among 177 liquor stores with online prices. Using a hierarchical model, we examined the relationship between excise taxes and product prices. State excise taxes were significantly related to liquor prices, with an estimated pass-through rate of 0.93. The proportion of price accounted for by excise taxes averaged 7.0%. We find that excise taxes do increase the price of alcohol, but states are not taking advantage of this opportunity to reduce alcohol-related morbidity and mortality.
Keywords: Alcohol, alcohol brands, excise taxes, price, states
INTRODUCTION
Alcohol use is a continuing public health problem, both generally (1, 2) and among underage youth (3). One of the factors known to strongly influence both adult and youth drinking, as well as several adverse consequences associated with alcohol use, is price (4). Numerous studies have demonstrated that alcohol prices are inversely correlated with alcohol consumption (5, 6) and that increased prices lead to reductions in both the frequency of drinking and the prevalence of heavy drinking among youth (4, 5, 7). For this reason, increasing state-level alcohol excise taxes is an important public health strategy (6, 8–10).
The effectiveness of excise tax increases in reducing population-level alcohol consumption depends on whether these taxes actually lead to higher retail prices (11, 12). This is an open question, particularly in an era when the magnitude of these taxes, in real terms, has eroded significantly in most states. A related question is whether states with higher excise taxes actually have higher alcohol prices. In 2011, for example, state-level excise taxes on liquor ranged from a minimum of $2.00 per gallon in Missouri to a maximum of $12.80 in Alaska (13). Do the alcohol retail prices in these states fully reflect this six-fold difference in excise tax rates? To the best of our knowledge, this question has not recently been examined.
There are several reasons why alcohol excise tax rates may not fully correlate with retail prices. First, excise tax increases may not be completely passed through to retail prices, especially in highly competitive markets, which are common in non-control states (11, 14). Since the rate (α) at which a tax is passed on to price is measurable, this possibility can be empirically tested. If the increase is fully passed through to price (i.e., a one cent increase in tax results in a one cent increase in price), then α will be 1.0. If not, then α will be less than 1.0. If the price increase actually exceeds the tax increase, then α will have a value greater than 1.0.
Three prior studies have suggested that increases in alcohol excise taxes are more than fully passed through to retail prices. Cook examined data on tax increases and associated price changes in 39 license states between 1960 and 1975, but for only one brand of liquor. He estimated α to be 1.2 (15). Young and Bielinska-Kwapisz (16), using prices for one brand each of beer, liquor, and wine for the period 1982–1997, estimated α to be 1.7 for the beer, 1.6 for the liquor, and 1.2 for the wine (16). Kenkel (11) examined prices in 403 stores before and after Alaska implemented a tax increase in 2002. The estimated α ranged between 0.9 and 2.1 for six brands of beer and between 1.7 and 2.1 for six brands of liquor (11). There are several important gaps in the existing literature on excise tax pass-through rates. First, we are not aware of any estimates calculated in the past seven years. Second, all of the previous estimates were based on data for a small number of brands. Since there is substantial variability in the tax pass-through rate among brands (11), it is not clear whether the previous studies derived estimates that were truly representative of all liquor brands.
Even if excise taxes are fully passed through to prices, there are additional reasons why excise tax rates may not fully correlate with alcohol prices at the state level. First, the price effect of excise taxes may have declined over time since they are volumetric taxes and do not increase with inflation. Second, there could be baseline price differences between states that enact substantial excise tax increases. Third, state-level covariates that relate to price, such as differences in per capita income, political factors, and various social factors, could affect pricing strategies for alcohol products that would obscure or override the effect of excise taxes.
In light of the existing literature’s limitations, this paper has three major aims: (1) to examine the relationship between state-specific liquor excise tax rates and state-specific liquor prices in 2012, using data from a large number of brands, in order to determine whether differences in state excise tax rates translate into differences in actual alcohol prices between the states; (2) to estimate pass-through rates for liquor excise taxes based on a large sample of brands among multiple states; and (3) to examine the magnitude of excise taxes as a proportion of overall brand prices.
METHODS
Sample Selection
A list of 80 potential brands was developed by identifying the brands sold in all 15 control states with prices listed online (n=74) and adding six additional brands that were among the top 45 distilled spirits brands in 2009 as listed by Impact Databank, a market research firm serving the alcoholic beverage industry. From this list, we selected the top five liquor brands (in terms of U.S. market share) in each of nine categories: bourbon, brandy/cognac, cordials/liqueurs, gin, rum, scotch, tequila, vodka, and whiskey. For each brand, we chose a specific product and container size based on which item was most widely available, as determined by our previous study (17). Because control states do not have liquor excise taxes per se, we restricted our study to alcohol prices in license states. We obtained state excise tax rates for liquor at 40% alcohol by volume from the Tax Foundation (13), which published the state tax rates as of September 1, 2011, and then checked legislative statutes to confirm that none of the states increased their rates in 2012.
Price information was obtained via the internet using online alcohol stores, searchable databases containing alcohol prices and Google Shopping from February through May 2012. To ensure that the prices encountered on the internet were comparable to those found in brick-and-mortar outlets, we excluded store web sites that offered only online sales. Additionally, in-store prices for one product (1800 Silver Tequila, 750 mL) were checked at 25 randomly selected stores via phone. For 23 of the 25 stores (92.0%), the in-store price was identical to the online price. For the other two stores, the online price was either 5.0% or 9.7% higher than the in-store price. Therefore, the average product price obtained from the 25 online price quotes differed from the average of the actual in-store prices by only 0.48%. We also excluded stores that did not sell at least 20 of the 45 products we had selected for examination.
We identified a total of 224 stores in 24 license states that met the above criteria. However, some states were represented by only a small number of stores. In order to ensure that the sample size would be large enough to yield a relatively stable estimate of brand-specific prices in each state, we elected to include only those states for which we were able to identify more than 10 retail stores. The total number of stores in these eight states was 177 (Table 1). The states and the number of stores per state included in our analyses were: California (18), Colorado (12), Connecticut (14), Florida (17), Massachusetts (16), Minnesota (11), New Jersey (38), and New York (51). The total number of priced products was 6,042.
TABLE 1.
Description of Study Sample
| State | 2010 Population (millions) | 2010 Total liquor consumption (millions of gallons)a | Proportion of overall liquor consumption in 32 license States | 2012 Liquor excise tax rateb (in dollars per gallon) | Tax rate rank (1–32) | Stores (N) |
|---|---|---|---|---|---|---|
| California | 37.3 | 52.2 | 15.5 | $3.30 | 24 | 18 |
| Colorado | 5.0 | 10.1 | 3.0 | $2.28 | 31 | 12 |
| Connecticut | 3.6 | 6.3 | 1.9 | $5.40 | 13 | 14 |
| Florida | 18.8 | 35.7 | 10.6 | $6.50 | 5 | 17 |
| Massachusetts | 6.5 | 11.3 | 3.3 | $4.05 | 18 | 16 |
| Minnesota | 5.3 | 11.0 | 3.3 | $5.03 | 14 | 11 |
| New Jersey | 8.8 | 15.2 | 4.5 | $5.50 | 10 | 38 |
| New York | 19.4 | 27.7 | 8.2 | $6.44 | 6 | 51 |
| Total | 104.7 | 169.4 | 50.4 | 177 |
Distilled Spirits Council of the United States. Apparent Consumption of Distilled Spirits by State, in Wine Gallons. Washington, DC: Distilled Spirits Council of the United States, 2012. Available at: http://www.discus.org/pdf/DS_Sales_Volume_December_2010_Preliminary.PDF, accessed May 9, 2012.
Applies to products with 40% alcohol by volume. The Tax Foundation. (2012). State Spirits Excise Tax Rates on Spirits, as of September 1, 2011. Washington, DC: The Tax Foundation. Available at: http://www.taxfoundation.org/taxdata/show/26078.html, accessed May 23, 2012. Legislative statutes in all states were reviewed to ensure that there were no subsequent changes in 2012.
Data Analysis
To investigate whether state liquor excise taxes are a significant predictor of retail prices, we conducted a linear regression analysis with the listed price for a given product in a given store in a given state as the dependent variable. The primary predictor variable was the state-specific excise tax for a given brand. Because the priced products were clustered within stores, which were themselves clustered within states, we analyzed the data using a three-level hierarchical linear model. We treated the data as consisting of products (level 1) nested within stores (level 2) nested within states (level 3). We began by entering alcohol brands into the model as fixed effects (level 1), with random effects entered for store (level 2) and state (level 3). In this model specification, the regression coefficient for excise tax indicated the increase in product price for each $1.00 increase in excise tax. Thus, this regression coefficient provided an estimate of the excise tax pass-through rate. Our primary model included only one covariate other than the fixed effect for brand: excise tax. However, in an additional model specification, we also controlled for four potential confounding factors: per capita income in each state, the adult per capita liquor consumption in each state in 2010, the adult per capita number of off-premises liquor outlets in each state in 2011, and the March 2012 consumer price index reported by the U.S. Department of Labor for urban regions in each state.
RESULTS
Description of Sample
Our sample consisted of 177 stores in eight license states (Table 1). These eight states had a population of 104.7 million in 2010, which represented 48.0% of the combined total population of the 32 license states. Annual liquor consumption in these eight states was 169.4 million gallons, or 50.4% of the total liquor consumption in all 32 license states combined. The number of stores per state ranged from 11 in Minnesota to 51 in New York, with an average of 22 stores per state. The excise liquor tax rates in the eight states ranged from a low of $2.28 per gallon in Colorado, which ranked 29th among the 32 license states, to a high of $6.50 per gallon in Florida, which ranked fifth.
Differences in Alcohol Prices by State
The average price for the 45 products ranged from a low of $26.14 in California to a high of $32.96 in New York (Table 2). Overall, there was a moderate, although not statistically significant, correlation between the state liquor excise tax rate and the average alcohol retail price (r=0.40, p=0.33) (Figure 1). Several outlying points are notable. For example, Florida has the highest state liquor excise tax in our sample, but the second lowest average alcohol price. A series of paired t-tests indicated significant differences in brand-specific average alcohol prices between each pair of states except for Colorado-Minnesota and Massachusetts-New Jersey. Price differences by liquor type were similar to overall differences by state.
TABLE 2.
Average Price of Alcohol Brands By Type and State, 2012
| California | Colorado | Connecticut | Florida | Massachusetts | Minnesota | New Jersey | New York | Total | ||||||||||
|---|---|---|---|---|---|---|---|---|---|---|---|---|---|---|---|---|---|---|
|
| ||||||||||||||||||
| Price | (sd) | Price | (sd) | Price | (sd) | Price | (sd) | Price | (sd) | Price | (sd) | Price | (sd) | Price | (sd) | Price | (sd) | |
| Bourbon | 27.89 | (10.57) | 29.15 | (11.05) | 34.41 | (12.35) | 29.01 | (11.48) | 33.69 | (12.53) | 33.45 | (12.97) | 34.30 | (11.65) | 36.04 | (13.07) | 32.24 | (11.24) |
| Brandy/Cognac | 21.95 | (9.06) | 23.14 | (7.37) | 25.14 | (7.87) | 22.29 | (6.38) | 22.96 | (11.45) | 23.00 | (7.39) | 25.64 | (8.31) | 26.32 | (8.68) | 23.80 | (7.8) |
| Cordials/Liqueurs | 17.28 | (3.84) | 17.90 | (4.35) | 20.19 | (5.) | 18.00 | (5.01) | 20.47 | (6.33) | 17.79 | (5.31) | 20.10 | (5.24) | 21.62 | (5.57) | 19.17 | (4.89) |
| Gin | 25.11 | (7.23) | 28.84 | (9.91) | 29.22 | (9.41) | 26.08 | (7.73) | 31.33 | (9.59) | 28.38 | (10.57) | 31.51 | (11.1) | 33.81 | (11.61) | 29.29 | (9.25) |
| Rum | 19.84 | (3.7) | 20.38 | (4.88) | 24.53 | (5.71) | 19.13 | (4.02) | 26.16 | (6.04) | 21.69 | (5.35) | 24.83 | (3.85) | 26.84 | (7.51) | 22.92 | (5.57) |
| Scotch | 32.35 | (10.12) | 39.17 | (13.74) | 39.23 | (12.82) | 34.13 | (11.13) | 41.31 | (15.08) | 37.55 | (12.71) | 38.17 | (12.2) | 44.30 | (16.41) | 38.27 | (12.45) |
| Tequila | 36.95 | (28.75) | 39.34 | (30.75) | 44.04 | (26.55) | 39.52 | (26.38) | 46.23 | (30.02) | 38.24 | (23.81) | 43.24 | (24.34) | 43.63 | (29.38) | 41.40 | (25.2) |
| Vodka | 31.04 | (16.06) | 29.36 | (12.98) | 31.58 | (14.69) | 30.00 | (14.69) | 33.97 | (16.2) | 31.13 | (13.36) | 30.99 | (13.76) | 35.04 | (17.22) | 31.64 | (13.65) |
| Whiskey | 22.85 | (9.58) | 22.84 | (12.19) | 23.91 | (10.85) | 23.40 | (9.61) | 27.11 | (14.66) | 24.81 | (11.64) | 25.81 | (13.39) | 29.03 | (15.67) | 24.97 | (11.41) |
| All brands combined | 26.14 | (13.37) | 27.79 | (14.63) | 30.25 | (14.07) | 26.84 | (13.14) | 31.47 | (15.87) | 28.45 | (13.32) | 30.51 | (13.51) | 32.96 | (15.80) | 29.30 | (14.29) |
Figure 1.
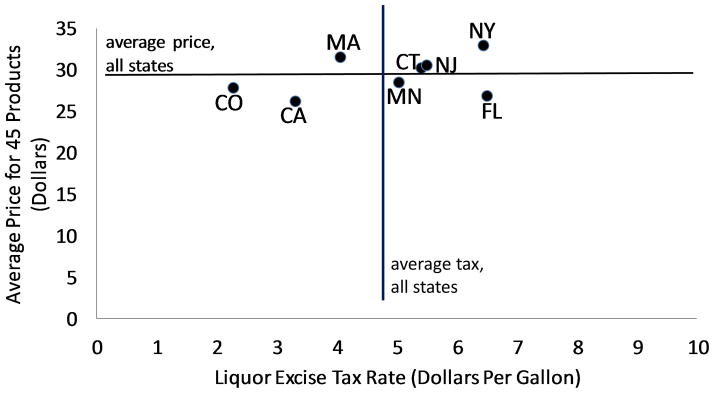
Relationship between average state-specific prices for 45 alcoholic beverage products and state liquor excise tax rates
Relationship between Excise Tax and Alcohol Price
Using HLM 7.0, we ran a baseline model in which we included fixed effects for alcohol brand at level 1, but without the excise tax variable or state-specific predictors (Table 3). Based on the reported variance components, 45% of the variation in product prices occurred at the product level, 36% at the store level, and 18% at the state level. Each of these variance components was statistically significant.
TABLE 3.
Hierarchical Linear Model Results: Effect of State Liquor Excise Taxes on Brand-Specific Pricesa
| Model | Fixed effects
|
Variance componentsb | |||||
|---|---|---|---|---|---|---|---|
| Variable | Coefficient | 95% Confidence interval (Significance level) | Level 1 | Level 2 | Level 3 | ||
| Brand fixed effects | --- | --- | --- | 13.05 | 10.48 | 5.33 | |
| Add excise tax | Excise tax | 0.93 | [0.50, 1.36] | (p<0.001) | 13.01 | 10.48 | 4.66 |
| Add state-level predictors | Per capita consumption | −0.88 | [−4.75,2.99] | (p=0.66) | 13.01 | 10.48 | 1.09 |
| Consumer price index | −0.60 | [−5.25,4.06] | (p=0.80) | ||||
| Per capita liquor outlets | −0.0050 | [−0.011, 0.0012] | (p=0.12) | ||||
| Per capita income | 0.00035 | [0.00015, 0.00054] | (p=0.0004) | ||||
| Excise tax | 0.86 | [0.42,1.30] | (p=0.0001) | ||||
Results of a series of three-level hierarchical linear models of products (level 1) nested within stores (level 2) nested within states (level 3), with the listed price for a given brand in a given store in a given state as the dependent variable. Fixed effects for brand and state-specific excise tax on a given brand were entered at level 1. State-level predictors of price (per capita income, adult per capita liquor consumption, adult per capita number of off-premises liquor outlets, and consumer price index) were entered at level 3.
Residual variance in brand price partitioned by level.
We then entered the state-specific excise tax for each product as a level 1 predictor (Table 3). The regression coefficient for excise tax was positive and significant (0.93, 95% confidence interval [CI]: 0.50–1.36). The regression coefficient of 0.93 suggests that the liquor excise tax rate is almost completely passed through to price. A likelihood ratio test indicated that the addition of excise tax to the model significantly improved the model fit. The addition reduced the level 3 variance component from 5.33 to 4.66, which indicates that differences in state excise taxes explain approximately 13% of the state-level variation in prices.
Finally, in an additional model, we added the state-level predictors (Table 3). The regression coefficient for excise tax changed only slightly (0.86, 95% confidence interval: 0.42–1.30). The variance components for levels 1 and 2 were unchanged. The variance component at level 3 decreased from 4.66 to 1.09, indicating that the state-level predictors accounted for 77% of the residual state-level price variation. Of the state-level predictors, one was statistically significant: per capita income, which was positively related to price.
Proportion of Price Accounted for by State Excise Taxes
The mean proportion of product price accounted for by state excise tax ranged from a low of 3.6% in Colorado to 10.2% in Florida, with an average of 7.0% across the eight states (Table 4). These proportions varied by alcoholic beverage type, with the mean proportions as follows: scotch: 4.7 %; cordials/liqueurs: 4.8%; tequila: 4.9%; brandy/cognac: 5.9%; bourbon: 7.7%; vodka: 8.1%; gin: 8.5%; rum: 8.6%; and whiskey: 10.2%.
TABLE 4.
Percentage of Price Accounted for by Tax – Eight States, 2012
| California | Colorado | Connecticut | Florida | Massachusetts | Minnesota | New Jersey | New York | Total | |
|---|---|---|---|---|---|---|---|---|---|
| Bourbon | 6.36 | 4.07 | 8.02 | 11.76 | 6.28 | 7.89 | 8.18 | 9.32 | 7.73 |
| Brandy/Cognac | 4.84 | 2.82 | 6.13 | 8.08 | 5.39 | 6.34 | 6.26 | 7.22 | 5.89 |
| Cordials/Liqueurs | 4.11 | 2.72 | 5.71 | 5.38 | 4.01 | 6.19 | 5.95 | 3.90 | 4.75 |
| Gin | 6.70 | 4.12 | 9.36 | 12.71 | 6.61 | 9.39 | 9.19 | 9.95 | 8.50 |
| Rum | 7.06 | 4.66 | 9.06 | 13.92 | 6.50 | 9.77 | 9.23 | 8.42 | 8.58 |
| Scotch | 3.70 | 2.12 | 5.07 | 6.98 | 3.68 | 4.84 | 5.40 | 5.47 | 4.66 |
| Tequila | 4.10 | 2.58 | 4.89 | 6.97 | 3.62 | 5.53 | 5.01 | 6.09 | 4.85 |
| Vodka | 5.96 | 4.11 | 8.99 | 11.73 | 6.44 | 8.55 | 9.37 | 10.01 | 8.14 |
| Whiskey | 7.75 | 5.43 | 11.72 | 14.37 | 8.22 | 10.81 | 11.43 | 12.23 | 10.24 |
| All brands combined | 5.62 | 3.63 | 7.66 | 10.21 | 5.64 | 7.70 | 7.78 | 8.07 | 7.04 |
DISCUSSION
To the best of our knowledge, this is the first study to examine the relationship between state liquor excise taxes and retail prices among a large sample of brands in multiple U.S. states. We found that state liquor excise taxes are significant predictors of liquor prices, and that these taxes are almost completely passed through to consumers. Even so, the excise taxes explain only a small proportion of the state-level variation in liquor prices, as these taxes represent a relatively small proportion of retail liquor prices. Our findings are consistent with previous studies that examined the relationship between alcohol excise taxes and prices (11,15,16), although the pass-through rate estimated in this study is lower than that reported in the previous studies.
As noted, state liquor excise taxes account for a very low proportion of price. This stands in stark contrast to the proportion of cigarettes prices accounted for by cigarette excise taxes in these same states. The proportion of retail liquor prices accounted for by excise taxes in the eight states ranged from 3.6% to 10.2% and averaged 7.0%, but in 2009 the proportion of cigarette prices accounted for by state cigarette excise taxes in these states ranged from 29% to 48% and averaged 39% (25). This discrepancy arises, in part, because nationally, state liquor excise taxes have not kept up with inflation (26).
We found that most of the state-level variation in liquor prices was attributable, not to excise tax differences, but to other state-level factors such as per capita income and adult per capita number of liquor outlets. Higher per capita income was associated with higher prices, and higher outlet density was associated with lower prices. State per capita income alone explained more than 80% of the state-level price variation. In Figure 1, which shows the relationship between average state-specific prices and liquor excise tax rates, the states above the line have a higher median per capita income than the average for the eight states, and the states below the line have a lower median per capita income than the overall average. Thus, the reason Florida has a lower than expected price may be that its per capita income is the lowest of the eight states in our sample.
Limitations
There are several important limitations of this study. First, the liquor stores with online price lists represent only a fraction of the liquor stores in each state. Although we limited our analyses to states where we located 11 or more stores with online price information, it remains possible that the sampled stores may not be representative of all liquor stores in a particular state. Moreover, because we included stores with posted online prices that carried at least 20 of the 45 products, our sample likely included relatively large stores. Since larger liquor stores tend to have lower prices, our sampling procedure may have led to an underestimate of the true prices in each state. An additional limitation is that not all license states were included in our sample, and these additional states may differ from the eight states we examined. That said, we generally sampled states with large population sizes, and therefore the eight states combined account for half of the liquor consumption in all 32 licensed states. We used posted retail prices and did not add sales or ad valorem taxes to those figures, and actual prices paid by consumers will also depend on whether alcohol is included in a state’s sales tax. For example, Massachusetts voters approved an initiative in 2011 that excluded alcohol from the state sales tax. Thus, prices in that state will be correspondingly lower than those in states that apply sales tax to alcohol products. Of the eight states we studied, only Minnesota has an ad valorem tax (a 2.5% tax) that applies to alcoholic beverages. Furthermore, there may be some discrepancy between internet prices and in-store prices, although our methods attempted to minimize this difference. It’s also important to recall that we examined only liquor prices, and therefore, our results cannot be generalized to beer or wine. Pass-through rates for beer and wine could be the focus of future investigations. Finally, we investigated prices only for brands that are common across all states. We did not include several very inexpensive brands that may be regional or even state-specific. Such brands are of particular interest since they may be preferred by heavy drinkers, and the percent of price made up by the excise tax would be higher for these brands. Future research should specifically examine differences in prices across states for these inexpensive alcohol brands. Because the study was cross-sectional, we were unable to examine the effect of excise tax changes on price changes. A more accurate assessment of excise tax pass-through rates would require a longitudinal study design. However, our findings are consistent with longitudinal studies that have demonstrated high pass-through rates of taxes to prices (11, 15, 16). Note that we examined only retail prices, not producer price differences among states.
Despite these limitations, this study demonstrates that state liquor excise taxes may have the potential to influence alcohol consumption by increasing the price of liquor, and that currently these taxes appear to be almost fully passed through to price. The study also reveals that liquor excise taxes are low in comparison to cigarettes. Increasing excise taxes may provide an opportunity for states to reduce alcohol-related morbidity and mortality.
Acknowledgments
This study was supported by the National Institute on Alcohol Abuse and Alcoholism grants R01 AA020309-01 and R01 AA018377.
This research was supported by the National Institute on Alcohol Abuse and Alcoholism grants R01 AA020309-01 and R01 AA018377. Dr. King gratefully acknowledges additional support from Pleiades Consulting Group, Inc.
Footnotes
Declaration of interest
None of the authors have any financial conflicts of interest to disclose.
Contributor Information
Michael Siegel, Department of Community Health Sciences, Boston University School of Public Health, Boston, Massachusetts, USA.
Jody Grundman, Department of Community Health Sciences, Boston University School of Public Health, Boston, Massachusetts, USA.
William DeJong, Department of Community Health Sciences, Boston University School of Public Health, Boston, Massachusetts, USA.
Timothy S. Naimi, Section of General Internal Medicine, Department of Medicine, Boston University School of Medicine, Boston, Massachusetts, USA.
Charles King, III, Pleiades Consulting Group, Lincoln, Massachusetts, USA.
Alison B. Albers, Department of Community Health Sciences, Boston University School of Public Health, Boston, Massachusetts, USA.
Rebecca S. Williams, University of North Carolina Center for Health Promotion and Disease Prevention, Chapel Hill, North Carolina, USA.
David H. Jernigan, Department of Health, Behavior and Society, Johns Hopkins Bloomberg School of Public Health, Baltimore, Maryland, USA.
References
- 1.Babor T, Caetano R, Casswell S, Edwards G, Giesbrecht N, Graham K, et al. Research and Public Policy. 2. Oxford, UK: Oxford University Press; 2010. Alcohol: No Ordinary Commodity. [Google Scholar]
- 2.Kanny D, Liu Y, Brewer RD. Vital signs: Binge drinking prevalence, frequency, and intensity among adults - United States. Morbidity and Mortality Weekly Report. 2012;61(1):14–19. [PubMed] [Google Scholar]
- 3.Eaton DK, Kann L, Kinchen S, Shanklin S, Flint KH, Hawkins J, et al. Youth risk behavior surveillance – United States, 2011. Morbidity and Mortality Weekly Report Surveillance Summaries. 2012;61:1–162. [PubMed] [Google Scholar]
- 4.Chaloupka FJ, Grossman M, Saffer H. The effects of price on alcohol consumption alcohol-related problems. Alcohol Research Health. 2002;26:22–23. [PMC free article] [PubMed] [Google Scholar]
- 5.Wagenaar AC, Salois MJ, Komro KA. Effects of beverage alcohol price and tax levels on drinking: A meta-analysis of 1003 estimates from 112 studies. Addiction. 2009;104:179–190. doi: 10.1111/j.1360-0443.2008.02438.x. [DOI] [PubMed] [Google Scholar]
- 6.Wagenaar AC, Tobier AL, Komro KA. Effects of alcohol tax and price policies on morbidity and mortality: A systematic review. American Journal of Public Health. 2010;100:2270–2278. doi: 10.2105/AJPH.2009.186007. [DOI] [PMC free article] [PubMed] [Google Scholar]
- 7.Grossman M, Chaloupka FJ, Saffer H, Laixuthai A. Effects of alcohol price policy on youth: A summary of economic research. Journal of Research on Adolescence. 1994;4:347–364. [Google Scholar]
- 8.Cook PJ, Moore MJ. The economics of alcohol abuse and alcohol-control policies. Health Affairs. 2002;21:120–133. doi: 10.1377/hlthaff.21.2.120. [DOI] [PubMed] [Google Scholar]
- 9.Hollingworth W, Ebel BE, McCarty CA, Garrison MM, Christakis DA, Rivara FP. Prevention of deaths from harmful drinking in the United States: the potential effects of tax increases and advertising bans on young drinkers. Journal of Studies on Alcohol. 2006;67:300–308. doi: 10.15288/jsa.2006.67.300. [DOI] [PubMed] [Google Scholar]
- 10.Task Force on Community Preventive Services. Increasing alcoholic beverage taxes is recommended to reduce excessive alcohol consumption and related harms. American Journal of Preventive Medicine. 2010;38:230–232. doi: 10.1016/j.amepre.2009.11.002. [DOI] [PubMed] [Google Scholar]
- 11.Kenkel DS. Are alcohol tax hikes fully passed through to prices? Evidence from Alaska. AEA Papers and Proceedings. 2005;95:273–277. [Google Scholar]
- 12.Kerr WC, Greenfield TK, Patterson D, Reiman A. Alcohol Policy Research & Alcoholic Beverage Control Systems: An Annotated Bibliography & Review. Alexandria, VA: National Alcohol Beverage Control Association; 2008. [Google Scholar]
- 13.The Tax Foundation. State Spirits Excise Tax Rates on Spirits, as of September 1, 2011. The Tax Foundation; 2012. [Accessed March 8, 2012]. http://www.taxfoundation.org/taxdata/show/26078.html. Published February 16, 2012. [Google Scholar]
- 14.Stern N. The effects of taxation, price control and government contracts in oligopoly and monopolistic competition. Journal of Public Economics. 1987;32:133–158. [Google Scholar]
- 15.Cook PJ. The effect of liquor taxes on drinking, cirrhosis, and auto accidents. In: Moore M, Gerstein D, editors. Alcohol and Public Policy: Beyond the Shadow of Prohibition. Washington, DC: National Academy Press; 1981. [PubMed] [Google Scholar]
- 16.Young DJ, Bielinska-Kwapisz A. Alcohol taxes and beverage prices. National Tax Journal. 2002;55:57–73. [Google Scholar]
- 17.DiLoreto JT, Siegel M, Hinchey D, Valerio H, Kinzel K, Lee S, et al. Assessment of the average price and ethanol content of alcoholic beverages by brand – United States. Alcoholism: Clinical & Experimental Research. 2012 doi: 10.1111/j.1530-0277.2011.01721.x. [DOI] [PMC free article] [PubMed] [Google Scholar]
- 18.Siegel M, DiLoreto J, Johnson A, Fortunato EK, DeJong W. Development and pilot testing of an internet-based survey instrument to measure the alcohol brand preferences of U.S. youth. Alcoholism: Clinical & Experimental Research. 2011b;35:765–772. doi: 10.1111/j.1530-0277.2010.01394.x. [DOI] [PubMed] [Google Scholar]
- 19.Williams RS, Ribisl KM. Internet alcohol sales to minors. Archives of Pediatrics & Adolescent Medicine. 2012 doi: 10.1001/archpediatrics.2012.265. [DOI] [PubMed] [Google Scholar]
- 20.Raudenbush SW, Bryk AS. Hierarchical Linear Models: Applications and Data Analysis Methods. 2. Thousand Oaks, CA: Sage Publications; 2002. [Google Scholar]
- 21.Distilled Spirits Council of the United States. Apparent Consumption of Distilled Spirits by State, in Wine Gallons. Distilled Spirits Council of the United States; [Accessed May 9, 2012]. http://www.discus.org/pdf/DS_Sales_Volume_December_2010_Preliminary.PDF. Published December 1, 2010. [Google Scholar]
- 22.The Beverage Information Group. Fact Book 2011. Norwalk, CT: The Beverage Information Group; 2011. [Google Scholar]
- 23.Albright JJ, Marinova DM. Estimating multilevel models using SPSS, Stata, SAS, and R. University of Indiana; [Accessed June 29, 2012]. http://www.indiana.edu/~statmath/stat/all/hlm/hlm.pdf. Published July 14,2010. [Google Scholar]
- 24.Singer JD. Using SAS PROC MIXED to fit multilevel models, hierarchical models, and individual growth models. Journal of Educational and Behavioral Statistics. 1998;24(4):323–355. [Google Scholar]
- 25.Orzechowski and Walker. The Tax Burden on Tobacco: Historical Compilation. Vol. 44. Arlington, VA: Orzechowski and Walker; 2009. [Google Scholar]
- 26.Xu X, Chaloupka FJ. The effects of prices on alcohol use and its consequences. Alcohol Research and Health. 2011;34(2):236–245. [PMC free article] [PubMed] [Google Scholar]