Abstract
We are interested in investigating white matter connectivity using a novel computational framework that does not use diffusion tensor imaging (DTI) but only uses T1-weighted magnetic resonance imaging. The proposed method relies on correlating Jacobian determinants across different voxels based on the tensor-based morphometry (TBM) framework. In this paper, we show agreement between the TBM-based white matter connectivity and the DTI-based white matter atlas. As an application, altered white matter connectivity in a clinical population is determined.
Index Terms: structural connectivity, brain network, tensor-based morphometry, white matter atlas
1. INTRODUCTION
We aim to investigate white matter connectivity using a novel computational framework that does not rely on diffusion tensor imaging (DTI) [1]. This new method instead uses T1-weighted MRI and relies on correlating Jacobian determinants (JD), which quantifies local tissue volume based on tensor-based morphometry (TBM) [2].
The idea of correlating local morphological features to construct a structural brain network had been considered earlier [3, 4]. The previous works mainly focused on the cortico-cortical connectivity using cortical thickness [3], which is defined along the gray matter. However, cortical thickness cannot be used in directly characterizing the connectivity within the white matter. To overcome the limitation of the previous studies, we has proposed to correlate the JD over different white matter voxels in determining association within the white matter. [1]. Previously, we demonstrated that it is possible to use T1-weighted MRI in quantifying a population-specific association in white matter without validation [1].
In this paper, we focus on validating the proposed method against the existing DTI-based white matter atlas (ICBM-DTI-81) [5]. We demonstrate that there is agreement between the TBM-based connectivity and the DTI-based white matter atlas. As an application, we compare the TBM-based network of children who experienced early maltreatment to the normal controls and determine the regions of abnormal white matter connectivity.
2. METHODS
2.1. Subjects and preprocessing
T1-weighted MRI were collected using a 3T GE SIGNA scanner 32 children who experienced maltreatment in their early stage of life in orphanages in East Europe and China but later adopted to the families in US (post-institutionalized; PI) and age-matched 33 normal controls (NC). Two groups were matched for age. The mean age for PI is 11.19 ± 1.73 years while that of NC is 11.48 ± 1.62 years. There are 13 boys and 19 girls in PI, and 20 boys and 13 girls in NC. A study-specific template construction and non-linear normalization of individual images were done by Advanced Normalization Tools (ANTS) [6].
2.2. Partial correlation on Jacobian determinants
Once we obtain the deformation field from the individual MRI to the template, we compute JD. The JD maps were smoothed with a Gaussian kernel with 2mm FWHM. Then we correlate JD across different voxels. The details on constructing JD-based correlation maps is given in [1]. Among the 336363 voxels with white matter density larger than 0.8, 12484 voxels were subsampled at every 3mm as possible network nodes. For the nodes i and j, we computed partial correlations of JD while factoring out the confounding effect of age and gender. This is done as follows:
-
Fit the general linear model (GLM) of the form
at each node independently using the least squares method.
Compute the residual between the observation and the model fit at each node.
Compute the Pearson correlation between the residuals on the nodes i and j. This Pearson correlation is the partial correlation.
We will only consider positive correlations as conventionally investigated in the many structural brain network studies [7]. This process of constructing TBM-based white matter connectivity is illustrated in Fig. 1
Fig. 1.
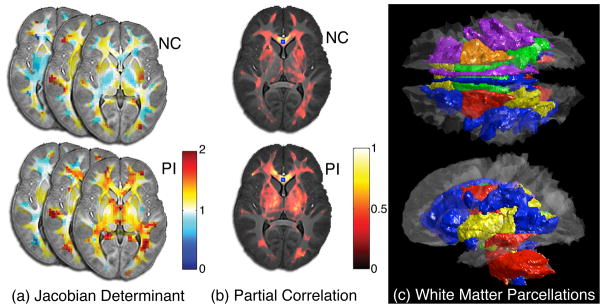
Illustration of TBM-based connectivity. First JD is computed (a), partial correlation is computed factoring out age and gender by taking the genu of the corpus callosum as the seed (b). Then it is compared to given the white matter parcellations based on DTI (c).
2.3. Connectivity between parcellations
The constructed partial correlation maps were compared against the DTI-based white matter atlas (ICBM-DTI-81) [5]. In the atlas, 50 anatomical subregions in white matter were manually parcellated by radiologists guided by the fractional anisotropy (FA) map and the orientation map based on DTI. The atlas does not segment all the white matter voxels into partitions, but only labels reliably identifiable voxels that correspond to the major fiber bundles such as corpus callosum, corona radiata and longitudinal fasiculus.
The ICBM-DTI-81 white matter parcellations are given in the MNI-152 template space. In order to normalize the white matter parcellations into our study-specific template, we first warped the MNI-152 T1-weighted template into our template, then applied the warping field to the parcellations. Fig. 1 (c) shows the superimposition of the 50 parcellations onto our template space. We assume that, if the white matter connectivity obtained from TBM follows that of DTI, the connectivity within a parcellation will be greater than the connectivity between different parcellations. Note that we should not expect any connectivity between different white matter parcellations.
The
 be the region containing a collection of nodes that belongs to the k-th parcellation. We do not have any nodes in
 and
and
 possibly because the parcellations are too small, thus they are excluded in the further analysis. The connectivity matrix X = (Xmn) between the parcellations is given by averaging partial correlations
over all possible connections:
| (1) |
where N is the total number of correlations.
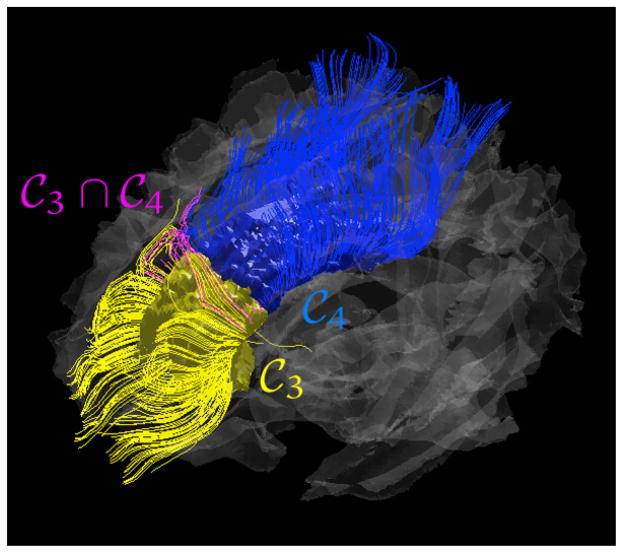
The diagonal elements in X measure connectivity within each parcellation. We will call the diagonal term as within-connectivity in this paper. The off-diagonal elements measure connectivity between two different parcellations, and will be called as between-connectivity. It is expected that there is no or minimal connectivity between distinct white matter parcellations. Fig. 2 shows the small number of tracts passing through both
 (the genu of corpus callosum) and
 (the midbody of corpus callosum) simultaneously, which usually occurs at the boundary of the two parcellations. Hence, if the TBM-based connectivity map really follows the underlying white matter fibers, the within-connectivity should be relatively larger than the between-connectivity.
Fig. 2.
An example of DTI fiber tracts that pass through the distinct parcellations
 (yellow) and
 (blue) and tracts that pass through
 and
and
 simultaneously (magenta).
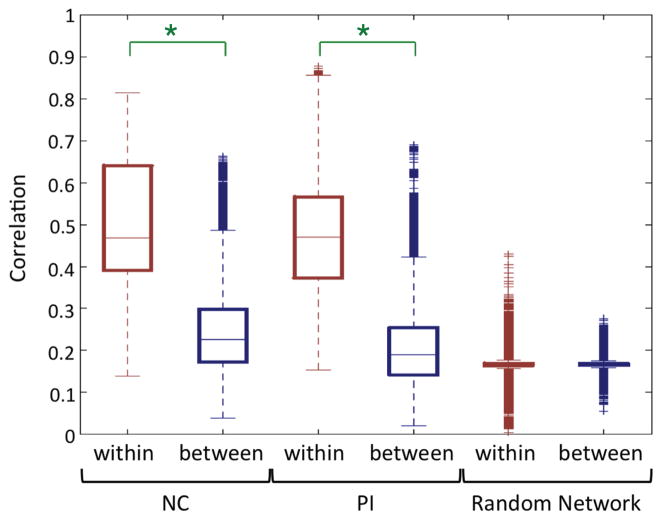
To test our hypothesis, we constructed 500 random networks as null models having no meaningful connections. The random networks are generated by simulating ρij as uniformly random variables in [−1, 1]. Then the corresponding connectivity matrix is also computed following (1). Connectivity matrices for NC-, PI-networks and one of 500 random networks are shown in Fig. 3. Then we tested if the median of the within-connectivity is different to the median of the between-connectivity using Wilcoxon rank sum test. Since we have only one connectivity matrix for a group, we used the jackknife resampling for inferences. In jackknifing on k subjects, one subject is removed and the remaining k − 1 subjects are used to generate a single network. This process is repeated for each subject to produce k networks.
Fig. 3.
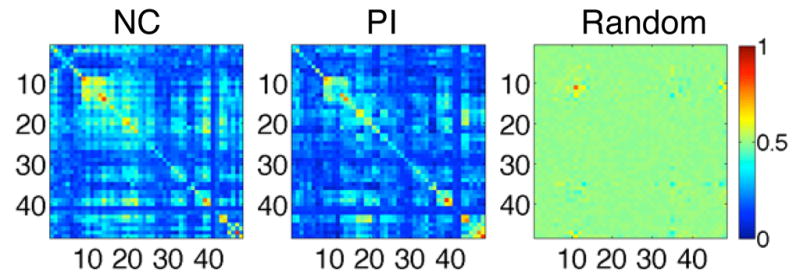
Estimated connectivity matrices Xmn for NC, PI and one of random networks.
We also tested if the connectivity is locally different between PI and NC. We only tested on the significance of diagonal elements Xmm since the off-diagonal elements are fairly noise and close to zero. The resulting p-values were corrected for multiple comparisons using the Bonferroni procedure.
3. RESULTS
The median of the within-connectivity is significantly greater than that of the between-connectivity both in the NC- and PI-networks (p < 0.001) whereas the difference is not significant in the random networks (p = 0.42) (Fig. 4). The result demonstrates that the proposed TBM-based connectivity really follows the underlying white matter fiber structures.
Fig. 4.
The Wilcoxon rank sum test was applied to testing the between- and within-connectivity difference in the NC-, PI-and random networks. Significant differences are indicated with asterisks at α = 0.001 level.
In the local inference on the network differences, we found significant differences in the within-connectivity between the NC and the PI (p < 0.01, Bonferroni corrected). The regions of significant network differences are shown in Fig. 5. We found smaller connectivity at the genu of corpus callosum (GCC) connecting anterior regions of hemispheres, and at the left superior corona radiata (SCR-L) connecting hypothalamic projection to the superior regions of neocortex (blue). We also found greater connectivities at three fiber bundles at the right external capsule (EC-R), the right fornix and stria terminalis (FX/ST-R) and the left superior cerebellar peduncle (SCP-L) (red).
Fig. 5.
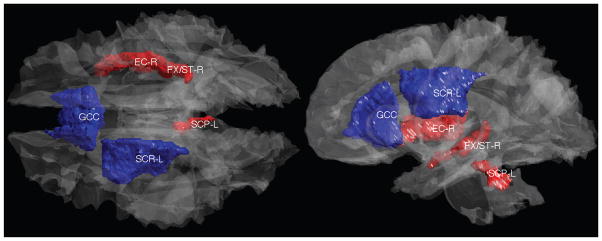
white matter parcellations that show significant group differences in the connectivity between NC and PI. The mean correlation is greater in the PI than the NC (red) at the right external capsule (EC-R), the right fornix and stria terminalis (FX/ST-R) and the left superior cerebellar peduncle (SCP-L). The mean correlation is smaller in the PI than the NC (blue) at the genu of corpus callosum (GCC) and the left superior corona radiata (SCR-L).
4. DISCUSSION
The within-connectivity is significantly greater than the between-connectivity in the human brain. The result suggests that the connectivity maps obtained in TBM is in agreement with the existing white matter fiber bundles. However, an analysis that factors out the high correlation in ROI due to spatial regularity of registration is needed as well as a further study that directly compares the TBM to DTI tractography in the same same subject. We also found the within-connectivity was locally different between the groups in few pacellations. According to a recent review [8], severe stress during the early developmental stage is found to related to atrophy in brain structures including the corpus callosum. Our result may be related to an altered integrity of white matter connectivity due to stressful early maltreatment.
Acknowledgments
This work was supported by National Institutes of Health Research Grants MH61285 and MH68858 to S.D.P., funded by the National Institute of Mental Health and the Childrens Bureau of the Administration on Children, Youth and Families as part of the Child Neglect Research Consortium, as well as National Institute of Mental Health Grant MH84051 to R.J.D. This research was also supported by World Class University program through the Korea Science and Engineering Foundation funded by the Ministry of Education, Science and Technology (R31-10089) to M.K.C.
References
- 1.Kim S-G, Chung MK, Hanson JL, Avants BB, Gee JC, Davidson RJ, Pollak SD. Structural connectivity via the tensor-based morphometryensor-based morphometry. IEEE International Symposium on Biomedical Imaging: From Nano to Macro; 30 2011–april 2 2011; pp. 808–811. [DOI] [PMC free article] [PubMed] [Google Scholar]
- 2.Chung MK, Worsley KJ, Paus T, Cherif DL, Collins C, Giedd J, Rapoport JL, Evans AC. A unified statistical approach to deformation-based morphometry. NeuroImage. 2001;14:595–606. doi: 10.1006/nimg.2001.0862. [DOI] [PubMed] [Google Scholar]
- 3.Lerch JP, Worsley K, Shaw WP, Greenstein DK, Lenroot RK, Giedd J, Evans AC. Mapping anatomical correlations across cerebral cortex (MACACC) using cortical thickness from MRI. Neuroimage. 2006;31(3):993–1003. doi: 10.1016/j.neuroimage.2006.01.042. [DOI] [PubMed] [Google Scholar]
- 4.Worsley KJ, Chen JI, Lerch J, Evans AC. Comparing functional connectivity via thresholding correlations and singular value decomposition. Philosophical Transactions of the Royal Society B: Biological Sciences. 2005;360(1457):913. doi: 10.1098/rstb.2005.1637. [DOI] [PMC free article] [PubMed] [Google Scholar]
- 5.Mori S, Oishi K, Jiang H, Jiang L, Li X, Akhter K, Hua K, Faria AV, Mahmood A, Woods R, et al. Stereotaxic white matter atlas based on diffusion tensor imaging in an ICBM template. Neuroimage. 2008;40(2):570–582. doi: 10.1016/j.neuroimage.2007.12.035. [DOI] [PMC free article] [PubMed] [Google Scholar]
- 6.Avants BB, Epstein CL, Grossman M, Gee JC. Symmetric diffeomorphic image registration with cross-correlation: Evaluating automated labeling of elderly and neurodegenerative brain. Medical image analysis. 2008;12(1):26. doi: 10.1016/j.media.2007.06.004. [DOI] [PMC free article] [PubMed] [Google Scholar]
- 7.He Y, Chen Z, Evans A. Structural insights into aberrant topological patterns of large-scale cortical networks in alzheimer’s disease. Journal of Neuroscience. 2008;28(18):4756. doi: 10.1523/JNEUROSCI.0141-08.2008. [DOI] [PMC free article] [PubMed] [Google Scholar]
- 8.Jackowski Andrea Parolin, de Araujo Celia, de Lacerda Acioly, de Jesus, Kaufman Joan. Neurostructural imaging findings in children with post-traumatic stress disorder: Brief review. Psychiatry and Clinical Neurosciences. 2009;63(1):1–8. doi: 10.1111/j.1440-1819.2008.01906.x. [DOI] [PMC free article] [PubMed] [Google Scholar]


