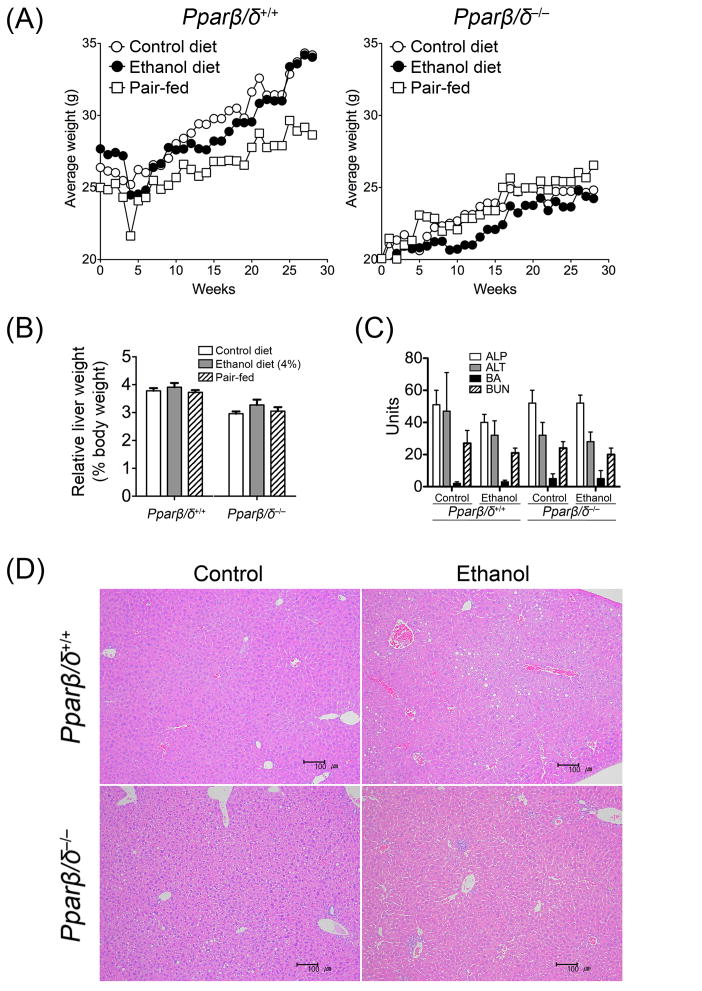
Fig. 1.
Effect of ethanol feeding on body weight, relative liver weight, serum markers of liver toxicity and liver histology in control, ethanol-fed, or pair-fed wild-type (Pparβ/δ+/+) and Pparβ/δ-null (Pparβ/δ−/−) mice after seven months of treatment. (A) Average body weight and (B) average relative liver weight in control, ethanol-fed, or pair-fed Pparβ/δ+/+ and Pparβ/δ−/− mice. (C) Average serum concentrations of ALP (U/L), ALT (U/L), BA (μM) and BUN (mg/dL) in control and ethanol-fed Pparβ/δ+/+ and Pparβ/δ−/− mice. Values represent the mean (body weight) or mean ± S.E.M. (relative liver weight and serum markers of liver toxicity). (D) Liver histology (HE staining) of Pparβ/δ+/+ and Pparβ/δ−/− mice after seven months of control (left panel) and 4% ethanol containing liquid diet (right panel) showing significant increase in lipid deposition in the ethanol-treated wild-type and control Pparβ/δ-null mice. Note immune cell infiltrate in the liver of Pparβ/δ-null mice fed the ethanol diet, an effect not found in similarly treated wild-type mice. Bar = 100 μm.

