

Abstract
We describe an improved method for comparative modeling, RosettaCM, which optimizes a physically realistic all-atom energy function over the conformational space defined by homologous structures. Given a set of sequence alignments, RosettaCM assembles topologies by recombining aligned segments in Cartesian-space and building unaligned regions de novo in torsion space. The junctions between segments are regularized using a loop-closure method combining fragment superposition with gradient-based minimization. The energies of the resulting models are optimized by all-atom refinement, and the most representative low energy model is selected. The CASP10 experiment suggests RosettaCM yields models with more accurate sidechain and backbone conformations than other methods when the sequence identity to the templates is greater than ∼15%.
Keywords: comparative modeling, protein structure prediction, CASP
Introduction
Protein structures are crucial to understanding biological function, but only a very small fraction of known proteins have experimentally determined structures; this fraction continues to decrease as high throughput sequencing identifies large numbers of new protein sequences. Fortunately, structures are now known for at least one representative of most protein families, and comparative modeling methods can be used to generate models of many proteins using these representative structures as starting points(Pieper et al., 2011).
Comparative modeling proceeds in two steps: first, the protein sequence being modeled is aligned to evolutionarily related sequences with known structures, and second, three dimensional models are built guided by information from these structures. Many excellent methods for comparative modeling have been developed, including the widely used MODELLER program(Eswar et al., 2006; Sali and Blundell, 1993) and, more recently, I-Tasser(Xu et al., 2011) and other methods that explicitly recombine multiple templates.
The Rosetta structure modeling methodology utilizes efficient conformational sampling techniques and a physically realistic all atom energy function to achieve atomic accuracy in many challenging structural biology problems, including structure determination with sparse experimental data and the design of new protein structures and interfaces(Fleishman et al., 2011; King et al., 2012; Raman et al., 2010). Previous comparative modeling efforts in Rosetta(Raman et al., 2009; Thompson and Baker, 2011) produced accurate models in some cases, but were unable to combine structural information from multiple templates.
Here we describe RosettaCM, a new comparative modeling method that assembles structures using integrated torsion-space based and Cartesian-space template fragment recombination, loop closure by iterative fragment assembly and Cartesian-space minimization, and high resolution refinement. Results from the CASP10 blind evaluation of current structure prediction methodology suggest that – given a set of input alignments to templates of known structure – the new protocol generates models with higher accuracy over all backbone and sidechain atoms than other current methods.
Results and Discussion
We begin with a brief overview of the RosettaCM protocol; a complete description is provided in the Experimental Procedure section. Starting from alignments of the query sequence to templates of known structure, which may be generated using remote homologue detection methods such as PsiBlast(Altschul et al., 1997) or HHsearch(Remmert et al., 2012), or using expert knowledge, RosettaCM builds models in three stages as outlined in Fig 1. In the first stage, the query sequence is threaded onto each of the templates, and the resultant threaded partial models are aligned in a single global frame. Full chain models are then generated by Monte Carlo sampling guided by the Rosetta low-resolution energy function supplemented with distance restraints from the template structures and a penalty for separation in space of residues adjacent in the sequence (Supplementary Fig. S1). Structures are built up using a Rosetta “fold tree”(Das and Baker, 2008): the global position of each segment is represented in Cartesian space, while the backbone and sidechain conformation of residues in each segment are represented in torsion space. Two types of Monte Carlo moves are used: first, substitution in of the torsion angles from a Rosetta de novo modeling fragment selected from the PDB using local sequence information (Fig 1B), and second, substitution in of the coordinates of a template segment (Fig 1C). This recombination of template-derived fragments in Cartesian space and Rosetta de novo fragments in torsion space generally converges to the correct topology, but the geometry at segment boundaries is often poor, with clashes, distorted peptide bonds, and poor backbone hydrogen bond geometry.
Figure 1.
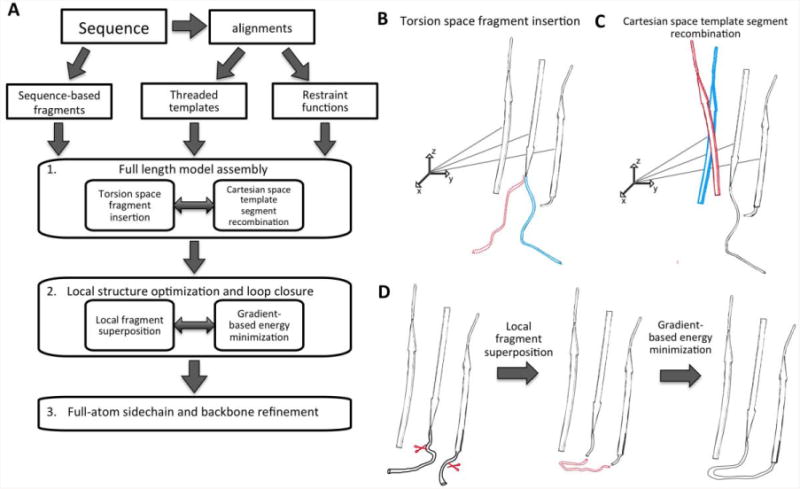
(A) RosettaCM protocol. (B) Torsion space fragment insertion in stage 1. Blue: before fragment insertion, red: after fragment insertion. Structures are built outwards from the origin (small coordinate system) using first the rigid body transforms to the centers of the segments and then the torsion angles from the centers to the end of the segments. Since the effects of torsion angle changes do not propagate beyond segment boundaries, the overall topology is better maintained than in conventional continuous chain torsion space Monte Carlo. (C) Recombination of template segments in Cartesian space. Blue, before and red, after segment replacement. (D) One of the two moves used in stage 2 sampling. First, the terminal residues of a de novo fragment are superimposed onto the current pose (red), and second, energy minimization smoothly resolves structural distortions introduced by the fragment superposition. The effects of modeling on proteins are illustrated in Supplementary Figure S1.
The second stage improves model geometry and further explores conformational changes away from the starting templates through Monte Carlo sampling with two-step moves (Fig 1D). In the first step, a backbone region is randomly selected and replaced by either a de novo fragment, which spans the region and has N- and C-termini that can be roughly superimposed on the corresponding residues in the current model, or a template derived fragment superimposed over all corresponding residues. The de novo fragment substitutions are biased towards regions with poor backbone bonded geometry, primarily the stage one segment boundaries. In the second step, quasi-Newton minimization is carried out over the entire protein in Cartesian space, using a smoothed version of the Rosetta low-resolution energy function(Rohl et al., 2004), to optimize backbone geometry and hydrogen bonding interactions. The result of Monte Carlo sampling using these composite fragment superposition and energy minimization moves is smooth and realistic loop closure – facilitated because the loop takeoff and return positions can shift to promote closure – where every local backbone segment is “protein-like” (Fig 1D, Supplementary Fig. S1-A). Finally, in the third stage, side chains are built on and the structure is optimized by standard Rosetta full-atom refinement using a physically realistic energy function(Tyka et al., 2011).
The balance between the Rosetta energy function, which favor physically realistic conformations, and the template derived restraint energy functions determines how close the resultant models are to the input template structures. This balance is set by a single overall weight, which we have optimized over a diverse training set as described in the Supplementary Information (Supplementary Fig. S3). In specific applications, the user may wish to alter this parameter, and to vary the extent to which each template/alignment contributes to the restraint functions. In the calculations described in the remainder of this paper, the overall weight was set to the value optimal for the training set, and the contributions of each alignment to the restraint functions were weighted based on the alignment likelihood, with close alignments contributing more strongly than weak alignments (see Supplementary Information, Fig S3).
A long-standing question in the structure prediction field is the extent to which comparative models improve over the available template structures. Many widely used comparative modeling packages and servers produce models that cover the entire sequence of a protein, whereas the available templates in general do not, hence comparative models generally have more residues superimposable on the actual structure than the original template. Less trivial are improvements in the aligned regions, which require shifts away from the starting template coordinates. To assess the extent to which RosettaCM improves models beyond the best available template over a large and unbiased set of structures, we participated in the CAMEO project (Continuous Automated Model Evaluation http://www.cameo3d.org/) in which recently solved structures deposited in the PDB but not yet publicly released are made available to prediction servers; all models must then be submitted prior to the public release data. Analysis of statistics collected between 05/01/2012 and 03/31/2013 by the CAMEO experiment showed that RosettaCM consistently improves over the available templates in the aligned regions (Supplementary Fig S2-A).
To compare RosettaCM to the earlier Rosetta “rebuild and refine” protocol (LoopRelax), a benchmark set was selected from CAMEO to cover different ranges of modeling difficulties (Supplementary Table 2). RosettaCM differs from the earlier protocol both in the explicit use of multiple templates and in the loop closure/structure optimization protocol. To separate out these effects, we first compared the methods using a single template for each case. As shown in (Supplementary Fig. S2), the new combination of fragment insertion and centroid mode Cartesian minimization improves over the cyclic coordinate descent method used in the earlier protocol; this is likely because the new protocol allows readjustments promoting loop closure over the whole backbone. Further improvements are observed (Supplementary Fig. S2) when multiple input templates are used in modeling compared to just using the top-ranked (in the sequence based search of the PDB) template; the explicit template recombination in RosettaCM is a considerable advantage when different parts of the query sequence are better modeled by different templates. The improvements over the earlier “rebuild and refine” protocol are primarily for intermediate difficulty targets (Supplementary Fig. S2-G).
It is not trivial to accurately assess the performance of a structure modeling method relative to methods developed by other groups. Even if the structure modeling software is available, there are generally a number of settings, and a non-expert may not run the calculations in an optimal way. For this reason, to evaluate the strengths and limitations of RosettaCM we analyze its performance in the CASP10 (Critical Assessment of Techniques for Protein Structure Prediction) structure prediction experiment. In CASP10 the RosettaServer ran the RosettaCM protocol starting from templates and alignments identified by HHsearch(Remmert et al., 2012), SPARKS-X(Zhou and Zhou, 2004), and RaptorX(Peng and Xu, 2009). As noted above, the accuracy of comparative models depends not only on the quality of the model building approach, but also on the input templates and alignments. To evaluate the new model building approach independent of template recognition and alignment generation, we focused on the subset of closer homology targets for which most methods used the same templates and alignments. We used the structural similarity (as measured by the GDT) between the first models submitted in the CASP10 experiment by the RosettaServer and the state of the art HHpredA (a widely used public server)(Soding et al., 2005) and ZhangServer (the top-performing server in CASP10) as a measure of the extent of convergence on templates and alignments. The 63 domains for which the average GDT between the first models was 70% or above were selected for detailed analysis (Supplementary Table 1) to reduce the impact of differences in template selection.
To compare the performance of the methods, we utilized statistics computed and made publicly available by the CASP10 (http://predictioncenter.org/casp10/) organizers (to be published, Proteins, 2013) and the Zhang lab (http://zhanglab.ccmb.med.umich.edu/casp10/). The accuracy of the modeled protein backbone was assessed using the GDT(Zemla et al., 1999), the accuracy of the sidechain placements by the GDC-SC(Zemla, 2003), and the accuracy of the polar interactions by the fraction of recovered native hydrogen bonds (see Supplementary Information for detailed descriptions of these metrics). According to all three metrics, on the 63 targets for which template selection and alignment generation were straightforward, the RosettaServer models were better than those of other servers both on average and in having the most top models (Fig 3). Overall stereochemical quality – as reported by the Molprobity score(Davis et al., 2007) – was also highest for the RosettaServer models. On the complete set of 127 domains, RosettaServer had the most top models (Fig 3, left), although the performance of the Zhang server was considerably better according to the standard CASP sum-of-Z-scores metric(Tramontano et al.) because the RosettaServer did quite poorly on several targets due to errors in template identification and domain parsing.
Figure 3.
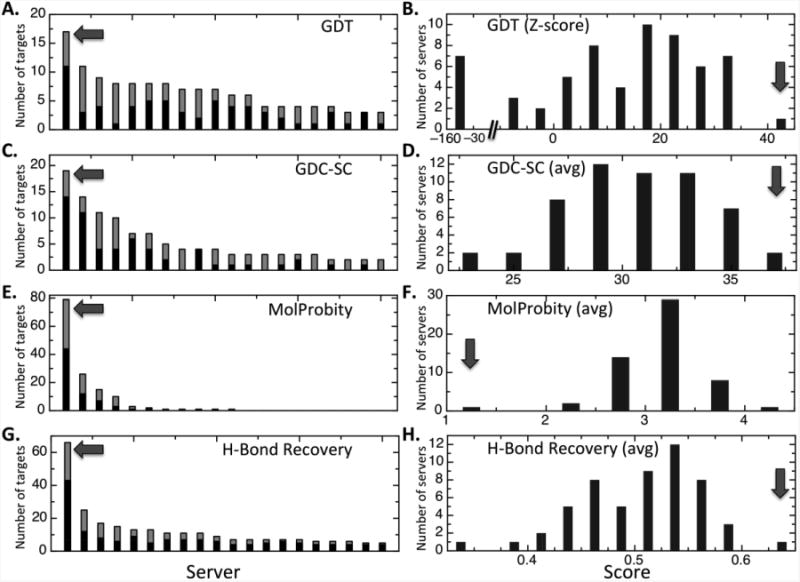
RosettaCM performance in CASP10. For each CASP10 target, performance statistics were downloaded from the CASP10 web site and used to rank the servers based on (A,B) global structural similarity, as measured by the GDT-TS metric(Zemla et al.), (C,D) accuracy of sidechain placement, as measured by the GDC-SC metric(Keedy et al., 2009), (E,F) stereochemical quality, as assesed by the Molprobity score(Davis et al., 2007), and (G,H) the fraction of native hydrogen bonds (http://zhanglab.ccmb.med.umich.edu/casp10/). Panels on the left (A,C,E,G) indicate, for each of the four metrics, the number of targets for which each server produced the best scoring model; servers are ordered on the x axis based on this number. The counts for the 63 easier target subset are shown in black, and those for the rest of the targets in grey. The arrow indicates the RosettaCM result. Panels on the right (B,D,F,H) are histograms of the sum or average of each of the four scores over the 63 easier target subset (B: sum of GDT-TS Z-scores; D,F,H: average GDC-SC, Molprobity score and fraction of native hydrogen bonds). The y axis is the number of of servers in the total score interval on the x-axis. Arrows indicate the RosettaCM score interval. Models with better stereochemistry have lower Molprobity scores. 7 servers with summed GDT-TS Z-score < -30 (panel B) were excluded from the GDC-SC, Molprobity, and native hydrogen bonds summaries since evaluations of sidechain and physical properties of the models are only meaningful when the global structure is correct
What is the origin of the improved model building performance evident in Fig 3? To build a good model, a comparative modeling method should (1) improve over the closest template in the aligned regions, and (2) properly reconstruct the loops and other regions not present in the templates. The CASP organizers determined how accurate each segment in each submitted model was relative to the most similar templates of known structure. As shown in Supplemental Figure S4, in the templates a large fraction of residues (>80%) are within 2Å of the corresponding residues in the native structures, and it is challenging to improve the regions that are further away without disrupting this large fraction of residues that already are reasonably accurate. RosettaCM handled this challenge reasonably well compared to other servers as assessed by the difference in the number of residues which were improved by more than 0.5Å and the number which were worsened by 0.5Å (Supplementary Fig S4-D).
The per-residue changes in model accuracy relative to the closest available templates for RosettaCM and several other top methods are compared in Fig 2B. Most residues are already quite close to the correct positions in the starting templates, and hence most frequently the deviations are close to zero. A subset of residues are in significantly different positions in the starting template and the actual structure, and for these residues modeling methods can make substantial improvements. For this subset, RosettaCM produced the largest number of improvements over the target set as indicated by the greater number of changes in deviations of more than 1.5Å. Of residues that are improved by over 1.5Å, 27% are on a helix, 3% are on a strand, and 70% are either on a loop structure or at the junction between a loop and a helix or strand.
Figure 2.
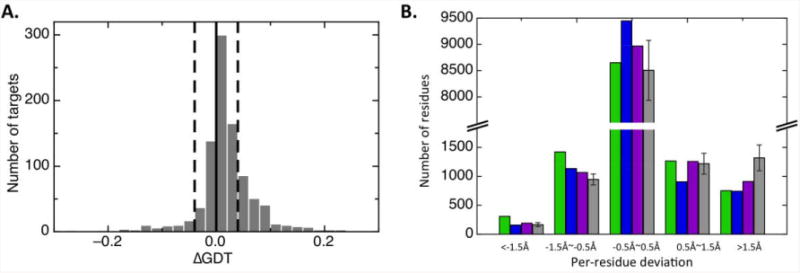
RosettaCM improves model accuracy in the aligned regions relative to starting template structures. (A) The distribution of ΔGDT for 847 targets used in CAMEO benchmark test, where ΔGDT is the difference in GDT between RosettaCM models and the top ranked template calculated over the aligned region (positive values are improvements) (B) Histogram of per-residue deviations between models and the best template over the 63-target subset from CASP10. Per-residue deviation data for each target were obtained from the CASP10 web page. Numbers of residues in different deviation ranges are shown for RosettaServer (green), HHPredA (blue), ZhangServer (magenta) and the average of the rest of the top 20 servers (grey). The standard deviations of the rest of the top 20 servers are shown as error bars.
Examples of the improvements are shown in Figure 4. In the top panel, the difference in model quality relative to the best template is shown along the linear sequence for the RosettaServer model and for several other top servers. The RosettaServer models show pronounced dips below the x-axis, indicating improvement relative to the best template. The structural comparisons in the lower insets illustrate structural changes taking place during modeling for the regions indicated by the red arrows. The most often observed scenario was improvement in loop regions (Fig 4A). Concerted improvements in secondary structure placement and loop geometry were also often observed (Fig 4B,C).
Figure 4.
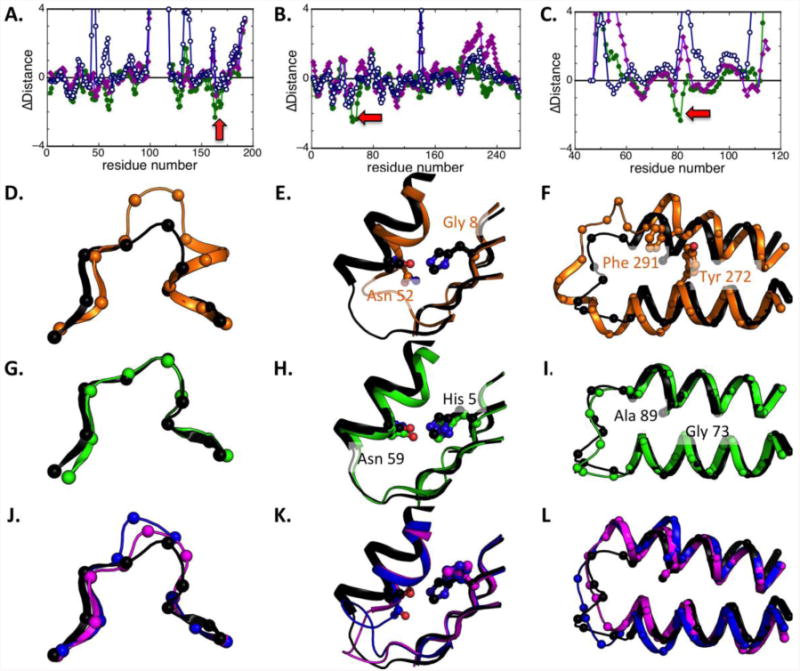
Examples of improvements over starting templates in CASP10. Top row, difference between per-residue deviations of best template to native structure and deviations of server model to native structure for T0667 (left), and T0702 (middle) and T0685 (right). Values less than zero indicate regions in which the submitted model is closer to the true structure than the best template. Results are shown for first submitted models: green, RosettaCM; blue, HHpredA; magenta, Zhang-server. The structural comparisons in rows 2-4 are over the region with the largest improvements over the templates indicated by red arrow in the first row. (D-L). The native structures are in black; the best template is in orange (D-F); and models from RosettaServer are in green (G-I). HHpredA and ZhangServer models are in blue and magenta for comparison (J-L). Orange labels indicate aligned template residue identities; black labels, the target residue identities.
Accurate loop remodeling
In target T0667, there is a deletion in the residue 161-163 loop in the closest template (2WTM). There is another template with a loop of the same length (1ISP), but the conformation is quite different (2Å over the three loop residues; Fig 4D). The RosettaCM model is much closer to the native structure (0.9Å over the loop region; Fig 4G) compared to the other server models (Fig 4J). The improvement in loop modeling lowers the RMSD for the residues indicated by the arrow in Fig 4A. The improvement in model accuracy comes from combining fragments from the lower ranked template, and energy minimization after the fragment is superimposed.
Concerted backbone repositioning
In T0702 a nonconservative glycine to histidine substitution at position 5 results in a new sidechain-sidechain hydrogen bond with Asn 59, which is associated with a helix shift and loop structure change relative to the closest template, 2RCY(Fig 4E). The RosettaCM model recapitulates this hydrogen bond, and the associated helix shift and loop changes (Fig 4H). The other server models do not reproduce the new hydrogen bond or the backbone structural changes (Fig 4K). These changes together improve the RMSD in the region indicated by the arrow in Fig 4B. Similarly in T0685, the inter-helix interaction between a Phe and Tyr in the top template used by all three servers, 2C2A, is changed to Ala and Gly in the target, which causes two helices to collapse towards each other (Fig 4F). RosettaCM is able to model this change as well as the loop connecting the helix accurately (Fig 4I). In comparison, other methods either stayed close to the template structure or modeled the helix shift but not the conformational changes in the loop region (Fig 4L).
RosettaCM is freely available to academic users as part of the Rosetta software suite. As detailed in Supplemental Information, the user provides – in addition to the protein sequence – a set of template structures and sequence alignments to these structures. Available experimental data – electron density maps, NMR data (chemical shifts, RDCs, and NOEs), and X-ray diffraction data – can be input into RosettaCM to supplement homologous structure information. RosettaCM is also available through the ROBETTA server, which uses HHsearch(Remmert et al., 2012), SPARKS-X(Zhou and Zhou, 2004), and RaptorX(Peng and Xu, 2009) to generate the input alignments. It is clear that improved results can be obtained using more sensitive remote homolog detection and sequence alignment methods, and methods developers working in these areas should be able to use RosettaCM to build improved models. In particular, the superb remote homolog detection by the Zhang group based on structural similarity with de novo models should greatly improve modeling of proteins based on very distantly related targets.
The runtime of RosettaCM is determined by the number of independent trajectories carried out. A single modeling trajectory for a 200 residue protein takes about ten minutes, and – for sequences with greater than 25% sequence identity to a protein of known structure – only 5-10 trajectories are necessary for accurate modelling (see Supplementary Information). Hence, RosettaCM could be used in conjunction with servers such as HHsearch, which produce accurate alignments using robust statistics with very little wait time.
Experimental Procedures
RosettaCM Protocol
The workflow in the RosettaCM modeling protocol is outlined in Figure 1. The inputs to RosettaCM are alignments of the sequence of the protein of interest to proteins of known structures, and standard Rosetta de novo modeling fragment sets to model the unaligned regions and to explore deviations from the templates in the aligned regions. The alignments to proteins of known structure can be generated using remote homologue detection programs such as PsiBlast(Altschul et al., 1990), HHsearch(Remmert et al., 2012), SPARKS-X(Zhou and Zhou, 2004) and RaptorX(Peng and Xu, 2009), or using expert knowledge of the protein family and any available experimental information. The user can provide an optional weights file specifying the weight to be given to each alignment during modeling; if no weights file is provided the input alignment file should be ordered such that the most confident alignments are first (RosettaCM assumes in the absence of a provided weights file the decrease in alignment accuracy from the top ranked model to the nth ranked model observed for HHsearch alignments for a large set of proteins). Rosetta de novo fragment files can be generated using the Rosetta program or ROBETTA server as described elsewhere.
RosettaCM builds models from these inputs as described in the following paragraphs. The RosettaCM script provided in the Supplementary Information carries out all of the steps.
Probabilistic distance restraints are generated from the weighted input alignments as described previously.(Thompson and Baker, 2011) For short gaps, the contribution of alignments lacking a particular pair of residues to these distance constraints is the background distance distribution (see ref(Thompson and Baker, 2011)). If there is a gap longer than 50 residues in one template, then the contribution of this template to the gapped residues is excluded and the contribution of the rest of the templates are renormalized to avoid blurring out the restraints in domains that are only represented in a subset of the alignments. Models are then assembled and optimized in three stages. In the first stage, complete chain models are built up by recombining fragments from the aligned template structures, and de novo fragments representing the unaligned regions. In the second stage, deviations from the templates are explored and gaps in the models are closed using a combination of fragment superposition and Cartesian space minimization. In the third stage, sidechain and backbone conformations are optimized using Rosetta full-atom refinement.
Stage 1
Global superposition
A stochastic procedure is used to select a template, which is then used to generate a global superposition of the aligned portions of the templates. Since the global alignment most consistent with the actual structure is unknown in advance, this is done independently for each model generated to sample different possible global superpositions. First, for each alignment, the sequence of interest is threaded onto the corresponding template structures to generate a set of partial threads. One of the partial threads is randomly selected as the base model for the superposition with probability given by the user specified or default weight assigned to the alignment as described above. For each of the remaining partial threads, the coordinates are transformed to minimize the RMSD with the base thread over the residues they have in common. Partial threads with no residues in common with the base model are eliminated. If a partial thread is parsed into multiple domains (using DDOMAIN(Zhou et al., 2007)), each domain is superimposed independently, resulting in global orientation between domains similar to that in the base model, while structural variation within domains between partial threads is modelled.
Template fragment generation
To allow recombination of structural elements present in the global superposition, each partial thread is broken up into segments corresponding to secondary structure elements. Secondary structure is first assigned using DSSP(Kabsch and Sander, 1983), and continuous helices of at least 6 residues or strands of at least 3 residues are added to a fragment list. The interconnecting loops are split, and joined to the connected helix or strand segment. Secondary structure segments separated by less than 3 loop residues are grouped into the same segment so kinked helices and tight beta hairpins are treated as a single rigid segment.
Fragment recombination
Full chain models are generated by recombining the template-derived segments with Rosetta de novo fragments that cover the regions not represented in the templates. Unaligned regions are split in half, and each half is associated with the adjacent base. Structures are generated from the template and Rosetta de novo fragments according to a Rosetta “fold tree”: the global position of each segment is represented in Cartesian space, while the backbone and sidechain conformation of each segment is represented in torsion space. A Monte Carlo trajectory is carried out with two types of moves: (1) substitution of the backbone torsion angles of a randomly selected Rosetta de novo fragment for the current torsion angles of these residues, and regeneration of coordinates according to the fold tree (Fig 1B). The segmentation of the protein limits propagation of torsion angle changes to the closest end of the segment. (2) substitution of the coordinates of a randomly selected partial thread derived fragment (in the global frame) for the current model coordinates of these residues (Fig 1C).
The scoring function used in the Monte Carlo trajectory is a linear combination of the Rosetta low-resolution (centroid) energy function, which favors compact structures with buried hydrophobic residues and paired beta strands, the template derived restraint functions described above, and a chain break term which penalizes large distances between residues adjacent in the sequence which can arise at fold tree boundaries (the middle of unaligned regions). As in the Rosetta de novo structure prediction protocol(Rohl et al., 2004), these terms are gradually phased in. At the beginning of the trajectory, only excluded volume interactions are considered, then secondary structure pairing and hydrophobic burial, and then the remaining terms. The chain break term between residues in separate branches of the fold tree but adjacent in the linear sequence is (|r-r0|, where r is the distance between the bonded atoms and r0 is the idealized bond length between the atoms). This term is set to zero at the first half of the Monte Carlo trajectory, and linearly ramped up to the full term in the second half. This allows large structural changes to be sampled while still favoring separations small enough so that the gaps are closable in the second phase.
The total number of steps in these first stage Monte Carlo trajectories was set to 10,000, with 5,000 attempts on inserting template fragments and 5,000 for de novo fragment insertions. Both the total numbers of Monte Carlo steps and the ratio between two types of fragment insertions are adjustable. This first stage takes about 1 minute for a 150-residue protein. The lowest energy structure sampled during the trajectory is passed on to the second stage.
Stage 2
The models generated in stage 1 contain all residues and generally have the correct overall topology, but are suboptimal in two ways: first, the aligned regions are often very close to one of the input template structures, and second, the backbone geometry at the junctions between fold tree branches is often quite distorted. To sample further from the input template structures, and to close the loops, a Monte Carlo trajectory using a two-step move is carried out. The first step consists of random selection of a de novo or template based fragment, and substitution into the current conformation of the coordinates of the superimposed fragment. In the de novo fragment case, the N and C terminal residues of the fragment are superimposed on the corresponding residues of the current conformation (Fig 1D), and the fragment insertions are biased towards regions in which the backbone is most distorted as assessed by the local bond length and bond angle energies. In the template fragment case, the superposition is over all residues in the fragment, not just the termini. Following the fragment insertion, Cartesian-space quasi Newton (BFGS) minimization is carried out using a differentiable version of the Rosetta centroid energy function described in the next paragraph, the template derived restraints, and explicit bond length, bond angle and improper torsion energy terms in place of the relatively weak chain break term used in stage 1 (Fig 1D).
The differentiable centroid energy function makes use of smooth re-parameterizations of the centroid pair and environment terms, which enforce pair distributions and nonpolar burial respectively, and the Cβ and cenpack terms, which enforce native-like core packing(Rohl et al., 2004). The smooth re-parameterizations fit mixtures of Gaussians to empirically derived distributions; the relatively small number of Gaussians needed to fit these distributions (generally 2-4 for each pair distance distribution) offers a significant reduction in parameters versus the previous table-based parameterization. Neighbor counts are sigmoid-smoothed. The resulting continuously differentiable energy function allows minimization with centroid energies, which allows optimization of backbone hydrogen bond and covalent bonded geometry, without requiring the expensive rotamer optimization calculations needed to accurately compute all-atom energies.
As described previously, each move in the second stage Monte Carlo trajectories involves fragment insertion by superposition followed by full backbone minimization. The total number of attempted moves is 1,500, with 1,000 template fragment insertions and 500 de novo fragment insertions. This second stage takes 5 minutes for a 150-residue protein. The lowest energy structure sampled during the trajectory is passed on to the final full atom refinement phase.
Stage 3
The low energy structures resulting from the stage 2 trajectories have near ideal backbone geometry but sidechains are not explicitly represented. In stage 3, the Rosetta Monte Carlo combinatorial sidechain optimization method is used to build on sidechains, and the recently developed Rosetta “FastRelax” protocol is used to iteratively refine the sidechain and backbone conformations.(Tyka et al., 2011) Annealing is carried out by ramping up and down the strength of the repulsive interactions and at each iteration repacking the sidechains and subjecting the whole structure to quasi-Newton optimization of the sidechain and backbone coordinates first in internal coordinates and then in Cartesian coordinates. The Rosetta full atom energy function supplemented with the alignment derived restraint function is used in all calculations with the weight on the repulsive interactions varied as described above.
Model selection
Final models (which may be generated from different seed alignments) are collected, and best 10% of models by energy are identified. These structures are then clustered, and the center of the largest cluster (where each model is weighted such that low-energy models have highest weight(Xiang et al., 2002)) is selected as the top model. In cases such as CASP where multiple models are desirable, additional models are identified by repeating the clustering process after the 10% of the models closest to the selected model is removed.
Supplementary Material
Highlights.
RosettaCM generates more accurate models for close homology modeling in CASP 10
RosettaCM consistently improves model accuracy in the aligned region
Conformational sampling in a combined Cartesian- and torsion-space
New loop closure method combining fragment superposition and structure minimization
Acknowledgments
We thank Andriy Kryshtafovych for providing CASP10 analysis and helpful discussions. Research reported in this publication was supported by NIGMS of the National Institutes of Health under award number R01GM092802-02.
Footnotes
Publisher's Disclaimer: This is a PDF file of an unedited manuscript that has been accepted for publication. As a service to our customers we are providing this early version of the manuscript. The manuscript will undergo copyediting, typesetting, and review of the resulting proof before it is published in its final citable form. Please note that during the production process errors may be discovered which could affect the content, and all legal disclaimers that apply to the journal pertain.
References
- Altschul SF, Gish W, Miller W, Myers EW, Lipman DJ. Basic local alignment search tool. J Mol Biol. 1990;215:403–410. doi: 10.1016/S0022-2836(05)80360-2. [DOI] [PubMed] [Google Scholar]
- Altschul SF, Madden TL, Schaffer AA, Zhang J, Zhang Z, Miller W, Lipman DJ. Gapped BLAST and PSI-BLAST: a new generation of protein database search programs. Nucleic Acids Res. 1997;25:3389–3402. doi: 10.1093/nar/25.17.3389. [DOI] [PMC free article] [PubMed] [Google Scholar]
- Das R, Baker D. Macromolecular modeling with rosetta. Annu Rev Biochem. 2008;77:363–382. doi: 10.1146/annurev.biochem.77.062906.171838. [DOI] [PubMed] [Google Scholar]
- Davis IW, Leaver-Fay A, Chen VB, Block JN, Kapral GJ, Wang X, Murray LW, Arendall WB, 3rd, Snoeyink J, Richardson JS, et al. MolProbity: all-atom contacts and structure validation for proteins and nucleic acids. Nucleic Acids Res. 2007;35:W375–383. doi: 10.1093/nar/gkm216. [DOI] [PMC free article] [PubMed] [Google Scholar]
- Eswar N, Webb B, Marti-Renom MA, Madhusudhan MS, Eramian D, Shen MY, Pieper U, Sali A. Comparative protein structure modeling using Modeller. Curr Protoc Bioinformatics. 2006;Chapter 5:6. doi: 10.1002/0471250953.bi0506s15. Unit 5. [DOI] [PMC free article] [PubMed] [Google Scholar]
- Fleishman SJ, Whitehead TA, Ekiert DC, Dreyfus C, Corn JE, Strauch EM, Wilson IA, Baker D. Computational design of proteins targeting the conserved stem region of influenza hemagglutinin. Science. 2011;332:816–821. doi: 10.1126/science.1202617. [DOI] [PMC free article] [PubMed] [Google Scholar]
- Kabsch W, Sander C. Dictionary of protein secondary structure: pattern recognition of hydrogen-bonded and geometrical features. Biopolymers. 1983;22:2577–2637. doi: 10.1002/bip.360221211. [DOI] [PubMed] [Google Scholar]
- Keedy DA, Williams CJ, Headd JJ, Arendall WB, 3rd, Chen VB, Kapral GJ, Gillespie RA, Block JN, Zemla A, Richardson DC, et al. The other 90% of the protein: assessment beyond the Calphas for CASP8 template-based and high-accuracy models. Proteins. 2009;77(9):29–49. doi: 10.1002/prot.22551. [DOI] [PMC free article] [PubMed] [Google Scholar]
- King NP, Sheffler W, Sawaya MR, Vollmar BS, Sumida JP, Andre I, Gonen T, Yeates TO, Baker D. Computational design of self-assembling protein nanomaterials with atomic level accuracy. Science. 2012;336:1171–1174. doi: 10.1126/science.1219364. [DOI] [PMC free article] [PubMed] [Google Scholar]
- Peng J, Xu J. Boosting Protein Threading Accuracy. Res Comput Mol Biol. 2009;5541:31–45. doi: 10.1007/978-3-642-02008-7_3. [DOI] [PMC free article] [PubMed] [Google Scholar]
- Pieper U, Webb BM, Barkan DT, Schneidman-Duhovny D, Schlessinger A, Braberg H, Yang Z, Meng EC, Pettersen EF, Huang CC, et al. ModBase, a database of annotated comparative protein structure models, and associated resources. Nucleic Acids Res. 2011;39:D465–474. doi: 10.1093/nar/gkq1091. [DOI] [PMC free article] [PubMed] [Google Scholar]
- Raman S, Lange OF, Rossi P, Tyka M, Wang X, Aramini J, Liu G, Ramelot TA, Eletsky A, Szyperski T, et al. NMR structure determination for larger proteins using backbone-only data. Science. 2010;327:1014–1018. doi: 10.1126/science.1183649. [DOI] [PMC free article] [PubMed] [Google Scholar]
- Raman S, Vernon R, Thompson J, Tyka M, Sadreyev R, Pei J, Kim D, Kellogg E, DiMaio F, Lange O, et al. Structure prediction for CASP8 with all-atom refinement using Rosetta. Proteins. 2009;77(9):89–99. doi: 10.1002/prot.22540. [DOI] [PMC free article] [PubMed] [Google Scholar]
- Remmert M, Biegert A, Hauser A, Soding J. HHblits: lightning-fast iterative protein sequence searching by HMM-HMM alignment. Nat Methods. 2012;9:173–175. doi: 10.1038/nmeth.1818. [DOI] [PubMed] [Google Scholar]
- Rohl CA, Strauss CE, Misura KM, Baker D. Protein structure prediction using Rosetta. Methods Enzymol. 2004;383:66–93. doi: 10.1016/S0076-6879(04)83004-0. [DOI] [PubMed] [Google Scholar]
- Sali A, Blundell TL. Comparative protein modelling by satisfaction of spatial restraints. J Mol Biol. 1993;234:779–815. doi: 10.1006/jmbi.1993.1626. [DOI] [PubMed] [Google Scholar]
- Soding J, Biegert A, Lupas AN. The HHpred interactive server for protein homology detection and structure prediction. Nucleic Acids Res. 2005;33:W244–248. doi: 10.1093/nar/gki408. [DOI] [PMC free article] [PubMed] [Google Scholar]
- Thompson J, Baker D. Incorporation of evolutionary information into Rosetta comparative modeling. Proteins. 2011;79:2380–2388. doi: 10.1002/prot.23046. [DOI] [PMC free article] [PubMed] [Google Scholar]
- Tramontano A, Leplae R, Morea V. Analysis and assessment of comparative modeling predictions in CASP4. Proteins. 2001;(5):22–38. doi: 10.1002/prot.10015. [DOI] [PubMed] [Google Scholar]
- Tyka MD, Keedy DA, Andre I, Dimaio F, Song Y, Richardson DC, Richardson JS, Baker D. Alternate states of proteins revealed by detailed energy landscape mapping. J Mol Biol. 2011;405:607–618. doi: 10.1016/j.jmb.2010.11.008. [DOI] [PMC free article] [PubMed] [Google Scholar]
- Xiang Z, Soto CS, Honig B. Evaluating conformational free energies: the colony energy and its application to the problem of loop prediction. Proc Natl Acad Sci U S A. 2002;99:7432–7437. doi: 10.1073/pnas.102179699. [DOI] [PMC free article] [PubMed] [Google Scholar]
- Xu D, Zhang J, Roy A, Zhang Y. Automated protein structure modeling in CASP9 by I-TASSER pipeline combined with QUARK-based ab initio folding and FG-MD-based structure refinement. Proteins. 2011;79(10):147–160. doi: 10.1002/prot.23111. [DOI] [PMC free article] [PubMed] [Google Scholar]
- Zemla A. LGA: A method for finding 3D similarities in protein structures. Nucleic Acids Res. 2003;31:3370–3374. doi: 10.1093/nar/gkg571. [DOI] [PMC free article] [PubMed] [Google Scholar]
- Zemla A, Venclovas C, Moult J, Fidelis K. Processing and analysis of CASP3 protein structure predictions. Proteins. 1999;(3):22–29. doi: 10.1002/(sici)1097-0134(1999)37:3+<22::aid-prot5>3.3.co;2-n. [DOI] [PubMed] [Google Scholar]
- Zhou H, Xue B, Zhou Y. DDOMAIN: Dividing structures into domains using a normalized domain-domain interaction profile. Protein Sci. 2007;16:947–955. doi: 10.1110/ps.062597307. [DOI] [PMC free article] [PubMed] [Google Scholar]
- Zhou H, Zhou Y. Single-body residue-level knowledge-based energy score combined with sequence-profile and secondary structure information for fold recognition. Proteins. 2004;55:1005–1013. doi: 10.1002/prot.20007. [DOI] [PubMed] [Google Scholar]
Associated Data
This section collects any data citations, data availability statements, or supplementary materials included in this article.