

Abstract
The temporal community dynamics and persistence of different viral types in the marine environment are still mostly obscure. Polymorphism of the major capsid protein gene, g23, was used to investigate the community composition dynamics of T4-like myoviruses in a North Atlantic fjord for a period of 2 years. A total of 160 unique operational taxonomic units (OTUs) were identified by terminal restriction fragment length polymorphism (TRFLP) of the gene g23. Three major community profiles were identified (winter-spring, summer, and autumn), which resulted in a clear seasonal succession pattern. These seasonal transitions were recurrent over the 2 years and significantly correlated with progression of seawater temperature, Synechococcus abundance, and turbidity. The appearance of the autumn viral communities was concomitant with the occurrence of prominent Synechococcus blooms. As a whole, we found a highly dynamic T4-like viral community with strong seasonality and recurrence patterns. These communities were unexpectedly dominated by a group of persistently abundant viruses.
INTRODUCTION
With total viral numbers of around 10 million particles per milliliter being commonly found in surface water samples from around the world, it is now acknowledged that viruses are the most abundant biological entities in the oceans (reviewed in reference 1). Their role as major marine players also became recognized (although still poorly understood) with the appearance of an increasing number of studies reporting significant rates of virus-mediated cellular lysis (2), virus control of cellular abundance and community composition (3), and impact on global biogeochemical cycles through major reshuffling of organic matter in the oceans (4–6). Despite these outstanding advances, our knowledge of the true dimensions of the identities and the role of marine viruses remains far from complete, notably in regard to temporal community dynamics and the persistence of unique viruses in the marine environment.
Different approaches have been used to study marine viral community dynamics, and they contribute to our current understanding that viral abundances can show marked differences between seasons (7–9). Fingerprinting techniques have been employed to try to discriminate the dynamics of the members of the dominant virioplankton communities. For example, spatial and temporal variability of viral communities has been observed by pulsed-field gel electrophoresis of full viral genomes (10) or through analysis of selected genes (e.g., those encoding capsid proteins and DNA polymerases) using sequencing (11, 12) and denaturing gradient gel electrophoresis (13, 14). Metagenomic approaches have also added to our understanding of virioplankton dynamics with analyses that suggest that marine virus communities are composed of only a few abundant populations and many less abundant populations (15–17). Indeed, this observation led to the creation of the bank concept, according to which only a small fragment of the total viral community is actively involved in lytic events at any one time while the vast majority, the “bank,” is inactively waiting for the right opportunity (an increase in potential host numbers) to start the replication process (18).
Many of the existing studies on marine viral dynamics have an intra-annual duration (19) and hence cannot address the potential yearly recurrence of the observed patterns. Because viral and bacterial communities are extremely dynamic, it is important to extend these temporal windows in our attempts to adequately describe the viral ecology of marine systems. More recently, though, a few studies have reported consistently recurring virioplankton interannual dynamics. Parsons et al. (20) demonstrated seasonally recurring patterns in viral abundance that corresponded to changes in water column stability and the distribution of specific bacterioplankton lineages from a multiyear time series in the Sargasso Sea. High levels of seasonality and annual recurrence were also reported in three studies that used molecular tools to discriminate between viral operational taxonomic units (OTUs) (21–23).
Ultimately, the analysis of empirical virioplankton dynamics data will highlight emerging ecological patterns capable of being modeled. “Killing the winner” (KtW) is such a model, which tries to predict the properties of planktonic microbial and viral communities (24, 25). It acknowledges viruses as a balancing factor by which host species with different growth rates can coexist in steady state (24, 26). Basically, a virus specifically targeting fast-growing hosts would be essential in controlling the host's numbers and hence providing niches for the development of slower-growing cells. According to KtW, this specific type of relationship would be the sine qua non condition that allows the maintenance of highly dynamic and diverse microbial communities (24). The model can also predict the counterintuitive idea that more abundant viruses are associated with rare hosts, and vice versa (27, 28).
Here, we employed a recently developed g23 major capsid protein terminal restriction fragment length polymorphism (g23 TRFLP) assay (21) to assess marine T4-like myoviral dynamics over 2 years. T4-like myoviruses are double-stranded DNA contractile-tailed phages (order Caudovirales) (29, 30). Several metagenomic surveys have demonstrated that T4-like myoviruses represent a significant fraction of the viral community in marine systems (15, 16, 31–35). The present study took place in the Raunefjord, a North Atlantic fjord well recognized for having recurrent microbial succession patterns (36, 37). To our knowledge, this is the first study to address interannual fine-scale viral dynamics in this environment. Our findings are discussed in light of the theoretical predictions currently existing.
MATERIALS AND METHODS
Sampling program, physical measurements, and flow cytometry.
Sampling was carried out approximately every 4 to 5 weeks in the Raunefjord (60°16′N, 5°12′E), Norway, from 26 May 2009 to 31 May 2011 (although no samples were taken in July), for a total of 28 samples. Each time, 40 liters of seawater was collected routinely from 5-m depth between 8:00 a.m. and 10:00 a.m. and processed the same day. Abiotic measurements were conducted with an STD SAIV a/s SD 204 (Environmental Sensors and Systems). Samples for bacterial counts were fixed with 1% glutaraldehyde for 30 min at 4°C and frozen at −80°C. Each sample was then diluted 10- to 500-fold before staining with SybrGreen I and run on a FACSCalibur flow cytometer (Becton, Dickinson), equipped with an air-cooled laser providing 15 mW at 488 nm and with a standard filter setup, for 60 s at an event rate of between 100 and 1,000 s−1. Fresh samples were used for cyanobacterial counts, with settings optimized on red and orange fluorescence. Samples were counted for 5 min, with event rates between 80 and 800 s−1. Synechococcus sp. counts were gated according to previous studies (38).
Virus concentration and DNA extraction.
Twenty-four liters of seawater was prefiltered through a 142-mm-diameter, 1.2-μm-pore-size low-protein-binding Durapore membrane filter (Millipore Corp., Billerica, MA, USA). The virus-containing filtrates were further concentrated to a final volume of approximately 50 ml by tangential-flow filtration using a QuixStand benchtop system equipped with a 100,000-molecular-weight-cutoff (MWCO) hollow-fiber cartridge (GE Healthcare Bio-Sciences AB, Uppsala, Sweden). Viral concentrates were stored at −80°C. To extract viral DNA, 500 μl of viral concentrate was incubated twice at 90°C for 2 min (resting on ice for 1 min between incubations). Then, 20 μl of 0.5 M EDTA and 5 μl of proteinase K (10 mg/ml) were added to the viral concentrates and incubated for 10 min at 55°C before adding 25 μl of 10% SDS and incubating further for 1 h at 55°C. Viral DNA was purified using the Zymo Clean and Concentrator −5 (according to the manufacturer's recommendations) and eluted in 20 μl sterile water. DNA extracts were quantified using QuantIt PicoGreen (Invitrogen) with the quantitative-plate-read mode on a Stratagene MX3000P real-time PCR machine, according to the manufacturer's instructions.
T4-like virus community profiling by the g23 major capsid protein gene.
T4-like virus communities were assayed by TRFLP of the major capsid protein gene, as described by Chow and Fuhrman (21). Briefly, the g23 PCR primers used here were T4superF1, 5′-GAY HTI KSI GGI GTI CAR CCI ATG-3′, and T4superR1, 5′-GC IYK IAR RTC YTG IGC IAR YTC-3′. Each PCR mixture (final volume, 50 μl) contained 2 ng DNA, 1× ThermoPol buffer (including 20 mM MgSO4; NEB), an additional 1.75 mM MgCl2 (final concentration, 3.75 mM), 0.25 mM each deoxynucleoside triphosphate (dNTP), 400 nM each primer, 10 μg bovine serum albumin (BSA) (Sigma; number 7030), and 5 units Taq DNA polymerase (NEB). The cycling parameters were 95°C for 5 min and 35 cycles of 95°C for 30 s, 54°C for 30 s, and 72°C for 30 s, with a final extension at 72°C for 9.5 min. Duplicate PCRs were completed for each sampling time point; 5 μl of each PCR was electrophoresed in 1.2% agarose (FlashGel DNA cassette; Lonza) according to the manufacturer's instructions to verify amplification. The resulting amplicons ranged from 400 to 500 bp (21).
Restriction digestion and fragment electrophoresis.
Duplicate PCR mixtures for each time point were pooled (total, approximately 100 μl) into digestion reaction mixtures containing 1× buffer, 10 units of HincII, and 1× BSA (NEB) and digested for 8 h at 37°C, followed by heat inactivation at 65°C for 20 min. Restriction digests were concentrated with Zymo Clean and Concentrator −5, with a final elution volume of 8 μl. The concentrated samples were quantified with PicoGreen and diluted to 20 ng μl−1 before fragment analysis. Restriction fragments were detected by automated acrylamide slab gel electrophoresis in duplicate on nonadjacent lanes (20 ng per lane) on an ABI 377 with a custom internal size standard (Bioventures); standards were included every 25 bp (50 to 900 bp) and every 50 bp (900 to 1,400 bp). Peak data were analyzed using DAx (van Mierlo, The Netherlands) as described previously (21). Fragment lengths were rounded to the nearest 0.1 bp, and those fragments <75 bp long (too small to accurately size) or with <25 relative fluorescence units (too small to accurately measure) were removed before dynamic binning (39), with a maximum bin size of 1 bp. We analyzed all fragments between 75 and 500 bp, including uncut fragments (>350 bp). Fragments of ∼285 to 350 bp may include both cut and uncut fragments by previous in silico analysis (further protocol details can be found in reference 21). Each distinct binned fragment length was considered a unique OTU. OTU contributions (or relative abundances) were determined by dividing the individual peak area of each OTU by the total peak area in each fingerprint to provide a normalized peak area (i.e., percentage of the community) for OTU comparison between samples.
Statistical analysis.
Statistical analyses were performed independently for the forward and reverse g23 TRFLP fragments using standardized and dynamically binned peak data, so that each TRFLP fingerprint represented 100% of the amplifiable T4-like myoviral community. The progression of temperature, individual OTU abundance, and Synechococcus concentration over time, as well as OTU frequencies versus relative abundances, were plotted with Sigmaplot 11 (Systat Software, Inc.). All other analyses were performed using PRIMER v6 (Primer-E Ltd.).
A Bray-Curtis sample resemblance matrix was first created. This resemblance algorithm has been previously demonstrated to be the most adequate for biological community data (40). The resemblance matrix was used to evaluate community structure via two independent approaches: (i) hierarchical clustering and (ii) ordination through principal-coordinates analysis (PCoA). The significance of the clusters resulting from the latter was tested with a similarity profile (SIMPROF) permutation test. The robustness of the clustering pattern was further evaluated with analyses of group variance (ANOSIM) at three levels (month, season, and year). Discriminant OTU analysis was performed to identify the OTUs that contributed most to the observed clustering pattern (using the SIMPER function). The BEST permutation method was used to identify which environmental variables (water temperature, salinity, turbidity, chlorophyll a fluorescence, bacterial abundance, and Synechococcus abundance) best explained the observed community variation and tested for significance of linkage between TRFLP and environmental data.
RESULTS
Environmental parameters.
During the 2-year monthly sampling (roughly), seawater temperature (at 5-m depth) followed the expected pattern, with seasonal lows in February and March and highs in August. An absolute temperature minimum (3.5°C) was registered on 22 February 2011 and an absolute maximum (16.4°C) on 10 August 2010. Salinity remained fairly stable throughout, with values ranging from 29.7 to 33.9‰. Total bacterial counts oscillated irregularly, with values ranging between 3.4 × 10⁵ (2 February 2010) and 3.9 × 10⁶ (26 May 2009). Synechococcus presented a consistent pattern of autumn blooms, reaching a maximum value of 1.0 × 10⁵ cells ml−1 (5 October 2010), followed by low concentrations (<6 × 10³ cells ml−1) during the rest of the year (all physicochemical and flow cytometric data are presented in detail in Table S1 in the supplemental material).
Global community composition by g23 sequence discrimination.
A total of 160 unique OTUs were observed for the forward (5′) terminal fragments, with an average 41.8 ± 8.7 OTUs per sample (Table 1; see Fig. S1 in the supplemental material). The rank-abundance plot of the average contribution per OTU presented a clear inverted exponential curve (Fig. 1). The average contribution of any OTU to the total community was 2.4% ± 0.54%, but much higher maxima were reached by some OTUs (the maximum individual OTU contribution was 27.8%). Analysis of the reverse (3′) terminal fragments showed 126 unique OTUs and displayed identical seasonality and abundance patterns (analysis not shown; detailed normalized OTU data can be found in Table S2 in the supplemental material).
Table 1.
g23 TRFLP OTU statisticsa
| Parameter | Value |
|||
|---|---|---|---|---|
| Total | Per seasonal cluster |
|||
| Winter-spring | Summer | Autumn | ||
| OTU richness per month (±SD) | 41.8 ± 8.7 | 41.5 ± 7.8 | 38.6 ± 6.2 | 45.0 ± 12.8 |
| Avg relative abundance (%) (±SD) | 2.4 ± 0.54 | 2.5 ± 0.6 | 2.6 ± 0.6 | 2.3 ± 0.5 |
| Median relative abundance (%) | 2.4 | 2.3 | 2.8 | 2.5 |
| Maximum relative abundance (%) | 27.8 | 23.2 | 27.8 | 15.0 |
| No. of unique OTUs | 160 | 137 | 69 | 91 |
Discriminating between the three seasonal clusters identified in Fig. 3.
Fig 1.
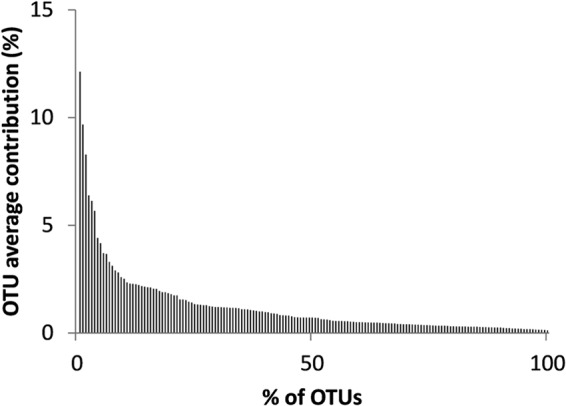
Rank-abundance plot for the different OTUs observed.
There was a clear inverse relationship between the number of OTUs and their respective incidences (number of occurrences); the majority of the OTUs appeared only a few times, while some OTUs occurred many times (Fig. 2b). Moreover, we observed a positive relationship between the incidence and the average or maximum observed contribution of an OTU to the whole community (Fig. 2). The most frequently observed OTUs showed a clear tendency to be major components of the community, maintaining high averages (up to 12%) and reaching higher maxima (up to 28%). OTUs that occurred infrequently were consistently positioned in the lower left corner of the plot, with minor contributions to the total T4-like myoviral community.
Fig 2.
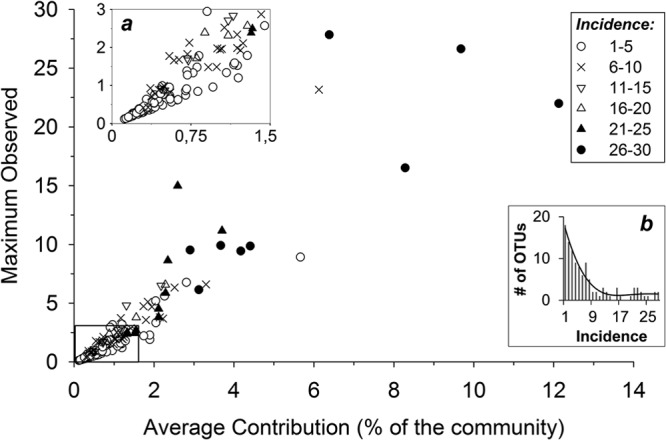
Viral OTUs detected more frequently had higher average and maximum contributions to the T4-like community. Each symbol represents an individual OTU and indicates the OTU's incidence (the number of samples in which it was detected). The x axis shows the average proportion of an OTU, expressed as a percentage of the total amplified products. The y axis shows the maximum observed proportion of the OTU and is also expressed as a percentage of the total amplified myoviral community. (a) Enlarged view of the boxed area on the bottom left. (b) Frequency rank plot for the different OTUs observed.
Community OTU dynamics.
Monthly community profiles assembled into three major groups by hierarchical clustering (based on a Bray-Curtis resemblance matrix of OTU composition), which was statistically significant (P < 0.002) by the SIMPROF permutation test (Fig. 3a). Superimposition of these clusters on the PCoA plot showed clear agreement between the two independent techniques: the clusters were sharply defined and would have been determined in much the same way if one were to select clusters by eye from the 2-dimensional ordination alone (Fig. 3b). Analyses of similarity (by ANOSIM, which tests for significant differences between a priori groups) confirmed that the observed similarities between samples are best explained by “seasons” (R = 0.954; P < 0.001). “Months” was still a good indicator, although with lower statistical value (R = 0.439; P < 0.001), and “year” was clearly not a good indicator of sample grouping (R = −0.017; P = 0.52). Overall, myoviral community composition was highly seasonal, driven by the reoccurrence of OTUs at the same time of year. For example, the community composition in September the 1st year was much more similar to that of September the 2nd year than to that of June the 1st year (Fig. 3). For simplification, the seasonal clusters were thereafter referred to as winter-spring, summer, and autumn. It should be noted that the timing of the seasonal clusters did not perfectly match the calendar seasons and oscillated slightly from one year to the next. For example, both May 2009 and May 2010 were included in the summer cluster, yet two samples from May 2011 were found inside the winter-spring cluster (Fig. 3).
Fig 3.
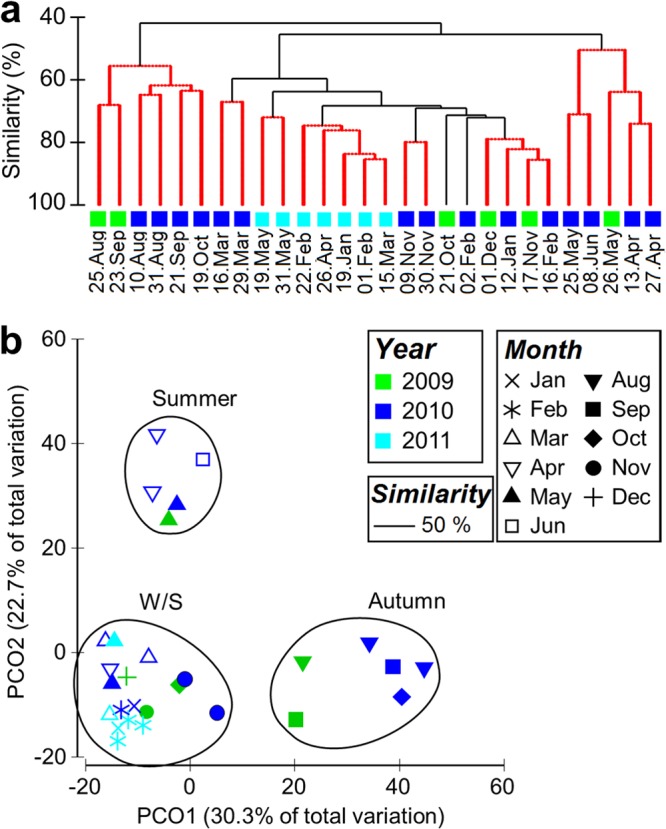
Temporal TRFLP community structure, showing agreement between two independent approaches. (a) Hierarchical clustering based on SIMPROF permutation tests. Samples connected by red lines could not be significantly differentiated. The black lines indicate significant (P < 0.002) differentiation of clusters. (b) Two-dimensional PCoA analysis ordination of the TRFLP samples. The circled samples correspond to the three major hierarchical clusters presented in the dendrogram in panel a (the similarity threshold was set at 50%).
A subset of TRFLP OTUs that tended to be the most persistent or abundant drove the dissimilarity between the three seasonal clusters (the 10 most discriminating OTUS identified by SIMPER are presented in Table S3 in the supplemental material). OTUs with higher contributions progressed in a clear recurrent succession pattern throughout the year (Fig. 4). Winter-spring-type OTUs were more prominent from November to May (e.g., OTU 375.8), when seawater temperatures were lower. Summer-type OTUs, which became more prominent around May-June (e.g., OTU 372), were accompanied by a steady increase in seawater temperature. Autumn-type OTUs increased in relative abundance around late August-September (e.g., OTU 348.5), a period when the sea temperature reached its annual maximum and started to decline. Autumn-type myovirus communities were concomitant with significant Synechococcus cyanobacterial blooms (Fig. 4). OTU richness did not vary significantly from season to season (Table 1), but the autumn communities did present a significantly more even community than the winter-spring and summer seasons (P < 0.001 and P < 0.002, respectively) (see Fig. S2 in the supplemental material).
Fig 4.
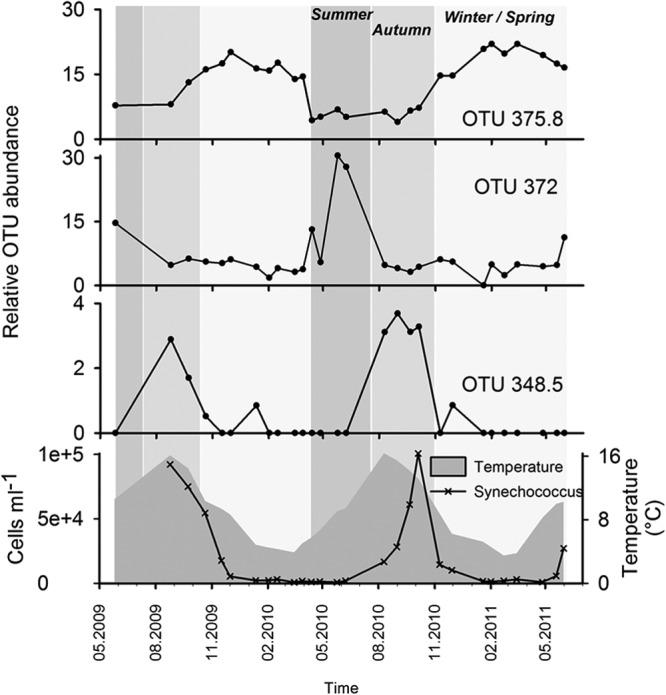
Individual OTU progression exhibiting three distinct seasonal patterns: winter-spring (OTU 375.8), summer (OTU 372), and autumn (OTU 348.5) (top three charts, respectively). The progression of water temperature and Synechococcus cyanobacterial abundance are plotted in the bottom chart. The gray background gradient corresponds to the three seasonal clusters shown in Fig. 3.
Three environmental variables, namely, seawater temperature, turbidity, and Synechococcus abundance, revealed highly significant correlation with changes in the myoviral community structure (BEST analysis; ρ = 0.450; P < 0.1%). Curiously, the last two variables alone have almost as much explanatory power (ρ = 0.446) as they do when combined with temperature. Individually, seawater temperature was the variable that best explained the TRFLP data (ρ = 0.311), followed by Synechococcus abundance (ρ = 0.305). On the other extreme, chlorophyll a fluorescence and total bacterial abundance (ρ = 0.052 and ρ = 0.060, respectively) were the least correlated with the myoviral community structure.
DISCUSSION
The data and analyses presented here refer to the dynamics of a group of T4-like myoviruses at 5 m below the surface at a specific spot in the Raunefjord (Norway) for a period of 2 years. The range of viral types “captured” using the TRFLP method described is directly determined by the specificity of the primers used. The primers targeted a conserved region of the g23 major capsid protein gene and were designed based on an alignment of ∼1,500 unique environmental myovirus sequences (41). Hence, from the total T4-like myoviral diversity present in the Raunefjord, we were able to target and analyze the dynamics of a subsample comprising 160 unique OTUs.
Comparison to a study performed in the Pacific Ocean (SPOT) (21), which used the same methodological approach, reveals interesting features. The maximum individual contributions registered for any single OTU were the same in both environments (28%), but the average relative contribution of individual OTUs was higher in the Raunefjord (2.4%) than at the SPOT site (0.46%). In this fjord environment, we detected 27% fewer unique OTUs than at the SPOT site, where 219 unique OTUs were identified. The average number of OTUs per month was also considerably lower in the fjord (n = 42) than at the SPOT site (n = 121). This indicates that the myoviral communities from Eastern Pacific waters may be more diverse than those from the Raunefjord, with the latter also being an environment where each viral type has a higher contribution to the full community. This result also fits the classic ecological concept, in which more diverse communities tend to have more even distributions of organisms (42). The differences observed between the two sites could be tentatively explained by the different levels of exposure to external water masses and inherent larger banks of viral genetic influx that distinguish the two environments. Such a difference in exposure, however, is not evident, since the Raunefjord is a very dynamic fjord system, uncharacteristically exposed to strong oceanic currents moving up the Norwegian coast (43). On the other hand, these community richness differences may also be potentially conditioned by the relevant latitudinal gap existing between the two sites (27° of latitude) and consequent important disparities in some physicochemical factors, namely, seawater temperature and hours of light. The traditional pattern of increase in biodiversity richness toward the tropics (reviewed in reference 44) has also been previously reported for marine bacterioplankton communities (45, 46).
Seasonal progression and recurrence.
Here, we document for the first time the existence and recurrence of marked seasonal shifts at the viral community level in the Raunefjord. This fjord is known for being a highly dynamic environment with strong seasonal shifts and succession patterns in planktonic communities, particularly well documented in regard to microalgal and cyanobacterial blooms (36, 47). The very tight nature of the virus-host relationship makes it reasonable to accept the possibility that shifts in microbial community composition could be strongly linked to corresponding changes in the cohabiting viral communities. In this study, we observed that the targeted T4-like myovirus communities in the Raunefjord presented three distinct seasonal shifts (summer to autumn to winter-spring) (Fig. 3). The recurrent seasonal patterns observed here strongly suggest that these myoviral communities may not be continuously diverging away from an initial state of genetic diversity but instead progress in seasonal cycles that are repeated year after year. Such seasonal recurrence in myoviral communities has also been reported in two other interannual studies (21, 22) and thus could be emerging as a common pattern in marine systems.
The seasonal cycles reported here were mostly synchronized with progression of seawater temperature, but also with turbidity and Synechococcus abundances. The last is an example of concurrent bacterial community shifts, namely, regarding the summer-autumn transitions (Fig. 4). The high levels of synchronization between myoviral community composition and environmental data confer an important degree of determinism on this complex microbial system.
OTU dynamics.
Abundant existing data support the idea that viruses in the water column experience very high decay rates (48–53). This implies a tight coupling of viral abundance with viral production to sustain it. Therefore, the scenarios discussed here assume that high OTU abundance reflects high virion production, and vice-versa for low OTU abundances.
Two very different types of progression were observed among these T4-like myoviral OTUs. One is the typical “boom and bust” pattern, with the contribution of these OTUs significantly oscillating during the year. This boom and bust pattern is often perceived as the type of pattern regulating unicellular plankton host-virus abundance and composition. A number of studies have highlighted the existence of precisely such a pattern for a wide range of host and virus groups (12, 54–56). The results presented here and by Chow and Fuhrman (21) clearly show that this is not the only pattern emerging from marine viral dynamics, as other OTUs represented a constant percentage of the total community. Discussed below are the possible biological/ecological mechanisms that may explain these different temporal patterns.
According to the bank concept (18), “when an environment changes, different hosts grow and the viruses preying on these hosts move from the ‘bank' into the ‘active' fraction.” Our results showed an environment that changed seasonally, along with clear shifts in viral OTU community composition. A fraction of the viral OTUs followed typical boom and bust dynamics. For example, a prominent group of OTUs consistently appeared in the autumn (Fig. 4) and clearly contributed to a significant shift in the T4-like myovirus community composition. The observed recurrent seasonal “booms” for some viral OTUs were most probably linked with corresponding sharp increases in the concentrations of their respective cellular hosts.
The majority of the OTUs made consistently small contributions to the full community (62% of the OTUs, with average abundances of <1%) (Fig. 1). This is in agreement with metagenomic data from various marine environments (15, 16). The chronically rare OTUs could be explained by continuous yet limited production of virions derived from chronic infections. This hypothesis is unlikely, though, as most of the described marine T4-like myoviruses are typically lytic (30, 57, 58). A more credible possibility is that these rare viral OTUs correspond to lytic viruses that are constantly being produced in low numbers by their respective bacterial host populations. The rarity of these viruses would lower their probability of finding hosts. A prediction of KtW is that this rarity is balanced by relatively high abundances of the respective hosts (see “Killing the winner revisited” below). A third hypothesis could be that the sediments act as a viral reservoir from which small numbers of virions are consistently released (55). In the Raunefjord, although high levels of stratification can occur in the spring/summer months, mixing of the water masses is significant the rest of the year (36) and could well explain the reshuffling of viruses from the sediment to the surface.
At the other extreme of the average abundance spectrum (Fig. 1), we found OTUs that consistently presented high abundances (>4%, on average) independent of seasonality and subsequent viral community shifts. Given the one-sided nature of the lytic host-virus relationship, possible explanations for this pattern are not obvious (59–61). One hypothesis could be that for each of these viral OTUs there is a range of genetically close susceptible host cells (e.g., a broad host strain range). In this scenario, while the hosts would progress in succession cycles conditioned primarily by viral infection, the virus would be able to maintain high concentrations by “jumping” from one host “strain” to the next. Adding credibility to this hypothesis are previous reports of broad host ranges for marine myoviruses, sometimes spanning different species of bacteria (57, 58). Without that range of hosts for each viral OTU, there would be a need for a compensatory fitness mechanism that would allow the susceptible cells to coexist with resistant ones. According to KtW predictions, such a mechanism is provided by combining a range of host growth rates and a corresponding cost of resistance (COR) (see below).
Killing the winner revisited.
Planktonic communities are composed of organisms with a broad range of growth rates. In theory, one would expect the fast growers to take over the system; however, that is not the case. In a situation where nutrients are limited, mechanisms must exist that compensate for the potentially lower fitness of the slow growers. Because viral success depends to a considerable extent on the abundance of host cells, viral infection is probably such a mechanism, where prokaryotic types with higher growth rates would be exposed to stronger viral pressure (negative frequency-dependent selection). This idea that viruses are instrumental in maintaining high prokaryotic richness is at the basis of the KtW model (26, 62, 63). KtW predicts that OTUs (of both viruses and the respective cellular hosts) will be spread along an average contribution axis reflecting the life strategy continuum, where rare OTUs can share the adaptive landscape with other, very abundant OTUs. This wide range of average contributions was observed for the T4-like myoviruses monitored here (Fig. 1).
Implicit in the traditional KtW formulation, there is a negative correlation between the amounts of energy (resources) that an organism can allocate to growth or to resistance; this is the COR. The latest developments in KtW show that unexpected inverse rank-abundance curves for hosts and viruses are obtained at high COR, with the virus population dominated by viruses infecting the less dominant but fast-growing hosts (28, 64–66). Applied to our observations, this means that less abundant OTUs would correspond to viruses with lower virulence levels infecting k-selected (defense specialist) hosts; the most abundant OTUs would correspond to viruses with very high virulence infecting fast-growing hosts with low costs of resistance (r-selected [competition specialist] hosts). This linking would prevent the r-selected hosts from taking over the system and hence be essential to the maintenance of a highly diverse and dynamic microbial community. Although this idea cannot be tested under the present framework, it has had support from experimental data showing that the mortality of a diverse array of viruses infecting Escherichia coli positively correlated with their multiplication rates (67).
Our study explores an extra dimension not accounted for in KtW: time (which creates the variable “incidence”). By monitoring the distribution of different viral types along a time axis, we were able to assign an “incidence” value for each OTU (Fig. 2). The results were surprising in that we observed a tendency for the most common OTUs (highest incidences) to also maintain high average abundances. Going beyond the KtW predictions, this resulted in a myoviral community that, while enduring major seasonal shifts, was consistently dominated by the same group of very abundant viruses (at least during those 2 years). It is relevant that the long-term analysis of T4-like myovirus communities in temperate Pacific waters (ca. 20 km offshore of Los Angeles) also reported a very similar recurrent seasonal pattern where the more abundant OTUs persisted year round (21).
Conclusions.
Our results reinforced the idea of seasonality and recurrence of large marine viral assemblies. They also highlight the need to account in our modeling efforts for the possibility that very dynamic marine viral communities might actually be dominated by restricted groups of persistently abundant viruses.
Although it is hypothetical, one could consider the possibility of microbial communities being characterized by constantly having in their ranks groups of fast-growing cells with very broad adaptive fitness, meaning cellular types able to thrive under most conditions, for example, independently of the seasonal fluctuations in temperature and nutrient availability. Such r-selected microbes would take over the community if they were not constantly controlled by specific predation. It is not unreasonable to consider that the high-incidence and abundant viruses observed here could be providing such specific top-down predation. The TRFLP approach employed in our study does not allow examination of the specific host-virus interactions taking place, but we consider that in the future it will be of crucial interest to test in situ the predicted respective connections between r- and k-selected hosts and their viruses.
Supplementary Material
ACKNOWLEDGMENTS
This work was supported by the European Research Council through project MINOS, no. 250254. A. Pagarete acknowledges a traveling grant from the Alminnelige Naturvitenskapelige Forskningsfond, University of Bergen, Bergen, Norway. C.-E.T. Chow was supported by a Graduate Research Fellowship from the U.S. National Science Foundation. We also acknowledge support from NSF grant 1031743 to J. A. Fuhrman.
We thank the three anonymous reviewers who significantly contributed to the improvement of the manuscript.
Footnotes
Published ahead of print 2 August 2013
Supplemental material for this article may be found at http://dx.doi.org/10.1128/AEM.01075-13.
REFERENCES
- 1.Suttle CA. 2005. Viruses in the sea. Nature 437:356–361 [DOI] [PubMed] [Google Scholar]
- 2.Proctor LM, Fuhrman JA. 1990. Viral mortality of marine Bacteria and Cyanobacteria. Nature 343:60–62 [Google Scholar]
- 3.Bratbak G, Wilson W, Heldal M. 1996. Viral control of Emiliania huxleyi blooms? J. Mar. Syst. 9:75–81 [Google Scholar]
- 4.Bratbak G, Thingstad F, Heldal M. 1994. Viruses and the microbial loop. Microb. Ecol. 28:209–221 [DOI] [PubMed] [Google Scholar]
- 5.Fuhrman JA. 1999. Marine viruses and their biogeochemical and ecological effects. Nature 399:541–548 [DOI] [PubMed] [Google Scholar]
- 6.Weinbauer MG, Rassoulzadegan F. 2004. Are viruses driving microbial diversification and diversity? Environ. Microbiol. 6:1–11 [DOI] [PubMed] [Google Scholar]
- 7.Bergh O, Borsheim KY, Bratbak G, Heldal M. 1989. High abundance of viruses found in aquatic environments. Nature 340:467–468 [DOI] [PubMed] [Google Scholar]
- 8.Jiang SC, Paul JH. 1994. Seasonal and dieal abundance of viruses and occurrence of lysogeny/bacteriocinogeny in the marine environment. Mar. Ecol. Prog. Ser. 104:163–172 [Google Scholar]
- 9.Wommack KE, Colwell RR. 2000. Virioplankton: viruses in aquatic ecosystems. Microbiol. Mol. Biol. Rev. 64:69–114 [DOI] [PMC free article] [PubMed] [Google Scholar]
- 10.Sandaa RA, Gomez-Consarnau L, Pinhassi J, Riemann L, Malits A, Weinbauer MG, Gasol JM, Thingstad TF. 2009. Viral control of bacterial biodiversity: evidence from a nutrient-enriched marine mesocosm experiment. Environ. Microbiol. 11:2585–2597 [DOI] [PubMed] [Google Scholar]
- 11.Martinez-Martinez J, Schroeder DC, Larsen A, Bratbak G, Wilson WH. 2007. Molecular dynamics of Emiliania huxleyi and their co-occurring viruses during two separate mesocosm studies. Appl. Environ. Microbiol. 73:554–562 [DOI] [PMC free article] [PubMed] [Google Scholar]
- 12.Short SM, Short CM. 2009. Quantitative PCR reveals transient and persistent algal viruses in Lake Ontario, Canada. Environ. Microbiol. 11:2639–2648 [DOI] [PubMed] [Google Scholar]
- 13.Schroeder DC, Oke J, Hall M, Malin G, Wilson WH. 2003. Virus succession observed during an Emiliania huxleyi bloom. Appl. Environ. Microbiol. 69:2484–2490 [DOI] [PMC free article] [PubMed] [Google Scholar]
- 14.Short SM, Suttle CA. 2003. Temporal dynamics of natural communities of marine algal viruses and eukaryotes. Aquat. Microb. Ecol. 32:107–119 [Google Scholar]
- 15.Breitbart M, Felts B, Kelley S, Mahaffy JM, Nulton J, Salamon P, Rohwer F. 2004. Diversity and population structure of a near-shore marine-sediment viral community. Proc. Biol. Sci. 271:565–574 [DOI] [PMC free article] [PubMed] [Google Scholar]
- 16.Breitbart M, Salamon P, Andresen B, Mahaffy JM, Segall AM, Mead D, Azam F, Rohwer F. 2002. Genomic analysis of uncultured marine viral communities. Proc. Natl. Acad. Sci. U. S. A. 99:14250–14255 [DOI] [PMC free article] [PubMed] [Google Scholar]
- 17.Edwards RA, Rohwer F. 2005. Viral metagenomics. Nat. Rev. Microbiol. 3:504–510 [DOI] [PubMed] [Google Scholar]
- 18.Breitbart M, Rohwer F. 2005. Here a virus, there a virus, everywhere the same virus? Trends Microbiol. 13:278–284 [DOI] [PubMed] [Google Scholar]
- 19.Muhling M, Fuller NJ, Millard A, Somerfield PJ, Marie D, Wilson WH, Scanlan DJ, Post AF, Joint I, Mann NH. 2005. Genetic diversity of marine Synechococcus and co-occurring cyanophage communities: evidence for viral control of phytoplankton. Environ. Microbiol. 7:499–508 [DOI] [PubMed] [Google Scholar]
- 20.Parsons RJ, Breitbart M, Lomas MW, Carlson CA. 2012. Ocean time-series reveals recurring seasonal patterns of virioplankton dynamics in the northwestern Sargasso Sea. ISME J. 6:273–284 [DOI] [PMC free article] [PubMed] [Google Scholar]
- 21.Chow C-ET, Fuhrman JA. 2012. Seasonality and monthly dynamics of marine myovirus communities. Environ. Microbiol. 14:2171–2183 [DOI] [PubMed] [Google Scholar]
- 22.Marston MF, Taylor S, Sme N, Parsons RJ, Noyes TJE, Martiny JBH. 2013. Marine cyanophages exhibit local and regional biogeography. Environ. Microbiol. 15:1452–1463 [DOI] [PubMed] [Google Scholar]
- 23.Short CM, Rusanova O, Short SM. 2011. Quantification of virus genes provides evidence for seed-bank populations of phycodnaviruses in Lake Ontario, Canada. ISME J. 5:810–821 [DOI] [PMC free article] [PubMed] [Google Scholar]
- 24.Thingstad TF. 2000. Elements of a theory for the mechanisms controlling abundance, diversity, and biogeochemical role of lytic bacterial viruses in aquatic systems. Limnol. Oceanogr. 45:1320–1328 [Google Scholar]
- 25.Thingstad TF, Lignell R. 1997. Theoretical models for the control of bacterial growth rate, abundance, diversity and carbon demand. Aquat. Microb. Ecol. 13:19–27 [Google Scholar]
- 26.Fuhrman JA, Suttle C. 1993. Viruses in marine planktonic systems. Oceanography 6:51–63 [Google Scholar]
- 27.Suttle CA. 2007. Marine viruses: major players in the global ecosystem. Nat. Rev. Microbiol. 5:801–812 [DOI] [PubMed] [Google Scholar]
- 28.Våge S, Storesund JE, Thingstad TF. 2013. Adding a cost of resistance description extends the ability of virus-host model to explain observed patterns in structure and function of pelagic microbial communities. Environ. Microbiol. 15:1842–1852 [DOI] [PubMed] [Google Scholar]
- 29.Ackermann HW, Krisch HM. 1997. A catalogue of T4-type bacteriophages. Arch. Virol. 142:2329–2345 [DOI] [PubMed] [Google Scholar]
- 30.International Committee on Taxonomy of Viruses 2012. Virus taxonomy: classification and nomenclature of viruses: ninth report of the International Committee on Taxonomy of Viruses. Elsevier, San Diego, CA [Google Scholar]
- 31.Bench SR, Hanson TE, Williamson KE, Ghosh D, Radosovich M, Wang K, Wommack KE. 2007. Metagenomic characterization of Chesapeake Bay virioplankton. Appl. Environ. Microbiol. 73:7629–7641 [DOI] [PMC free article] [PubMed] [Google Scholar]
- 32.DeLong EF, Preston CM, Mincer T, Rich V, Hallam SJ, Frigaard NU, Martinez A, Sullivan MB, Edwards R, Brito BR, Chisholm SW, Karl DM. 2006. Community genomics among stratified microbial assemblages in the ocean's interior. Science 311:496–503 [DOI] [PubMed] [Google Scholar]
- 33.Filee J, Tetart F, Suttle CA, Krisch HM. 2005. Marine T4-type bacteriophages, a ubiquitous component of the dark matter of the biosphere. Proc. Natl. Acad. Sci. U. S. A. 102:12471–12476 [DOI] [PMC free article] [PubMed] [Google Scholar]
- 34.Lopez-Bueno A, Tamames J, Velazquez D, Moya A, Quesada A, Alcami A. 2009. High diversity of the viral community from an Antarctic lake. Science 326:858–861 [DOI] [PubMed] [Google Scholar]
- 35.Williamson SJ, Rusch DB, Yooseph S, Halpern AL, Heidelberg KB, Glass JI, Andrews-Pfannkoch C, Fadrosh D, Miller CS, Sutton G, Frazier M, Venter JC. 2008. The Sorcerer II Global Ocean Sampling Expedition: metagenomic characterization of viruses within aquatic microbial samples. PLoS One 3:e1456. 10.1371/journal.pone.0001456 [DOI] [PMC free article] [PubMed] [Google Scholar]
- 36.Larsen A, Flaten GAF, Sandaa RA, Castberg T, Thyrhaug R, Erga SR, Jacquet S, Bratbak G. 2004. Spring phytoplankton bloom dynamics in Norwegian coastal waters: microbial community succession and diversity. Limnol. Oceanogr. 49:180–190 [Google Scholar]
- 37.Sandaa RA, Larsen A. 2006. Seasonal variations in virus-host populations in Norwegian coastal waters: focusing on the cyanophage community infecting marine Synechococcus spp. Appl. Environ. Microbiol. 72:4610–4618 [DOI] [PMC free article] [PubMed] [Google Scholar]
- 38.Gasol JM, Del Giorgio PA. 2000. Using flow cytometry for counting natural planktonic bacteria and understanding the structure of planktonic bacterial communities. Sci. Mar. 64:197–224 [Google Scholar]
- 39.Ruan Q, Steele JA, Schwalbach MS, Fuhrman JA, Sun FZ. 2006. A dynamic programming algorithm for binning microbial community profiles. Bioinformatics 22:1508–1514 [DOI] [PubMed] [Google Scholar]
- 40.Clarke KR, Somerfield PJ, Chapman MG. 2006. On resemblance measures for ecological studies, including taxonomic dissimilarities and a zero-adjusted Bray-Curtis coefficient for denuded assemblages. J. Exp. Mar. Biol. Ecol. 330:55–80 [Google Scholar]
- 41.Comeau AM, Krisch HM. 2008. The capsid of the T4 phage superfamily: the evolution, diversity, and structure of some of the most prevalent proteins in the biosphere. Mol. Biol. Evol. 25:1321–1332 [DOI] [PubMed] [Google Scholar]
- 42.Magurran AE. 1988. Ecological diversity and its measurement. Croom Helm, London, United Kingdom [Google Scholar]
- 43.Erga SR, Heimdal BR. 1984. Ecological-studies on the phytoplankton of Korsfjorden, Western Norway: the dynamics of a spring bloom seen in relation to hydrographical conditions and light regime. J. Plankton Res. 6:67–90 [Google Scholar]
- 44.Hillebrand H. 2004. On the generality of the latitudinal diversity gradient. Am. Nat. 163:192–211 [DOI] [PubMed] [Google Scholar]
- 45.Fuhrman JA, Steele JA, Hewson I, Schwalbach MS, Brown MV, Green JL, Brown JH. 2008. A latitudinal diversity gradient in planktonic marine bacteria. Proc. Natl. Acad. Sci. U. S. A. 105:7774–7778 [DOI] [PMC free article] [PubMed] [Google Scholar]
- 46.Pommier T, Canback B, Riemann L, Bostrom KH, Simu K, Lundberg P, Tunlid A, Hagstrom A. 2007. Global patterns of diversity and community structure in marine bacterioplankton. Mol. Ecol. 16:867–880 [DOI] [PubMed] [Google Scholar]
- 47.Erga SR. 1989. Ecological studies on the phytoplankton of Boknafjorden, western Norway. 1. The effect of water exchange processes and environmental factors on temporal and vertical variability of biomass. Sarsia 74:161–176 [Google Scholar]
- 48.Corinaldesi C, Dell'Anno A, Magagnini M, Danovaro R. 2010. Viral decay and viral production rates in continental-shelf and deep-sea sediments of the Mediterranean Sea. FEMS Microbiol. Ecol. 72:208–218 [DOI] [PubMed] [Google Scholar]
- 49.Heldal M, Bratbak G. 1991. Production and decay of viruses in aquatic environments. Mar. Ecol. Prog. Ser. 72:205–212 [Google Scholar]
- 50.Murray AG, Jackson GA. 1993. Viral dynamics. 2. A model of the interaction of ultraviolet-light and mixing processes on virus survival in seawater. Mar. Ecol. Prog. Ser. 102:105–114 [Google Scholar]
- 51.Noble RT, Fuhrman JA. 1997. Virus decay and its causes in coastal waters. Appl. Environ. Microbiol. 63:77–83 [DOI] [PMC free article] [PubMed] [Google Scholar]
- 52.Suttle CA, Feng C. 1992. Mechanisms and rates of decay of marine viruses in seawater. Appl. Environ. Microbiol. 58:3721–3729 [DOI] [PMC free article] [PubMed] [Google Scholar]
- 53.Wilhelm SW, Weinbauer MG, Suttle CA, Jeffrey WH. 1998. The role of sunlight in the removal and repair of viruses in the sea. Limnol. Oceanogr. 43:586–592 [Google Scholar]
- 54.Marston MF, Sallee JL. 2003. Genetic diversity and temporal variation in the cyanophage community infecting marine Synechococcus species in Rhode Island's coastal waters. Appl. Environ. Microbiol. 69:4639–4647 [DOI] [PMC free article] [PubMed] [Google Scholar]
- 55.Tomaru Y, Hata N, Masuda T, Tsuji M, Igata K, Masuda Y, Yamatogi T, Sakaguchi M, Nagasaki K. 2007. Ecological dynamics of the bivalve-killing dinoflagellate Heterocapsa circularisquama and its infectious viruses in different locations of western Japan. Environ. Microbiol. 9:1376–1383 [DOI] [PubMed] [Google Scholar]
- 56.Wommack KE, Ravel J, Hill RT, Chun JS, Colwell RR. 1999. Population dynamics of Chesapeake Bay virioplankton: total-community analysis by pulsed-field gel electrophoresis. Appl. Environ. Microbiol. 65:231–240 [DOI] [PMC free article] [PubMed] [Google Scholar]
- 57.Sullivan MB, Waterbury JB, Chisholm SW. 2003. Cyanophages infecting the oceanic cyanobacterium Prochlorococcus. Nature 424:1047–1051 [DOI] [PubMed] [Google Scholar]
- 58.Wichels A, Biel SS, Gelderblom HR, Brinkhoff T, Muyzer G, Schutt C. 1998. Bacteriophage diversity in the North Sea. Appl. Environ. Microbiol. 64:4128–4133 [DOI] [PMC free article] [PubMed] [Google Scholar]
- 59.Avrani S, Schwartz DA, Lindell D. 2012. Virus-host swinging party in the oceans: incorporating biological complexity into paradigms of antagonistic coexistence. Mob. Genet. Elements 2:88–95 [DOI] [PMC free article] [PubMed] [Google Scholar]
- 60.Fuhrman JA. 2009. Microbial community structure and its functional implications. Nature 459:193–199 [DOI] [PubMed] [Google Scholar]
- 61.Rodriguez-Brito B, Li LL, Wegley L, Furlan M, Angly F, Breitbart M, Buchanan J, Desnues C, Dinsdale E, Edwards R, Felts B, Haynes M, Liu H, Lipson D, Mahaffy J, Martin-Cuadrado AB, Mira A, Nulton J, Pasic L, Rayhawk S, Rodriguez-Mueller J, Rodriguez-Valera F, Salamon P, Srinagesh S, Thingstad TF, Tran T, Thurber RV, Willner D, Youle M, Rohwer F. 2010. Viral and microbial community dynamics in four aquatic environments. ISME J. 4:739–751 [DOI] [PubMed] [Google Scholar]
- 62.Thingstad TF, Heldal M, Bratbak G, Dundas I. 1993. Are viruses important partners in pelagic food webs. Trends Ecol. Evol. 8:209–213 [DOI] [PubMed] [Google Scholar]
- 63.Weinbauer MG. 2004. Ecology of prokaryotic viruses. FEMS Microbiol. Rev. 28:127–181 [DOI] [PubMed] [Google Scholar]
- 64.Avrani S, Wurtzel O, Sharon I, Sorek R, Lindell D. 2011. Genomic island variability facilitates Prochlorococcus-virus coexistence. Nature 474:604–608 [DOI] [PubMed] [Google Scholar]
- 65.Lennon JT, Khatana SAM, Marston MF, Martiny JBH. 2007. Is there a cost of virus resistance in marine cyanobacteria? ISME J. 1:300–312 [DOI] [PubMed] [Google Scholar]
- 66.Middelboe M, Holmfeldt K, Riemann L, Nybroe O, Haaber J. 2009. Bacteriophages drive strain diversification in a marine Flavobacterium: implications for phage resistance and physiological properties. Environ. Microbiol. 11:1971–1982 [DOI] [PubMed] [Google Scholar]
- 67.De Paepe M, Taddei F. 2006. Viruses' life history: towards a mechanistic basis of a trade-off between survival and reproduction among phages. PLoS Biol. 4:e193. 10.1371/journal.pbio.0040193 [DOI] [PMC free article] [PubMed] [Google Scholar]
Associated Data
This section collects any data citations, data availability statements, or supplementary materials included in this article.