

Abstract
Hepatitis B virus (HBV)-associated chronic liver diseases are treated with nucleoside analogs that target the virus polymerase. While these analogs are potent, drugs are needed to target other virus-encoded gene products to better block the virus replication cycle and chronic liver disease. This work further characterized GLS4 and compared it to the related BAY 41-4109, both of which trigger aberrant HBV core particle assembly, where the virus replication cycle occurs. This was done in HepAD38 cells, which replicate HBV to high levels. In vitro, GLS4 was significantly less toxic for primary human hepatocytes (P < 0.01 up to 100 μM), inhibited virus accumulation in the supernantant of HepAD38 cells (P < 0.02 up to 100 nM), inhibited HBV replicative forms in the liver with a significantly lower 50% effective concentration (EC50) (P < 0.02), and more strongly inhibited core gene expression (P < 0.001 at 100 to 200 nM) compared to BAY 41-4109. In vivo characterization was performed in nude mice inoculated with HepAD38 cells, which grew out as tumors, resulting in viremia. Treatment of mice with GLS4 and BAY 41-4109 showed strong and sustained suppression of virus DNA to about the same extents both during and after treatment. Both drugs reduced the levels of intracellular core antigen in the tumors. Alanine aminotransferase levels were normal. Tumor and total body weights were not affected by treatment. Thus, GLS4 was as potent as the prototype, BAY 41-4109, and was superior to lamivudine, in that there was little virus relapse after the end of treatment and no indication of toxicity.
INTRODUCTION
There are more than 350 million people worldwide (1) chronically infected with hepatitis B virus (HBV) at high risk for the development of chronic liver diseases (CLD), including hepatitis, fibrosis, cirrhosis, and hepatocellular carcinoma (HCC) (2, 3). Persistent virus replication and progressive chronic liver disease are associated with a high risk for tumor appearance (2, 4–6). Therefore, much effort has focused upon understanding the life cycle of HBV so that specific antiviral drugs could be developed.
When HBV infects cells, the partially double-stranded genome becomes fully double stranded and then appears as supercoiled DNA in the cell nucleus. Supercoiled virus DNA exists as a minichromosome (7) and is the template for all the virus mRNAs, including the greater-than-genome-length pregenomic RNA (8, 9). The latter migrates into the cytoplasm, where it becomes packaged along with the virus-encoded polymerase/reverse transcriptase within immature core (nucleocapsid) particles (8–10). In this context, the pregenomic RNA then becomes reverse transcribed into minus-strand DNA, and after the RNA is degraded, partial plus-strand viral DNA synthesis occurs while the virus buds from the cell (8, 9, 11). Thus, replication occurs within core particles in the cytoplasm prior to the maturation of virus particles.
Given the large burden of infection and disease, it was important to develop efficacious drugs against chronic hepatitis B. Knowledge that the pathogenesis of chronic infection was immune mediated (12) led to the development and application of interferons and pegylated interferons for treatment, but they were effective in less than half the treated patients (13), were expensive, and had significant side effects. Nucleoside and nucleotide analogs have also been developed that target the virus polymerase/reverse transcriptase, and although these are nontoxic, drug resistance has been observed (14). Simultaneous treatment with multiple nucleoside analogs appeared to be more effective (15–17). In this context, the success of combination therapy for human immunodeficiency virus infection, aimed at multiple virus targets (18), may serve as a good model for drug development against additional targets in HBV.
Recently, a new class of compounds that target the HBV nucleocapsid has been discovered (19). The prototype, BAY 41-4109, was developed and shown to inhibit HBV DNA replication in HepG2.2.15 cells by destabilizing core particle assembly and by disrupting existing capsids, yielding large noncapsid polymers (19–23). BAY 41-4109 was shown to partially inhibit the virus replication cycle in HBV transgenic mice (24) and in Alb-uPA/SCID mice (25). HBV BAY 41-4109 was also effective against lamivudine- and adefovir-resistant mutants (22, 26) but was hepatotoxic at high doses in rats (27). To build upon these findings, a series of BAY 41-4109 analogs were made, and the analog GLS4 (28) was shown to have potent antiviral activity in vitro in HepG2.2.15 cells (26). In this context, the present work further characterizes GLS4 relative to BAY 41-4109. Both compounds are heteroarylpyrimidines, although the in vitro data suggest that GLS4 may be more potent and less toxic than BAY 41-4109.
MATERIALS AND METHODS
Drugs.
Sunshine Lake Pharma Co., Ltd. (HEC), has provided all of the drugs, reagents, and buffers used in this study and protocols for drug formulation. For GLS4 {6[R,S]-ethyl-6-(2-bromo-4-fluorophenyl)-4-(morpholinomethyl)-2-(thiazol-2-yl)-1,6-dihydropyrimidine-5-carboxylate}, the HEC lot used was HEC-GLS4-070901; for BAY 41-4109 [methyl-4-(2-chloro-4-fluorophenyl)-2-(3,5-difluoro-2-pyridinyl)-6-methyl-1,4-dihydropyrimidine-5-carboxylate], the lot used was 4109-3z-080630; and for lamivudine (3TC), the lots used were numbers 20090701 and 0707019. GLS4 and BAY 41-4109 were solubilized in 0.1 M HCl, and small volumes added to culture medium were used. Chemical synthesis and purity of GLS4 and BAY 41-4109 have been previously described (29).
Cells and culture.
Primary human hepatocytes were purchased from CellzDirect (Durham, NC) and used within 48 h of becoming available from the donor. Ten thousand primary hepatocytes plated into each well of a 96-well plate by the manufacturer were maintained in a humidified incubator at 37°C and 5% CO2, with medium changed daily.
HepAD38 cells were grown to about 80% confluence in 0.3 μg/ml of tetracycline (TET) (30). In the presence of TET, the virus replication cycle was strongly suppressed, but in the absence of TET, the virus replication cycle was robust and under the control of the native virus enhancers and promoters unless an inhibitor of HBV replication was present (30, 31). After the removal of TET, the cells were treated with different doses of GLS4, BAY 41-4109, or no drug. Cell viability was monitored by 3-(4,5-dimethyl-2-thiazolyl)-2,5-diphenyl-2H-tetrazolium bromide (MTT) assay (Invitrogen, Carlsbad, CA).
In vivo PK and toxicity studies.
ICR mice were used to evaluate the pharmacokinetic (PK) properties of GLS4. Following oral administration of 10 mg/kg (of body weight) of GLS4 to male mice, the concentration of GLS4 in plasma was determined using liquid chromatography-tandem mass spectrometry (LC/MS/MS). For toxicity studies, ICR mice were given GLS4 by gavage over a 4-week period and then kept off drug for another 2 weeks. Groups consisting of 20 male plus 20 female mice were administered a vehicle (1% methyl-2-hydroxyethyl cellulose), 35.7, 118.9, or 356.6 mg/kg per day in a volume corresponding to 20 ml/kg. Ten mice per dose group were euthanized 2 weeks after the end of drug treatment. Body weight, food consumption, serum albumin levels, and adverse effects were determined. All experiments using mice were approved by the Institutional Animal Care and Use committees (IACUC) at Temple University and at Sunshine Lake Pharma Co., Ltd.
Protocol.
Given that HepAD38 cells formed subcutaneous tumors in nude mice, resulting in viremia that approached 108 virus genome equivalents/ml of blood within 30 days, this system was used to assess the potency of compounds against hepatitis B in vivo (17). Accordingly, young adult nude mice of either gender were subcutaneously inoculated on the back in the hind quarter with 1 × 10⁷ HepAD38 cells. When tumors were palpable (usually 4 to 5 weeks postinjection), the levels of HBV DNA in serum was quantified by real-time PCR. Mice with HBV DNA titers of >104 copies/ml were used. TET (2.5 mg/ml) was then added to their drinking water for 2 weeks (weeks 0 and 1 in the figures below) to suppress the virus replication cycle. TET was then removed, and various treatments were performed for 2 weeks (weeks 2 and 3 in the figures below [treatment period]), followed by another 2 weeks off drug (weeks 4 and 5 [rebound period]). For this work, mice were divided randomly into groups of 10 mice each and then treated with TET only (group 1), drug carrier alone (group 2), or GLS4 at a dose of 3.75 (group 3), 7.5 (group 4), 15 (group 5), 30 (group 6), or 60 (group 7) mg/kg per day. Additional groups of mice were treated with BAY 41-4109 (at 60 mg/kg per day) (group 7) or lamivudine (100 mg/kg per day) (group 8). Mice were gavaged daily for 14 days at 0.2 ml per dose. The drug carrier, 2% methyl-2 hydroxyethyl cellulose in water, was used to dissolve GLS4 and BAY 41-4109. A retro-orbital blood sample was obtained weekly for HBV DNA quantification and alanine aminotransferase (ALT) measurements. Mice were weighed just before treatment and at weekly intervals thereafter. At the end of week 5, mice were euthanized, tumors were removed, and wet weights were determined. Tumors from several mice treated with 60 mg/kg per day of GLS4 were collected at the end of treatment and from identically treated mice after the rebound period. Tumor extracts were assayed for core polypeptide (p21) by Western blotting.
Quantification of HBV DNA.
To measure drug efficacy by real-time PCR, DNA was extracted from tissue culture supernatant or serum using the QIAamp DNA blood minikit (Qiagen, Germantown, Maryland). For analysis, 200 μl of cell culture supernatant or 100 μl of mouse serum was digested with 1 μl of RNase-free DNase I (10 to 50 U/μl; Roche, Nutley, NJ) at 37°C for 30 min, and the DNA was recovered from a minispin column in 200 μl of eluant. Real-time PCR was carried out as described previously (17) in an Eppendorf Master Cycler (Eppendorf, Westbury, NY).
Southern blot hybridization.
Quantification of intracellular HBV DNA replicative forms was performed by Southern blot hybridization (32). Hybridization was conducted under high stringency using an HBc region probe in the standard enhanced chemiluminescence (ECL) assay (Amersham). Semiquantification was done by gel scanning of the autoradiographic images using a PhosphorImager (Molecular Dynamics). HBV covalently closed circular DNA (cccDNA), extracted from isolated nuclei of cells replicating virus, was detected by using a 32P-labeled HBV-specific DNA probe (Rediprime II; GE Healthcare, Piscataway, NJ). Signals were developed using Kodak X-OMAT film and analyzed using Quantity One software (Bio-Rad Laboratories, Inc., USA).
HBV core protein preparation.
HBV-like capsids were produced from C-terminally truncated HBc1–149 (Cp149). Cp149 was expressed in Escherichia coli and purified as described previously (33). Protein stock was stored at 4°C in 50 mM Na2CO3 (pH 9.6)–2 mM dithiothreitol (DTT). All preparations were stable for at least 6 months. Protein was quantified by determining the absorbance at 280 nm.
Determination of capsid size.
The sizes of HBV capsids were monitored by dynamic light scattering (DLS) after Cp149 (5 μM) was incubated with or without drug at different compound concentrations for 24 h (34). Particle sizes were also determined by transmission electron microscopy (TEM) and atomic force microscopy with Cp149 samples (5 μM) (35). In addition, Cp149 assembly reactions were evaluated by size exclusion chromatography (SEC) using Superose 6 10/300 GL (GE Healthcare Life Sciences, Piscataway, NJ) (36). Recovered protein was assigned to different forms of core (e.g., dimers, capsids, and large assembly forms) depending upon elution volume.
HBc staining.
HBc was detected in cultured cells and tissue sections by immunostaining. Tissue culture cells were grown on chamber slides to about 80% confluence and then fixed with methanol. Transplanted tumor tissues were fixed in 10% buffered formalin (Fisher, Philadelphia, PA) and embedded in paraffin, and 5-μm-thick sections were mounted on poly-l-lysine-coated slides. Slides were then stained as described previously (37) using a 1:100 dilution of anti-HBc as a primary antibody, followed by horseradish peroxidase-conjugated secondary antibody (HRP-anti-Ig) and substrate development (Dako, Carpenteria, CA).
Statistical analysis.
Student's t test was used to calculate the significance of the difference between the means of tests compared to control findings in measuring the comparative toxicity and antiviral efficacy of GLS4 compared to BAY 41-4109 and lamivudine.
RESULTS
Toxicity profiles of GLS4 compared to BAY 41-4109.
The molecular structures of GLS4 and BAY 41-4109, as previously published (19, 26), are shown in Fig. 1A. To establish the toxicity profiles of GLS4 and BAY 41-4109, primary human hepatocytes were treated with increasing concentrations of each drug for 48 h and then cell viability was measured. GLS4 was significantly less toxic than BAY 41-4109 at high drug concentrations (Fig. 1B) (P < 0.001 for 25 and 50 μM; P < 0.01 for 100 μM). GLS4 showed no toxicity up to 25 μM, while BAY 41-4109 showed about 60% toxicity. The cytotoxic doses whereby 50% of cells die (CC50) for primary hepatocytes were 35 μM for BAY 41-4109 and 115 μM for GLS4 (P < 0.001). The CC90 was not reached with either drug within the range of concentrations used. In contrast, the CC50s for GLS4 in HepAD38 cells (26 μM) and BAY 41-4109 (35 μM) were similar (Fig. 1C) (P > 0.1). The CC90s were 82 μM for BAY 41-4109 and 190 μM for GLS4 (P < 0.01) in HepAD38 cells, indicating that GLS4 was less toxic than BAY 41-4109 under the same conditions.
Fig 1.
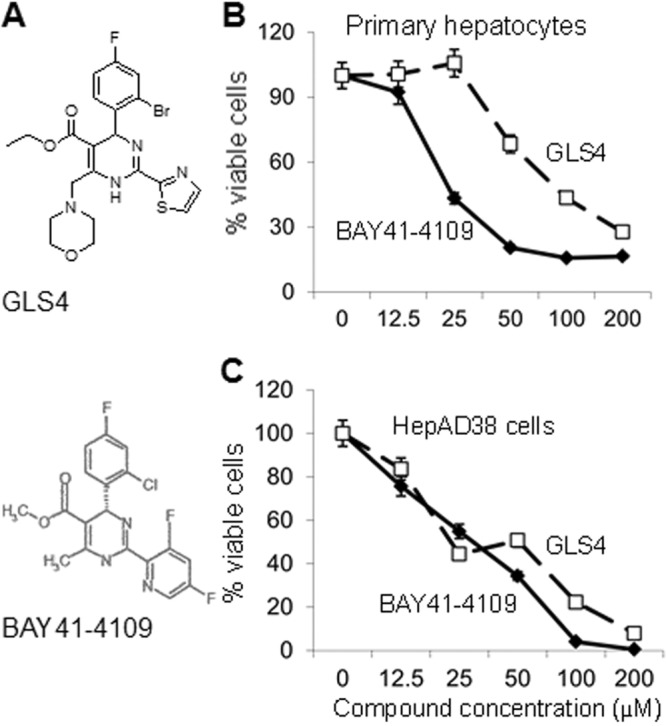
(A) Molecular structures of GLS4 and BAY 41-4109. (Reprinted from references 19 and 26 with permission of the publishers.) (B and C) Viability of primary hepatocytes (B) and HepAD38 cells (C) to increasing concentrations of BAY 41-4109 (diamonds) or GLS4 (squares) was determined using the MTT assay. The graphs show the mean of three independent experiments. Error bars indicate standard deviation based upon the mean value at each data point.
In vitro antiviral activities of GLS4 and BAY 41-4109.
HepAD38 cells were then used to assess the antiviral activities of BAY 41-4109 and GLS4. Given that these drugs were toxic to HepAD38 cells at low micromolar concentrations (Fig. 1), antiviral activity was assessed within the nanomolar range. Accordingly, 5 × 10⁶ cells were seeded into each well of 6-well plates, and the wells were then treated with GLS4 or BAY 41-4109 for 7 days. Fresh medium and drug were added daily. Cell supernatants were assayed for the levels of HBV DNA by real-time PCR. The results showed that GLS4 more strongly inhibited virus accumulation in the supernatant of HepAD38 cells than did BAY 41-4109 at 25 nM to 100 nM (P < 0.02) (Fig. 2). GLS4 was also more potent than lamivudine at all concentrations of ≥25 nM. However, the potency of BAY 41-4109 was similar to that of lamivudine except at concentrations of >100 nM.
Fig 2.
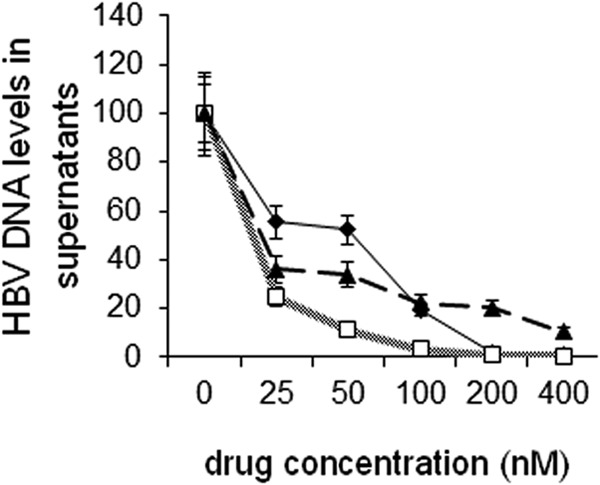
Quantification of HBV DNA in the supernatants of compound-treated HepAD38 cells by real-time PCR at different concentrations of BAY 41-4109 (diamonds), GLS4 (squares), and lamivudine (triangles). The graph shows the means of three independent experiments. Error bars indicate standard deviation based upon the mean value at each data point.
To confirm that the antiviral effects of GLS4 inhibited the virus replication cycle and not just virus secretion, HepAD38 cells were analyzed for virus replicative forms by Southern blot hybridization. Figure 3 shows the replicative forms of HBV DNA that were detectable at different concentrations of GLS4, BAY 41-4109, and lamivudine. When TET was removed and no GLS4 was added, high levels of HBV DNA were detected after 7 days (Fig. 3A, lane 1). When TET was removed and immediately replaced with the indicated concentrations of GLS4, there was a concentration-dependent inhibition of HBV replication (Fig. 3A, lanes 2 to 6). The concentration whereby HBV replication was inhibited by 50% (50% effective concentration [EC50]) was 62.24 nM. For BAY 41-4109, the EC50 was 124.28 nM (P < 0.02) (Fig. 3B), indicating that GLS4 was more potent than BAY41-4109. Figure 3C shows the results for lamivudine. In Fig. 3A to C, the replicative forms of HBV DNA consisted of relaxed circular DNA (RC) at 4 kb, fully double-stranded HBV DNA (DS) at 3 kb, and variably long single-stranded DNA (SS) <3 kb in size. In Fig. 3D, the data collected from the gel scans in Fig. 3A to C were plotted, again showing that GLS4 was more potent than BAY 41-4109 at most drug concentrations. Both were also more potent than lamivudine. HBV cccDNA was also sensitive to 400 nM GLS4, BAY 41-4109, and lamivudine (Fig. 3E).
Fig 3.
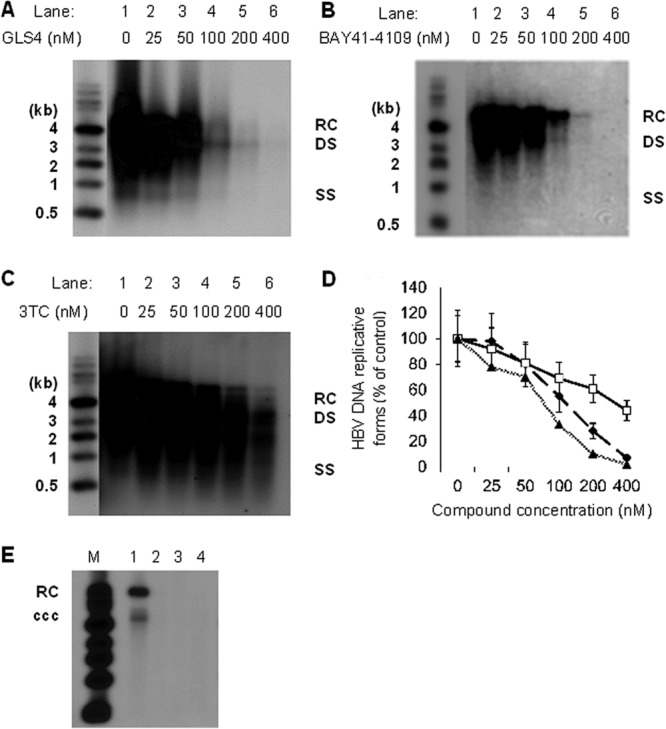
Southern blot hybridization of HBV replicative forms. HepAD38 cells were treated with increasing concentrations of GLS4 (A), BAY 41-4109 (B), or lamivudine (C). The scanned data from three independent experiments are graphically presented in panel D. The graph shows the means of three independent experiments. Error bars indicate standard deviation based upon the mean value at each data point. Triangles, GLS4; diamonds, BAY 41-4109; squares, lamivudine. In panel E, HepAD38 cells were not treated with drug (lane 1) or were treated with 400 nM GLS4 (lane 2), BAY 41-4109 (lane 3), or lamivudine (lane 4) for 7 days. HBV cccDNA was then detected by Southern blot hybridization. M, molecular weight markers.
Based upon these data, the selective index for each drug (in HepAD38 cells) was determined, which is defined as the ratio of the CC50 of cell viability to the EC50 of HBV DNA levels (based on the Southern blot scans in Fig. 3). The selective index for BAY 41-4109 was 210, and for GLS4 it was 562. Hence, GLS4 has a higher selective index than BAY 41-4109 under the same experimental conditions.
Effect of GLS4 upon HBc (core) expression.
Antiviral activity was also measured by the intracellular levels of HBc (core) antigen, which supports HBV replication in the cytoplasm of infected cells, and is targeted by GLS4. Figure 4A shows a concentration-dependent decrease of core protein in cells treated with GLS4 and BAY 41-4109 but not in cells treated with lamivudine (3TC). When these data were scanned and plotted, they showed highly significant differences between the levels of HBc polypeptide in GLS4- and BAY 41-4109-treated cells compared to lamivudine-treated cells at drug concentrations of 50 nM (P < 0.02), 100 nM (P < 0.001), and 200 nM (P < 0.001) (Fig. 4B).
Fig 4.
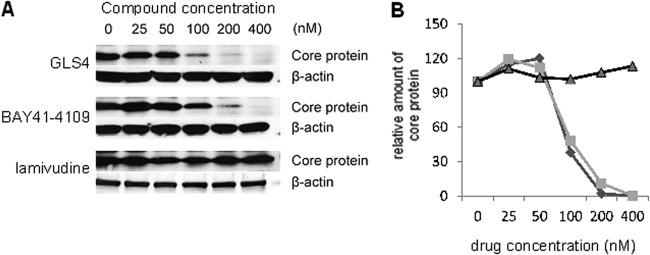
Intracellular levels of HBc polypeptide in HepAD38 cells treated with increasing doses of GLS4, BAY 41-4109, or lamivudine. (A) Representative Western blots of cell lysates. (B) Graphical representation of mean values from gel scans of three independent experiments of the type shown in panel A for GLS4 (diamonds), BAY 41-4109 (squares), and lamivudine (triangles). Error bars indicate standard deviation based upon the mean value at each data point.
GLS4 and BAY 41-4109 block normal capsid assembly.
The finding that BAY 41-4109 induces the formation of aberrant core particles in vitro (23) implies that GLS4 may do the same. To test this hypothesis, HBV core particle assembly was determined in vitro in the presence or absence of drugs. Initially, core particle assembly in a 10 μM Cp149 solution was monitored 24 h after the initiation by SEC using Superose 6. The different assembly forms of core were assigned based upon elution volume. In the absence of drug, there were two major peaks representing the 4-mDa capsid (peak A, 8.2 to 9.56 min) and the 35-kDa core polypeptide dimer (peak B, 15.36 to 15.46 min) (Fig. 5A). When Cp149 was incubated with 10 μM GLS4 (Fig. 5B) or 10 μM BAY 41-4109 (Fig. 5C), the 35-kDa dimer was not observed, consistent with increased assembly. As expected, both peaks were present in preparations incubated with 10 μM lamivudine (Fig. 5D).
Fig 5.
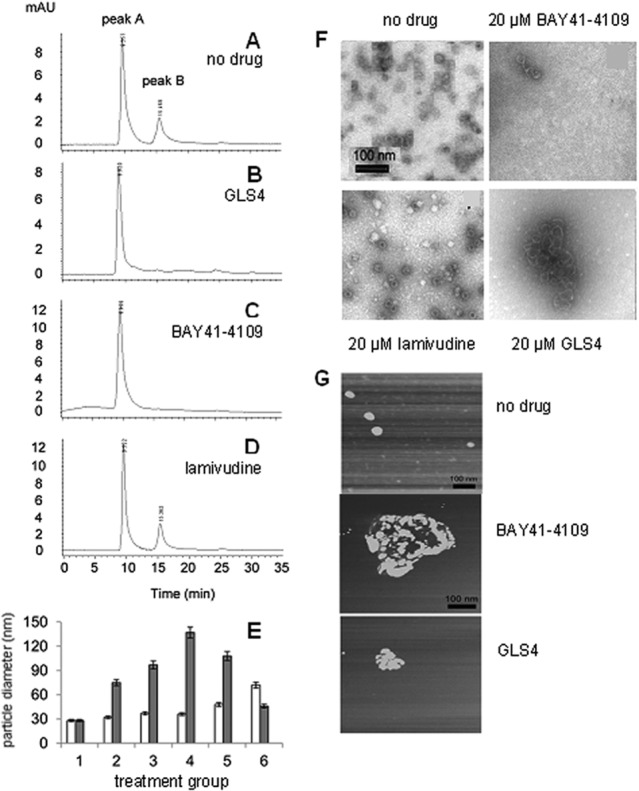
Assembly of 10 μM Cp149. This was examined by size exclusion chromatography with no drug (A) or 10 μM GLS4 (B), BAY 41-4109 (C), or lamivudine (D). The samples were run sequentially on the same column under identical conditions. (E) Dynamic light scattering was used to determine the average core particle diameter in Cp149 samples treated with no drug (group 1) or GLS4 (white bars) or BAY 41-4109 (gray bars) at 1.25 μM (group 2), 2.5 μM (group 3), 5 μM (group 4), 10 μM (group 5), or 20 μM (group 6). Error bars indicate standard deviation based upon the mean value at each data point. (F) TEM images of core particles with or without the indicated drugs. The images in the upper left (no drug) and lower right (20 μM GLS4) of this panel are similar to those previously published (26). (G) Atomic force microscopy of core particle assembly incubated without drug, with 10 μM BAY 41-4109, or with 10 μM GLS4. Experiments shown consist of an example from each experimental design performed in triplicate.
Particle size change was also assayed by dynamic light scattering (DLS), which was used to obtain the mean size of particles (capsids or masses) in suspension. The average particle size was around 26 nm without drug, which is similar to that of normal HBV capsids, but with 5 μM BAY 41-4109, the average particle size was 140 nm. Higher concentrations of BAY 41-4109 yielded smaller average particle sizes. In contrast, the particle size increased gradually with increasing dosage of GLS4 (Fig. 5E).
TEM images yielded complementary results. In the absence of drug, or after treatment with lamivudine, typical spherical particles of HBV core were observed (Fig. 5F). However, treatment of Cp149 preparations with BAY 41-4109 or GLS4 failed to show typical core particles and instead resulted in misassembled cores (Fig. 5F). The appearance of aberrant cores was concentration dependent for BAY 41-4109 and GLS4. At high concentrations of BAY 41-4109, there was mostly disaggregated debris with a few aberrantly assembled capsids (Fig. 5F). In contrast, aberrantly assembled capsids were commonly seen at high concentrations of GLS4 (Fig. 5F).
When atomic force microscopy (AFM) was used, spherical core particles of the expected size range (26- to 29-nm diameter) were observed in the absence of drug, but in the presence of BAY 41-4109 or GLS4, irregularly shaped core protein aggregates were present (Fig. 5G). These aggregates ranged from roughly 100 to 300 nm in diameter, with the largest ones in preparations treated with BAY 41-4109 (Fig. 5G). Thus, BAY 41-4109 or GLS4 treatment results in the aberrant polymerization of Cp149 and the appearance of aggregated core polypeptides.
PK and toxicity studies.
ICR mice were used to evaluate the PK properties of GLS4 as shown in Table 1. The time to maximum concentration of drug in serum (Tmax) was 0.25 h, and the elimination half-life (t1/2) was 1.78 h. This was longer than the t1/2 of BAY 41-4109, which was less than 1 h (24). The area under the concentration-time curve from 0 to 24 h (AUC0–24) of GLS4 was 556 h · ng/ml. After intravenous administration of 10 mg/kg GLS4, the total plasma clearance and apparent volume distribution were 4.2 liters/h/kg and 7.38 liters/kg, respectively, which were similar to those of BAY 41-4109 (24). Plasma exposure of GLS4 (AUC0–24) was 2,329 h · ng/ml. The bioavailability of GLS4 was 25.5%, while that of BAY 41-4109 was 31% (24). Thus, both drugs show fast absorption with a good oral bioavailability and dose-proportional concentrations in plasma (19, 24) (Table 1).
Table 1.
PK parameters of GLS4 after single intravenous or oral administration to micea
| Parameter | Value obtained with dose route |
|
|---|---|---|
| i.v. | p.o. | |
| AUCINF (h · ng/ml) | 2,384 ± 161 | 608 ± 71 |
| AUClast (h · ng/ml) | 2,329 ± 196 | 556 ± 44 |
| CL (liters/h/kg) | 4.2 ± 0.3 | |
| Cmax (ng/ml) | 1,175 ± 94 | |
| MRTINF (h) | 1.76 ± 0.93 | |
| t1/2 (h) | 3.84 ± 0.28 | 1.78 ± 0.105 |
| Tmax (h) | 0.25 ± 0.019 | |
| Vss (liters/kg) | 7.38 ± 0.49 | |
| F (%) | 25.50 ± 0.2 | |
Results are reported as the geometric mean values determined from three male mice. Mice were administered 10 mg/kg of GLS4. i.v., intravenous; po, per os; AUCINF, area under the plasma concentration-time curve from time zero extrapolated to infinity; AUClast, area under the plasma concentration-time curve from time zero to the time of the last quantifiable concentration; CL, plasma clearance; Cmax, maximum observed concentration in plasma; MRTINF, mean residence time; Vss, apparent volume of distribution; F, bioavailability.
In toxicity studies, treatment with GLS4 resulted in a slower-than-expected increase in body weight, reduced food consumption, decreased albumin, and decreased ratio of albumin to globulin by the end of the treatment period, but these mild toxicities were gone by 2 weeks after the end of treatment. The no-observed-adverse-effect level (NOAEL) was 35.7 mg/kg (equal to 30 mg/kg of GLS4; AUC0-24 = 687.16 h · ng/ml). By the end of the time off drugs, no drug or metabolite accumulation was observed. These and other toxicity measurements are presented in Table 2.
Table 2.
Summary of dose-dependent GLS4 toxicity at the end of treatment
| Parameter | Result at dose (mg/kg/day) ofa: |
||
|---|---|---|---|
| 30 | 100 | 300 | |
| Clinical signs | — | — | — |
| Body wt | — | 5 to ∼7% decreased body wt vs vehicle control | 3 to ∼11% decreased body wt vs vehicle control |
| Food consumption | — | A decrease in food consumption (−7% vs vehicle control) occurred in weeks 2 and 4. | A decrease in food consumption (−7 to ∼−17% vs vehicle control) occurred. |
| Clinical chemistry | — | Decreased A/Gb (−11% vs vehicle control) and albumin (−11% vs vehicle control). A/G ratio reversed after recovery. | Decreased A/G(−11% vs. vehicle control) and albumin (−8% vs vehicle control). A/G ratio reversed after recovery. |
| Organ weight; histopathology | — | — | — |
—, no difference compared to controls. Based on the presence of only nonadverse effects on body weights, food consumption, and clinical chemistry in the mid-dose and high-dose groups, the NOAEL was 30 mg/kg/day.
A/G, ratio of albumin to globulin.
Evaluation of GLS4 in vivo.
To characterize GLS4 in vivo, nude mice were subcutaneously inoculated with HepAD38 cells, and when viremia developed, they were fed with TET in their drinking water for 2 weeks, then treated with carrier (without drug) for 2 weeks, and then observed until the end of week 5 (two more weeks). During weeks 0 and 1, the virus titer remained depressed in all but one mouse, even though tumors were growing in all. Once mice were taken off TET, there was an increase in average virus titer of >3 log10 over the next 30 days (Fig. 6A). The data displayed in Fig. 6A were based upon normalization to the DNA levels for each mouse that were detected at the end of TET treatment (where the value was set as 1.0). Thus, virus levels increased once TET was removed from the drinking water.
Fig 6.

(A) Ratios of virus DNA titers in mice fed TET for weeks 0 and 1, followed by 2 weeks of carrier (without drug), and then 2 weeks without carrier. (B to F) Ratios of virus DNA titers in mice fed TET for weeks 0 and 1, followed by 2 weeks of GLS4 at 3.75 (B), 7.5 (C), 15 (D), 30 (E), or 60 (F) mg/kg per day, followed by two additional weeks off drug. The same protocol was followed using BAY 41-4109 at 60 mg/kg per day (G) or lamivudine at 100 mg/kg per day (H). Each line represents the values for a single mouse. The data for these graphs are the ratio of virus titer in successive serum samples where the sample obtained at week one is set as 1.
In the experiment whose results are shown in Fig. 6B to F, mice were treated with increasing doses of GLS4. There was a dose-dependent reduction of HBV DNA levels in the serum of most mice with increasing drug dose. When the average titers of HBV DNA were compared over the various drug doses from the end of week 1 (when TET was removed) to the end of week 3 (when drug was removed), it was found that virus titers had increased 83.5-fold in mice treated with 3.75 mg/kg per day of GLS4, 28.3-fold among mice treated with 7.5 mg/kg per day, but only 3- to 6-fold among mice treated with the higher doses of GLS4. In comparison, there was an average 5.8-fold increase in HBV DNA ratio among mice treated with BAY 41-4109 (at 60 mg/kg per day) (Fig. 6G), suggesting that BAY 41-4109 suppressed the virus replication cycle to an extent similar to that of GLS4 at the same concentration by the end of week 5. In contrast, mice treated with lamivudine at a dose used in the clinic showed a 154.4-fold increase in virus titer within 2 weeks following the end of therapy (Fig. 6H). When the ratios of HBV DNA were compared at the end of week 3 (end of drug treatment) to the end of week 5 (end of rebound period), there was generally an inverse relationship between GLS4 dose and virus titer, with the greatest rebound seen in mice treated with 3.75 mg/kg per day of GLS4 (540-fold) and the smallest rebound in mice treated with 60 mg/kg per day (23-fold) (P < 0.001). The latter was comparable to that seen in BAY 41-4109-treated mice (12.2-fold increase; P < 0.01) (Fig. 6G) and was better than that observed with lamivudine (155.6-fold increase; P < 0.05) (Fig. 6H). Thus, termination of GLS4 treatment (at >15 mg/kg per day) resulted in a slower virus rebound than in mice treated with lamivudine, suggesting that the effects of high doses of GLS4 persisted for at least 2 weeks after the end of therapy.
The results in Fig. 6 were then analyzed statistically; results are shown in Tables 3 and 4. When the mean virus titers at the end of week 3 (the end of drug treatment) were compared in mice treated with carrier versus drug, highly significant suppression of the virus replication cycle was observed at 15, 30, and 60 mg/kg per day of GLS4 (Table 3). The dose of 7.5 mg/kg per day showed smaller but significant differences, while the lowest dose of GLS4 was not effective. As expected, BAY 41-4109 and lamivudine were effective. For virus rebound, sustained suppression was observed in mice treated with 30 and 60 mg/kg per day of GSL4, to a marginal extent with 15 mg/kg per day, and not at all with the two lower doses (Table 4). As expected, BAY 41-4109 prevented virus rebound, while lamivudine did not. Thus, the GLS4 doses of >7.5 mg/kg per day significantly suppressed the virus replication cycle throughout the treatment period, while GLS4 doses of >15 mg/kg per day suppressed virus for up to 2 weeks after the end of treatment.
Table 3.
Probability of antiviral activity persisting at the end of treatmenta
| Treatment | P value (Student's t test, wk 3 vs wk 3) | Virus DNA suppression in serum (avg fold) |
|---|---|---|
| GLS4 (mg/kg per day) | ||
| 3.75 | >0.6 | 1.29 |
| 7.5 | <0.02 | 0.24 |
| 15 | <0.005 | 0.06 |
| 30 | <0.005 | 0.05 |
| 60 | <0.001 | 0.09 |
| BAY 41-4109 | <0.005 | 0.08 |
| Lamivudine | <0.001 | 0.02 |
The virus suppression due to treatment is calculated as the average titer of virus at week 3 for each treated group divided by the average titer of virus at week 3 for the group treated only with carrier. The lower the ratio, the greater the suppression of virus in week 3 compared to carrier-treated mice at the same time point. Results are based upon a one-tailed t test. The standard deviation is within 18% of the reported values for DNA suppression.
Table 4.
Probability of virus rebound 2 weeks after the end of treatmenta
| Treatment | P value (Student's t test, wk 3 vs wk 5) | Virus rebound (avg fold increase) |
|---|---|---|
| TET only | <0.020 | 98.6 |
| Carrier | <0.010 | 102.3 |
| GLS4 (mg/kg per day) | ||
| 3.75 | <0.020 | 66.5 |
| 7.5 | <0.010 | 51.8 |
| 15 | >0.050 | 6.77 |
| 30 | >0.100 | 5.7 |
| 60 | >0.200 | 3.7 |
| BAY 41-4109 | >0.300 | 2.1 |
| Lamivudine | 0.010 | 166.9 |
The virus rebound is calculated as the average titer of virus at week 5 divided by the average titer of virus at week 3 for each group. The higher the ratio, the greater the rebound of virus in week 5 compared to week 3. Results are based upon a one-tailed t test. The standard deviation is within 15% of the reported values for virus rebound.
Toxicity of GLS4 in vivo.
Drug toxicity was assessed using several criteria. First, there were no significant changes in the mean ALT levels in both control compared to test mice throughout the duration of these experiments (Fig. 7A). Second, when the weights of mice in the various groups were determined for the entire experiment, no significant changes were found to have occurred. Third, when the wet weights of the tumors were subtracted from the total body weight of each animal (obtained at the end of the experiment for all groups), the overall body weight of each mouse decreased slightly (Fig. 7B). Fourth, to determine whether GLS4 had an impact upon tumor growth, tumors were recovered from each mouse at the end of the experiment, and their wet weights were determined. There were no statistical differences in the mean tumor size for any paired comparisons (P > 0.25) (Fig. 7C). Thus, GLS4 appears to target the virus replication cycle and not the host cell, and even at high doses for 2 weeks, GLS4 is not overtly toxic.
Fig 7.
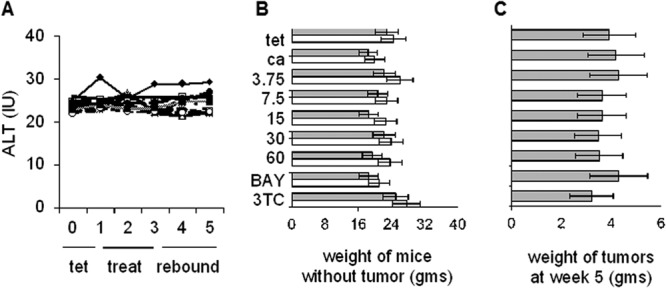
Toxicity of GLS4 in vivo. (A) ALT values were determined weekly for each group of test and control animals. No treatment (♦), carrier only (△), doses of 3.75 (○), 7.5 ( ), 15 (■), 30 (+), or 60 (−) mg/kg per day of GLS4, 100 mg/kg per day of lamivudine (—), and 60 mg/kg per day of BAY 41-4109 (●). (B) Average weight of mice in each group was determined at week 0 (white bars) and at week 5 (gray bars). Week 5 values were obtained following euthanasia and the removal of the tumor from each mouse. tet, tetracycline only; ca, carrier only; 3.75 through 60, GLS4 concentrations used in different groups; BAY, BAY 41-4109 (60 mg/kg per day); 3TC, lamivudine (100 mg/kg per day). (C) Wet weights of tumors for each group of mice. Only one tumor nodule, at the site of injection, was recovered from each mouse. The magnitude of each bar is the average weight of the corresponding tumors in each group. Error bars indicate standard deviation based upon the mean value at each data point. Panels B and C show the mean weights of mice (B) and tumors (C), where each treated or control group shown consisted of 10 mice.
HBc expression in GLS4-treated mice.
Since GLS4 targets core particle assembly and stability, HBc polypeptide levels were assessed at the end of treatment (week 3) and at the end of the rebound period (week 5). For this work, several mice treated with GLS4 (60 mg/kg per day) were euthanized at the end of week 3 or at the end of week 5. Western blotting showed that tumors at the end of treatment had at least 4-fold-lower levels of HBc polypeptide relative to tumors obtained from animals sacrificed at the end of week 5 (P < 0.005) (Fig. 8). These results are consistent with those of PCR described above, in which GLS4 suppressed virus DNA titers in treated animals.
Fig 8.
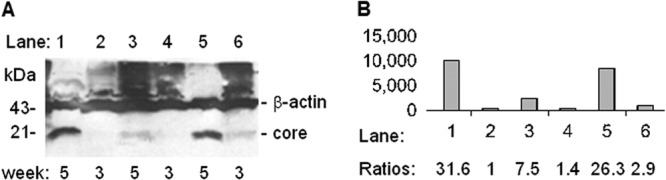
Western blot of core polypeptide (at 21 kDa) from HepAD38 tumors. (A) The levels of core were determined at the end of treatment with 60 mg/kg per day of GLS4 in three different mice (week 3; lanes 2, 4, and 6) and compared to the levels of core in three other mice that were treated the same way at the end of week 5 (lanes 1, 3, and 5). Signals were normalized to β-actin. (B) The core band in panel A was quantified by gel scanning. The extent of core suppression was expressed as ratios by assigning the signal in lane 2 (the lowest signal) as 1.0. The results shown here are representative of two independent experiments with tumors from different mice.
HBc expression in tumors was also assayed by immunohistochemistry. In Fig. 9A and C, HBc staining showed strong nuclear and weaker cytoplasmic staining in tumors collected from mice at the end of the virus rebound period (week 5). Tumors stained with IgG (Fig. 9B) and mouse livers stained with anti-HBc (Fig. 9D) were uniformly negative. HBc staining was much weaker and scattered in tumors obtained at the end of drug treatment (week 3) (Fig. 9E) compared to the end of the rebound period (week 5) (Fig. 9A and C). Most tumors had undifferentiated morphology with little or no necrosis or inflammation. Further, all liver tissues examined from mice transplanted with HepAD38 cells had normal histology, suggesting that GLS4 was not toxic to the liver. These results further support the hypothesis that GLS4 is active against HBV in vivo without overt toxicity.
Fig 9.

Immunostaining for core (HBc) in the tumors of nude mice injected with HepAD38 cells. (A and B) Tumor from a mouse treated with drug carrier. The mouse was euthanized at the end of week 5, and the tumor was removed, fixed, and then stained with anti-HBc (magnification, ×100) (A) or normal IgG (magnification, ×100) (B). (C) Tumor from another mouse from the same group as panel A stained with anti-HBc (magnification, ×200). (D) Liver from an HepAD38 tumor-bearing animal stained with anti-HBc (magnification, ×200). (E) Staining for HBc in tumor excised from a mouse treated with 60 mg/kg per day of GLS4 at the end of treatment (week 3).
DISCUSSION
This study was conducted to examine the efficacy of GLS4 compared to that of the prototype, BAY 41-4109 (Fig. 1A), against HBV. In vitro work showed that GLS4 was nontoxic (up to 25 μM) in primary human hepatocytes (Fig. 1B). This suggested that GLS4 may be suitable for longer-term studies in other models of chronic hepatitis B, including application in human clinical trials. GLS4 showed more potent antiviral activity in vitro than BAY 41-4109 at concentrations ranging from 25 to 100 nM by suppressing the accumulation of virus in the cell culture medium of HepAD38 cells (Fig. 2). This suggests that GLS4 may be used at lower concentrations than BAY 41-4109 to achieve the same antiviral effect. Analogous results were obtained with intracellular HBV replicative forms, where GLS4 was more potent than BAY 41-4109 and lamivudine (Fig. 3). GLS4 was active within the nanomolar range (Fig. 2 and 3), suggesting that it demonstrated antiviral activity at levels far below those associated with toxicity. Reduction in the levels of replicative forms, including cccDNA (Fig. 3), showed that high doses of GLS4, BAY 41-4109, and lamivudine inhibited the virus replication cycle, and not just virus secretion. These observations are consistent with the data showing that core particles may mature into virions or may be recycled into the nucleus to replenish the pool of cccDNA (38) and that if this cycle is disrupted, the pool of cccDNA may be depleted. Since there are no drugs that presently target cccDNA, sustained depletion of this pool of molecules may result in the permanent termination of HBV replication. The reduced levels of core following treatment with GLS4 or BAY 41-4109 (Fig. 4) confirmed that these drugs target HBV core protein. Further, inhibition of HBV replication results in aberrant core polypeptide polymerization, as demonstrated by SEC, TEM, DLS, and AFM (Fig. 5). Thus, it seems plausible that combination therapies consisting of a capsid inhibitor and one or more nucleoside analogs may cure or provide long-term control of replication among chronically infected patients. The observation that sustained virus replication is also associated with progressive chronic liver disease and the appearance of HCC (5, 6) also provides a rationale for the further development of capsid inhibitors that may help to bring about resolution of CLD and reduced incidences of cirrhosis and HCC.
Prior work has shown that GLS4 has activity against HBV core particles in vitro (26), and while the present study confirmed these results, it also suggested that GLS4 may be less toxic (Fig. 1) and more potent than BAY 41-4109 in vitro (Fig. 2 and 3). However, HepAD38 cells are considerably more sensitive to toxicity in the presence of GLS4 than HepG2.2.15 cells. While the protocol and assays used to measure cell viability were the same, and both studies used HepG2 cells, the levels of HBV DNA replication were low in HepG2.2.15 compared to HepAD38 cells (20, 39). In addition, different clones of HepG2 cells have been propagated for many years in different labs, and this may also account for the differences observed here. Given these differences, an advantage in using the HepAD38 cells is that cccDNA was easily seen (Fig. 3E) in this study, compared to HepG2.2.15 cells (20), so that the impact of drugs upon this important replication template could be more readily assessed. This will be especially important in assessing sustained antiviral effects of capsid inhibitors with nucleoside analogs in different combinations.
With regard to intracellular levels of core protein, there was an inverse relationship between the concentration of GLS4 or BAY 41-4109 and the intracellular levels of core polypeptide (Fig. 4). These observations confirm those made with HepG2.2.15 cells (26). However, while both drugs result in aberrant core particles, exposure of Cp149 to increasing concentrations of GLS4 yielded larger-than-average core particle sizes at high concentrations (e.g., 20 μM GLS4), which is similar to that previously reported (26), but BAY 41-4109 yielded larger aberrant cores at lower concentrations (Fig. 5). BAY 41-4109 and other molecules in the same class bind stoichiometrically to capsid protein polymers but not to free protein (40), and it is assumed that GLS4 acts the same way. However, since the kinetics of binding with other capsid inhibitors correlates with their antiviral activity (40), this may explain the differences in aberrant core particle sizes observed in Fig. 5 for each drug.
Although several features of GLS4 resulting from in vitro characterization suggest that it may be more potent and less toxic than BAY 41-4109, in vivo characterization showed that the two compounds were very similar. Both compounds demonstrated antiviral activity after the end of treatment (Tables 3 and 4 and Fig. 6), with little evidence of hepatotoxicity or overall toxicity to the mice (Fig. 7). The two drugs also diminished the steady-state levels of core polypeptide to similar extents in vitro (Fig. 4) and were likewise active against core in vivo (Fig. 8 and 9) (24). Given that HBV replication occurs in immature core particles within the cytoplasm of infected cells (8, 9), it is likely that the dose-dependent decrease in HBV replication upon treatment with GLS4 in vivo is associated with diminished formation of replication complexes (Fig. 6, 8, and 9). However, the advantages of GLS4 over BAY 41-4109 seen in vitro may be subtle and may have little impact upon the eventual clinical efficacy of one drug over the other. This is reflected in the similar selective index values for the two compounds. Efforts to develop compounds in this class that disrupt normal core particle assembly should continue because it is likely that they will eventually be incorporated into drug cocktails that will help to effectively treat patients with chronic hepatitis B.
The importance of further developing GLS4, and perhaps additional antiviral compounds to target virus-encoded proteins other than the polymerase, will likely result in the establishment of combination therapies that will limit the appearance of virus resistance during chronic infection. This is because drug resistance is less likely to arise from combination therapies in which drugs are developed against more than one virus target. Combination therapies including BAY 41-4109 and GLS4 may also reduce the risk of HCC, since persistent virus replication is a risk factor for liver disease progression, end-stage liver disease (cirrhosis), and liver cancer (5, 6). HCC is the fifth most frequent cancer worldwide and is the third leading cause of cancer deaths (41). There are few treatments that can help these patients (42–45), although the recent introduction of the multikinase inhibitor sorafenib has extended the life span of patients by several months (46–48). Thus, the further development of these capsid inhibitors may slow down the progression of chronic liver disease and reduce the frequency of HCC.
ACKNOWLEDGMENTS
This work was supported by Public Health Service grant AI076535 from the National Institute of Allergy and Infectious Diseases and by a grant provided by HEC to MF. This work was also supported by the National Science Foundation of China (81272642), the National Science Foundation for Young Scholars of China (81000674), Fundamental Research Funds for the Central Universities (10120110040), and Natural Science Foundation of Guangdong Province, China (S2011010004729).
Part of this work was funded by Sunshine Lake Pharma Co., Ltd. (HEC), which also provided the drugs for the present study.
Footnotes
Published ahead of print 19 August 2013
REFERENCES
- 1.Tiollais P, Pourcel C, Dejean A. 1985. The hepatitis B virus. Nature 317:489–495 [DOI] [PubMed] [Google Scholar]
- 2.Beasley RP, Hwang LY. 1984. Epidemiology of hepatocellular carcinoma, p 209–224 In Vyas GN, Dienstag JL, Hoofnagle JH. (ed), Viral hepatitis and liver disease. Grune and Stratton, Inc., New York, NY [Google Scholar]
- 3.Szmuness W. 1978. Hepatocellular carcinoma and HBV: evidence for a causal association. Prog. Med. Virol. 24:40–69 [PubMed] [Google Scholar]
- 4.Beasley RP, Hwang LY, Lin CC, Chien CS. 1981. Hepatocellular carcinoma and HBV. A prospective study of 22,707 men in Taiwan. Lancet ii:1129–1132 [DOI] [PubMed] [Google Scholar]
- 5.Chen CJ, Yang HI, Su J, Jen CL, You SL, Lu SN, Huang GT, Iloeje UH, for the REVEAL-HBV Study Group 2006. Risk of hepatocellular carcinoma across a biological gradient of serum hepatitis B virus DNA level. JAMA 295:65–73 [DOI] [PubMed] [Google Scholar]
- 6.Geier A, Gartung C, Dietrich CG. 2002. Hepatitis B e antigen and the risk of hepatocellular carcinoma. N. Engl. J. Med. 347:1721–1722 [DOI] [PubMed] [Google Scholar]
- 7.Bock CT, Schranz P, Schröder CH, Zentgraf H. 1994. Hepatitis B virus genome is organized into nucleosomes in the nucleus of the infected cell. Virus Genes 8:215–229 [DOI] [PubMed] [Google Scholar]
- 8.Mason WS, Aldrich C, Summers J, Taylor JM. 1982. Asymmetric replication of duck hepatitis B virus DNA in liver cells: free minus-strand DNA. Proc. Natl. Acad. Sci. U. S. A. 79:3997–4001 [DOI] [PMC free article] [PubMed] [Google Scholar]
- 9.Summers J, Mason WS. 1982. Replication of the genome of a hepatitis B-like virus by reverse transcription of an RNA intermediate. Cell 29:403–415 [DOI] [PubMed] [Google Scholar]
- 10.Bartenschlager R, Junker-Niepmann M, Schaller H. 1990. The P gene product of hepatitis B virus is required as a structural component for genomic RNA encapsidation. J. Virol. 64:5324–5332 [DOI] [PMC free article] [PubMed] [Google Scholar]
- 11.Weigand K, Knaust A, Schaller H. 2010. Assembly and export determine the intracellular distribution of hepatitis B virus core protein subunits. J. Gen. Virol. 91:59–67 [DOI] [PubMed] [Google Scholar]
- 12.Das A, Maini MK. 2010. Innate and adaptive immune responses in hepatitis B virus infection. Dig. Dis. 28:126–132 [DOI] [PubMed] [Google Scholar]
- 13.Asselah T, Lada O, Moucari R, Martinot M, Boyer N, Marcellin P. 2007. Interferon therapy for chronic hepatitis B. Clin. Liver Dis. 11:839–849 [DOI] [PubMed] [Google Scholar]
- 14.Min AD, Dienstag JL. 2007. Oral antivirals for chronic hepatitis B. Clin. Liver Dis. 11:851–868 [DOI] [PubMed] [Google Scholar]
- 15.Jacquard AC, Nassal N, Pichoud C, Ren S, Schultz U, Guerret S, Chevallier M, Werle B, Peyrol S, Jamard C, Rimsky LT, Trepo C, Zoulim F. 2004. Effect of a combination of clevudine and emtricitabine and adenovirus-mediated delivery of gamma interferon in the woodchuck model of hepatitis B virus infections. Antimicrob. Agents Chemother. 48:2683–2692 [DOI] [PMC free article] [PubMed] [Google Scholar]
- 16.Lim SG, Krastev Z, Ng TM, Mechkov G, Kotzev IA, Chan S, Mondou E, Snow A, Sorbel J, Rousseau F, for the FTCB-204 Study Group 2006. Randomized, double-blinded study of emtricitabine (FTC) plus clevudine versus FTC alone in treatment of chronic hepatitis B. Antimicrob. Agents Chemother. 50:1642–1648 [DOI] [PMC free article] [PubMed] [Google Scholar]
- 17.Feitelson MA, Clayton MM, Sun B, Schinazi RF. 2007. Development of a novel mouse model to evaluate drug candidates against hepatitis B virus. Antivir. Chem. Chemother. 18:213–223 [DOI] [PMC free article] [PubMed] [Google Scholar]
- 18.Jayaweera D, Dilanchian P. 2012. New therapeutic landscape of NNRTIs for treatment of HIV: a look at recent data. Expert Opin. Pharmacother 13:2601–2612 [DOI] [PubMed] [Google Scholar]
- 19.Deres K, Schröder CH, Paessens A, Goldmann S, Hacker HJ, Weber O, Krämer T, Niewöhner U, Pleiss U, Stoltefuss J, Graef E, Koletzki D, Masantschek RN, Reimann A, Jaeger R, Gross R, Beckermann B, Schlemmer KH, Haebich D, Rübsamen-Waigmann H. 2003. Inhibition of hepatitis B virus replication by drug-induced depletion of nucleocapsids. Science 299:893–896 [DOI] [PubMed] [Google Scholar]
- 20.Pan XB, Han JC, Wei L, Peng DD, Gao Y. 2008. Subcellular distribution and translocation of hepatitis B virus core protein in HepG2.2.15 cells. Zhonghua Gan Zang Bing Za Zhi 16:29–32 (In Chinese) [PubMed] [Google Scholar]
- 21.Wu GY, Zheng XJ, Yin CC, Jiang D, Zhu L, Liu Y, Wei L, Wang Y, Chen HS. 2008. Inhibition of hepatitis B virus replication by Bay 41-4109 and its association with nucleocapsid disassembly. J. Chemother. 20:458–467 [DOI] [PubMed] [Google Scholar]
- 22.Billioud G, Pichoud C, Puerstinger G, Neyts J, Zoulim F. 2011. The main hepatitis B virus (HBV) mutants resistant to nucleoside analogs are susceptible in vitro to non-nucleoside inhibitors of HBV replication. Antiviral Res. 92:271–276 [DOI] [PubMed] [Google Scholar]
- 23.Stray SJ, Zlotnick A. 2006. BAY 41-4109 has multiple effects on hepatitis B virus capsid assembly. J. Mol. Recognit. 19:542–548 [DOI] [PubMed] [Google Scholar]
- 24.Weber O, Schlemmer KH, Hartmann E, Hagelschuer I, Paessens A, Graef E, Deres K, Goldmann S, Niewoehner U, Stoltefuss J, Haebich D, Ruebsamen-Waigmann H, Wohlfeil S. 2002. Inhibition of human hepatitis B virus (HBV) by a novel non-nucleosidic compound in a transgenic mouse model. Antiviral Res. 54:69–78 [DOI] [PubMed] [Google Scholar]
- 25.Brezillon N, Brunelle MN, Massinet H, Giang E, Lamant C, DaSilva L, Berissi S, Belghiti J, Hannoun L, Puerstinger G, Wimmer E, Neyts J, Hantz O, Soussan P, Morosan S, Kremsdorf D. 2011. Antiviral activity of Bay 41-4109 on hepatitis B virus in humanized Alb-uPA/SCID mice. PLoS One 6:e25096. [DOI] [PMC free article] [PubMed] [Google Scholar]
- 26.Wang XY, Wei ZM, Wu GY, Wang JH, Zhang YJ, Li J, Zhang HH, Xie XW, Wang X, Wang ZH, Wei L, Wang Y, Chen HS. 2012. In vitro inhibition of HBV replication by a novel compound, GLS4, and its efficacy against adefovir-dipivoxil-resistant HBV mutations. Antivir. Ther. 17:793–803 [DOI] [PubMed] [Google Scholar]
- 27.Shi C, Wu CQ, Cao AM, Sheng HZ, Yan XZ, Liao MY. 2007. NMR-spectroscopy-based metabonomic approach to the analysis of Bay41-4109, a novel anti-HBV compound, induced hepatotoxicity in rats. Toxicol. Lett. 173:161–167 [DOI] [PubMed] [Google Scholar]
- 28.Hacker HJ, Deres K, Mildenberger M, Schroder CH. 2003. Antivirals interacting with hepatitis B virus core protein and core mutations may misdirect capsid assembly in a similar fashion. Biochem. Pharmacol. 66:2273–2279 [DOI] [PubMed] [Google Scholar]
- 29.Siegfried G, Jing L, Liu YS. November 2012. Bromo-phenyl substituted thiazolyl dihydropyrimidines. US patent application publication no. US 2012/0282221 A1
- 30.Ladner SK, Otto MJ, Barker CS, Zaifert K, Wang GH, Guo JT, Seeger C, King RW. 1997. Inducible expression of human hepatitis B virus (HBV) in stably transfected hepatoblastoma cells: a novel system for screening potential inhibitors of HBV replication. Antimicrob. Agents Chemother. 41:1715–1720 [DOI] [PMC free article] [PubMed] [Google Scholar]
- 31.Zhu Y, Curtis M, Qi X, Miller MD, Borroto-Esoda K. 2009. Anti-hepatitis B virus activity in vitro of combinations of tenofovir with nucleoside/nucleotide analogues. Antivir. Chem. Chemother. 19:165–176 [DOI] [PubMed] [Google Scholar]
- 32.Larkin J, Clayton MM, Sun B, Perchonock CE, Morgan JL, Siracusa LD, Michaels F, Feitelson MA. 1999. Hepatitis B virus transgenic SCID mouse model of chronic liver disease. Nat. Med. 5:907–912 [DOI] [PubMed] [Google Scholar]
- 33.Zlotnick A, Ceres P, Singh S, Johnson JM. 2002. A small molecule inhibits and misdirects assembly of hepatitis B virus capsids. J. Virol. 76:4848–4854 [DOI] [PMC free article] [PubMed] [Google Scholar]
- 34.Santos NC, Castanho MA. 1996. Teaching light scattering spectroscopy: the dimension and shape of tobacco mosaic virus. Biophys. J. 71:1641–1650 [DOI] [PMC free article] [PubMed] [Google Scholar]
- 35.Chen H, Lü JH, Liang WQ, Huang YH, Zhang WJ, Zhang DB. 2004. Purification of the recombinant hepatitis B virus core antigen (rHBcAg) produced in the yeast Saccharomyces cerevisiae and comparative observation of its particles by transmission electron microscopy (TEM) and atomic force microscopy (AFM). Micron 35:311–318 [DOI] [PubMed] [Google Scholar]
- 36.Stray SJ, Bourne CR, Punna S, Lewis WG, Finn MG, Zlotnick A. 2005. A heteroaryldihydropyrimidine activates and can misdirect hepatitis B virus capsid assembly. Proc. Natl. Acad. Sci. U. S. A. 102:8138–8143 [DOI] [PMC free article] [PubMed] [Google Scholar]
- 37.Lian Z, Liu J, Li L, Li X, Clayton M, Wu MC, Wang HY, Arbuthnot P, Kew M, Feitelson MA. 2006. Enhanced cell survival of Hep3B cells by the hepatitis B x antigen effector, URG11, is associated with up-regulation of β-catenin. Hepatology 43:415–424 [DOI] [PubMed] [Google Scholar]
- 38.Summers J, Smith PM, Horwich AL. 1990. Hepadnavirus envelope proteins regulate covalently closed circular DNA amplification. J. Virol. 64:2819–2824 [DOI] [PMC free article] [PubMed] [Google Scholar]
- 39.Sells MA, Zelent AZ, Shvartsman M, Acs G. 1988. Replicative intermediates of hepatitis B virus in HepG2 cells that produce infectious virions. J. Virol. 62:2836–2844 [DOI] [PMC free article] [PubMed] [Google Scholar]
- 40.Li L, Chirapu SR, Finn MG, Zlotnick A. 2013. Phase diagrams map the properties of antiviral agents directed against hepatitis B virus core assembly. Antimicrob. Agents Chemother. 57:1505–1508 [DOI] [PMC free article] [PubMed] [Google Scholar]
- 41.Parkin DM, Bray F, Ferlay J, PIsani P. 2001. Estimating the world cancer burden: Globocan 2000. Int. J. Cancer 94:153–156 [DOI] [PubMed] [Google Scholar]
- 42.Broelsch CE, Frilling A, Malago M. 2004. Hepatoma—resection or transplantation. Surg. Clin. North Am. 84:495–511 [DOI] [PubMed] [Google Scholar]
- 43.de Wilt JHW, van Etten B. 2004. Isolated hepatic perfusion: experimental evidence and clinical utility. Surg. Clin. North Am. 84:627–642 [DOI] [PubMed] [Google Scholar]
- 44.Elias D, de Baere T, Sideris L, Ducreux M. 2004. Regional chemotherapeutic techniques for liver tumors: current knowledge and future directions. Surg. Clin. N. Am. 84:607–626 [DOI] [PubMed] [Google Scholar]
- 45.Nicholl MB, Bilchik AJ. 2008. Thermal ablation of hepatic malignancy: useful but still not optimal. Eur. J. Surg. Oncol. 34:318–323 [DOI] [PubMed] [Google Scholar]
- 46.Strumberg D. 2005. Preclinical and clinical development of the oral multikinase inhibitor sorafenib in cancer treatment. Drugs Today 41:773–784 [DOI] [PubMed] [Google Scholar]
- 47.Gollob JA, Wilhelm S, Carter C, Kelley SL. 2006. Role of raf kinase in cancer: therapeutic potential of targeting the Raf/MEK/ERK signal transduction pathway. Semin. Oncol. 33:392–406 [DOI] [PubMed] [Google Scholar]
- 48.Flaherty KT. 2007. Sorafenib: delivering a targeted drug to the right targets. Expert Rev. Anticancer Ther. 7:617–626 [DOI] [PubMed] [Google Scholar]