

Abstract
Cefazolin, a first-generation cephalosporin with activity against methicillin-susceptible Staphylococcus aureus and streptococci, is often used to treat lower limb infections caused by these pathogens. Antimicrobial penetration is often limited in these patients due to compromised vasculature. Therefore, we sought to evaluate the exposure profile of cefazolin in serum and tissue in patients with lower limb infections. An in vivo microdialysis catheter was inserted into the tissue near the margin of the wound and constantly perfused with lactated Ringer's solution. Steady-state serum and tissue samples were simultaneously collected over a dosing interval. Serum protein binding was also assessed. Serum concentrations were analyzed by noncompartmental analysis. Tissue concentrations were corrected for percent in vivo recovery by using the retrodialysis technique. Seven patients with a mean weight of 95.45 ± 18.51 kg and a mean age of 54 ± 19 years were enrolled. Six patients received 1 g every 8 h, and one patient received 2 g every 24 h due to acute kidney injury. The free area under the curve from 0 to 8 h (fAUC0–8) values for serum and wound were 48.0 ± 18.66 and 56.35 ± 41.17 μg · h/ml, respectively, for the patients receiving 1 g every 8 h. The fAUC0–24 values for serum and wound were 1,326.1 and 253.9 μg · h/ml, respectively, for the single patient receiving 2 g every 24 h. The mean tissue penetration ratio (tissue/serum fAUC ratio) was 1.06. These data suggest that the amount of time that free-drug concentrations remain above the MIC (fT>MIC) for cefazolin in wound tissue is adequate to treat patients with lower limb infections.
INTRODUCTION
A resulting complication of diseases such as diabetes, autoimmune disorders, or trauma, neuropathy is a common reason why patients develop foot wounds that become infected unknowingly (1, 2). Due to the lack of appropriate treatment, these ulcers can worsen rapidly and become extremely challenging to treat. Failure to eradicate the causative pathogen can lead to a worsening of the infection that often results in amputation. Many patients with these infections have compromised vasculature that limits antimicrobial disposition. Given that concentrations of antimicrobials in the blood are not always equivalent to concentrations at the site of infection, it is especially important to characterize exposures in tissue. An understanding of antimicrobial concentrations at the wound site can help determine if appropriate pharmacodynamic (PD) targets are achieved to ensure successful outcomes.
Given that Staphylococcus aureus is one of the most common pathogens isolated from lower-extremity wounds, antimicrobials with Gram-positive activity, such as cefazolin, are often administered empirically to patients (2). Cefazolin, a first-generation intravenous cephalosporin with activity against methicillin-susceptible S. aureus (MSSA) and streptococci, is commonly utilized in the hospital setting to treat lower limb infections. Standard dosing for patients with normal renal function is 1 g every 8 h. Depending on the degree of renal impairment, the interval and/or dose is reduced.
To measure antimicrobial concentrations in the wound tissue, a method known as in vivo microdialysis is used (3, 4). This technique allows for continuous measurement of concentrations in the tissue over an extended period of time (i.e., dosing interval), providing a very valuable representation of antimicrobial exposure. Quantification of drug concentrations in the interstitial tissue makes it possible to determine if appropriate pharmacodynamic targets are achieved at the site of infection. Here, we describe the tissue and serum exposures of cefazolin in 7 patients with active lower limb infections.
MATERIALS AND METHODS
Study protocol.
This was an open-label pharmacokinetic study of patients admitted to Hartford Hospital in Hartford, CT, with lower-extremity wound infections. The study protocol was reviewed and approved by the Institutional Review Board at Hartford Hospital. Written informed consent was obtained from all patients prior to participation in the study.
Patients.
Patients 18 years of age or older with lower-extremity wound infections requiring surgical debridement and defined as mild or moderate by the Infectious Diseases Society of America or as grade 2 or 3 by the International Consensus on the Diabetic Foot were considered for enrollment (2). Patients were excluded prior to enrollment if they had a hypersensitivity to anesthetics (lidocaine or lidocaine derivatives), were pregnant or breastfeeding, had no palpable pedal pulses, were likely to require multiple procedures during the study, or participated in another study of an investigational drug or device within the preceding 30 days.
Drug administration.
All patients received intravenous cefazolin for treatment of their lower limb infections. Cefazolin was administered intravenously through either a peripheral catheter placed in the arm or a peripherally inserted central catheter (PICC) as a 30- or 60-min infusion.
Microdialysis procedure.
The microdialysis procedure was performed as previously described (5, 6). Briefly, a local injection of a 0.5% lidocaine solution was administered prior to catheter insertion if the patient still had sensation present within the extremity. A microdialysis probe (CMA 60 or 63 microdialysis catheter; CMA Microdialysis AB, Solna, Sweden) with a membrane length of 30 mm and a molecular mass cutoff of 20 kDa was inserted under sterile conditions within 10 cm of the wound margin into the subcutaneous tissue, placing the semipermeable membrane within 5 cm of the wound. A microinfusion pump was connected (CMA 107 microdialysis pump; CMA Microdialysis AB, Solna, Sweden), and the catheter was flushed at a rate of 15 μl/min for 5 min and then continuously perfused with lactated Ringer's solution at a rate of 2 μl/min.
Sample collection.
Venous blood was collected at various time points from a either a peripheral intravenous catheter or PICC after a minimum of 4 doses (i.e., steady state). Blood samples were collected by using a 10-ml red-top BD Vacutainer (Becton, Dickinson and Company, Franklin Lakes, NJ). Blood samples were centrifuged (2,000 × g for 10 min), and the separated serum was immediately stored at −80°C until analysis.
Dialysate samples of approximately 120 μl were obtained from the microdialysis catheters at each of the corresponding blood sample time points. Dialysate samples were collected into 200-μl microvials (CMA Microdialysis AB, Solna, Sweden), which were then stored in amber polypropylene tubes and frozen at −80°C until analysis.
Microdialysis probe recovery: in vivo retrodialysis.
Microdialysis catheters were calibrated for each patient after sampling by using the in vivo retrodialysis technique. A 3,000-μg/ml stock solution (concentration of perfusate [Cperfusate]) of cefazolin was perfused through the tissue at 2 μl/min for 1 h and collected into a microvial. The amount recovery was calculated based on the concentration of the dialysate sample collected (Cdialysate) compared to the concentration of the stock solution by using the following equation: percent recovery in vivo = 100 − (100 × Cdialysate/Cperfusate).
Protein binding studies.
Protein binding studies were conducted in triplicate for each patient at various time points of the dosing interval. A blood sample was collected into a 10-ml red-top BD Vacutainer (Becton, Dickinson and Company, Franklin Lakes, NJ) at each of the time points and centrifuged (2,000 × g for 10 min) to obtain separated serum. Exactly 0.9 ml of serum was transferred into each regenerated cellulose 30-kDa-molecular-mass-cutoff ultrafiltration device (Centrifree centrifugal filters; Millipore Corporation, Billerica, MA) and centrifuged at 2,000 × g by using a fixed-angle rotor for 45 min at 10°C to obtain ultrafiltrate (Cultrafiltrate). An aliquot of serum was also retained at each corresponding time point for determination of the total drug concentration in serum (Cserum). Protein binding was calculated by using the following equation: percent protein binding = 100 − (100 × Cultrafiltrate/Cserum).
Analytical procedures.
Cefazolin concentrations in plasma and dialysate samples were determined by using a validated high-performance liquid chromatography (HPLC) assay that was developed using a previously reported assay at the Center for Anti-Infective Research & Development in Hartford, CT (7). The serum assay was linear over a range of 0.5 μg/ml to 50 μg/ml (r2 ≥ 0.9990). The mean interday coefficients of variation for high (40 μg/ml)- and low (1 μg/ml)-check samples were 4.53% and 5.15%, respectively. The mean intraday coefficients of variation were 3.6% and 3.4%, respectively. The dialysate assay was linear over a range of 0.1 to 50 μg/ml (r2 ≥ 0.9969). The mean interday coefficients of variation for high (40 μg/ml)- and low (0.2 μg/ml)-check samples were 5.60% and 5.77%, respectively. The mean intraday coefficients of variation were 5.3% and 2.7%, respectively.
Pharmacokinetic analysis. (i) Serum.
Total drug concentrations in serum were analyzed for each subject by noncompartmental analysis using WinNonlin software (version 5.3; Pharsight Corporation, Mountain View, CA). The maximum concentration (Cmax), area under the concentration-time profile for the dosing interval (AUC0→τ), half-life (t1/2), clearance (CL), and volume of distribution (V) were calculated for serum data. The Cmax was determined by visual inspection of the concentration-time profile. The AUC0→τ was calculated by using the linear-log trapezoidal method. The t1/2 was calculated as ln(2)/λz, where λz is the terminal elimination rate constant. The terminal elimination rate constant was estimated by linear regression analysis of the terminal portion of the concentration-time profile. Clearance was calculated as dose/AUC0→τ. The volume of distribution was calculated as dose/(λz × AUC0→τ). A mean of each individual's protein binding percentages was applied to each subject's total drug concentrations to determine free-drug concentrations.
(ii) Tissue.
Dialysate samples were corrected by using the in vivo recovery calculated for each patient's individual catheter by using the equation Ctissue = 100 × (Cdialysate/percent recovery in vivo), where Ctissue is the drug concentration in the interstitium. The Cmax for tissue was determined by visual inspection of the concentration-time profile. The AUC0→τ was calculated by using the linear-log trapezoidal rule. Each patient's penetration ratio was calculated by using the AUC0→τ from tissue (AUCtissue) and the free-drug AUC0→τ in serum (fAUCserum), according to the following equation: wound penetration ratio = AUCtissue/fAUCserum.
RESULTS
Patients.
A total of 7 patients were enrolled. Baseline characteristics for these patients are listed in Table 1 are presented as means ± standard deviations (SD) unless otherwise noted.
Table 1.
Patient characteristicsa
| Characteristic | Value for dosing group |
|
|---|---|---|
| 1 g q8h (n = 6) | 2 g q24h (n = 1) | |
| Mean age (yr) ± SD | 55 ± 19 | 50 |
| % of male patients (no. of male patients/total no. of patients) | 83.3 (5/6) | 100.0 (1/1) |
| % of patients of race (no. of patients of race/total no. of patients) | ||
| African American | 16.7 (1/6) | |
| Caucasian | 50.0 (3/6) | 100.0 (1/1) |
| Hispanic | 33.3 (2/6) | |
| Mean ht (cm) ± SD | 183.7 ± 3.8 | 182.9 |
| Mean wt (kg) ± SD | 95.5 ± 18.5 | 120.2 |
| Mean CrCl (ml/min) ± SD | 123.6 ± 54.1 | 15.8 |
| No. (%) of patients with diabetes (no. of patients with diabetes/total no. of patients) | 83.3 (5/6) | 100.0 (1/1) |
| Type 1 | 20.0 (1/5) | |
| Type 2 | 80.0 (4/5) | 100.0 (1/1) |
| Mean % HbA1c ± SD | 10.0 ± 3.7 | 13.9 |
| % Pedal pulses (no. of patients with pedal pulses/total no. of patients) | ||
| +1 | 50.0 (3/6) | 100.0 (1/1) |
| +2 | 33.3 (2/6) | |
| +3 | 16.7 (1/6) | |
| % of patients with PEDIS grade 3 (no. of patients with grade 3/total no. of patients)b | 80.0 (4/5) | 100.0 (1/1) |
q8h, every 8 h; CrCl, creatinine clearance.
PEDIS (perfusion, extent/size, depth/tissue loss, infection, and sensation) grade as defined by the International Consensus on the Diabetic Foot and calculated for 6 patients with diabetes (2).
Pharmacokinetic analysis. (i) Serum.
The mean pharmacokinetic parameters using total drug concentrations in serum at steady state are described in Table 2 and are presented as means ± SD. The mean total and free-drug concentration-time profiles of the 6 patients receiving 1 g every 8 h are shown in Fig. 1a. The total and free-drug concentration-time profile of the single patient who received 2 g every 24 h is shown in Fig. 1b. Protein binding was found to be linear over a range of concentrations for each patient.
Table 2.
Steady-state pharmacokinetics for cefazolin in serum and tissue samples
| Parameter | Mean value for treatment group ± SD |
|
|---|---|---|
| 1 g q8h (n = 6) | 2 g q24h (n = 1) | |
| Serum | ||
| V (liters/kg) | 0.17 ± 0.07 | 0.30 |
| CL (liters/h) | 3.72 ± 2.16 | 0.68 |
| t1/2 (h) | 3.51 ± 0.99 | 39.82 |
| CrCl (ml/min) | 123.57 ± 54.10 | 15.78 |
| Cmax[serum] (μg/ml) | 94.52 ± 30.33 | 196.83 |
| Cmin[serum] (μg/ml) | 15.04 ± 7.44 | 89.32 |
| ƒAUC0→τ[serum] (μg · h/ml) | 48.0 ± 18.7 | 1,326.1 |
| Protein binding (%) | 85.1 ± 6.0 | 54.9 ± 1.8 |
| Tissue | ||
| fCmin[tissue] (μg/ml) | 2.13 ± 1.64 | 5.17 |
| ƒAUC0→τ[tissue] (μg · h/ml) | 56.4 ± 41.2 | 253.9 |
Fig 1.
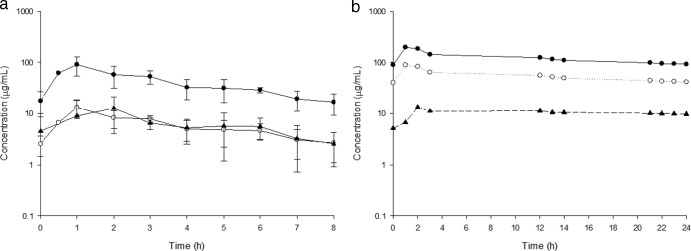
Mean cefazolin concentration-time profiles. (a) Concentration-time profile of patients receiving 1 g cefazolin every 8 h. (b) Concentration-time profile of a single patient receiving 2 g cefazolin every 24 h. Closed circles, total serum concentration; open circles, free serum concentration; closed triangles, tissue concentration.
(ii) Tissue.
The mean recovery rate for the microdialysis catheters was 68.6% ± 19.8% (range, 27.9% to 85.3%). The steady-state tissue concentration-time profiles are shown in Fig. 1. Cefazolin tissue concentrations remained above 1 μg/ml for 60% of the dosing interval for 1 patient and for 100% of the dosing interval for 5 patients receiving 1 g every 8 h. The single patient receiving 2 g every 24 h had tissue concentrations above 5 μg/ml throughout the 24-h period. The mean penetration of cefazolin into infected tissue for all patients was 1.06 ± 0.78.
DISCUSSION
Inadequate treatment of lower limb infections can lead to increased resistance, chronic infection, and, subsequently, amputation. These patients also have decreased blood flow to their extremities, which can make it difficult to achieve adequate PD targets at the site of infection, which is especially important. Similar to other cephalosporins, cefazolin displays time-dependent killing, and therefore, the PD driver of efficacy is the amount of time that free-drug concentrations remain above the MIC, also referred to as fT>MIC. For Gram-positive pathogens, a PD target of approximately 30 to 40% against S. aureus was previously identified in animal infection models (8–10). The simplest way to measure drug concentrations is via blood sampling; however, this does not always represent concentrations in the tissue containing the source of infection. Fortunately, techniques such as microdialysis make it possible to characterize concentrations at the wound site and determine whether appropriate PD targets are achieved (11). This study describes the determination of tissue concentrations of cefazolin in patients with lower limb infections via microdialysis.
The majority of patients included in this study were uncontrolled diabetics with elevated glycosylated hemoglobin (HbA1c) levels due to a long-standing history of noncompliance. Most patients had severe chronic foot wounds that were characterized as PEDIS (perfusion, extent/size, depth/tissue loss, infection, and sensation) grade 3, requiring surgical intervention such as debridement or amputation in addition to intravenous antibiotics. One of the seven patients did not have diabetes but did have significant neuropathy that resulted in his foot infection. While statistical comparisons were not made between the nondiabetic patient and the diabetic patients in this study due to the small numbers of patients, overall tissue concentrations in this patient were similar to those among the diabetic patients. Previous microdialysis studies with daptomycin compared tissue concentrations of diabetics to those of nondiabetics and reported similar observations, where tissue concentrations between the two populations were not significantly different (5).
Overall, free-cefazolin concentrations distributed adequately from serum into infected wound tissue, with a mean penetration ratio (fAUCtissue/fAUCserum) of 1.2 ± 0.74 (range, 0.70 to 2.68) and with tissue concentrations reaching a peak at around 2 h for the six patients receiving 1 g every 8 h. The tissue peak concentration was delayed by approximately 1 h compared with the serum peak concentration, suggesting that the rate of distribution into tissue is slightly delayed. The variability among patients can be explained by the differences in each person's individual pharmacokinetics as well as the estimation of microdialysis probe recovery. The single patient receiving 2 g every 24 h due to significant acute kidney injury had exceedingly high serum concentrations and a penetration ratio of 0.19. Despite a low penetration ratio, wound tissue concentrations for this patient remained above 5 μg/ml throughout the 24-h dosing interval, signifying adequate drug distribution to the site of infection. Tissue concentrations in other patients receiving 1 g every 8 h were above 1 μg/ml throughout the dosing interval for five of the six patients. One patient had tissue concentrations that remained above 1 μg/ml for 60% of the interval. The tissue concentrations observed in our patients appear sufficient given a recent surveillance study that reported MIC50/90 values of cefazolin against MSSA to be ≤0.5 and 1 μg/ml, respectively (12).
Previous studies of tissue penetration in patients receiving cefazolin have been conducted with other patient populations, namely, patients receiving cefazolin for surgical prophylaxis (13–15). A study by Hutschala et al., administering 4 g of cefazolin 60 min prior to skin incision and an additional 2 g during closure of the incision to cardiac surgical patients, used microdialysis to determine muscle and subcutaneous tissue concentrations (14). Those authors concluded that muscle and subcutaneous tissue concentrations remained well above the MIC90 of 1 μg/ml for S. aureus, a potential wound pathogen, for at least 10 h. While free plasma concentrations were not reported, it is likely, based on total plasma concentrations and approximate cefazolin protein binding of 80 to 85%, that free-drug concentrations in plasma were similar to the tissue concentrations observed (16, 17). Although the prophylaxis dosing scheme differs substantially from the standard dosing scheme for treatment administered to the patients in the current study, the overall findings of free-drug concentrations in plasma paralleling those in tissue are similar.
Another study by Douglas and colleagues of 12 patients undergoing open repair for abdominal aortic aneurysm who received 2 g of cefazolin 30 min prior to the first incision showed similar results with respect to penetration and tissue concentrations (15). The observed free plasma concentrations were similar to the observed tissue concentrations and resulted in an overall penetration ratio (fAUCtissue/fAUCplasma) of 0.85 despite reduced vascular perfusion due to peripheral vascular disease. These observations are similar to data in our study, with an observed penetration ratio of 1.06. While adequate penetration is important, tissue concentrations help to determine if appropriate PD targets are obtained. Douglas and colleagues noted that the tissue concentration observed remained at >2 μg/ml for over 7 h, indicating that the fT>MIC was sufficient. Lastly, the median protein binding observed in that study, 87% (range, 74 to 90%), is similar to the median protein binding of 85% observed for our patients.
Unlike the studies mentioned above, the patients in our study had an active presence of infection based on positive wound cultures and symptoms such as fever, leukocytosis, and swelling or erythema at the wound site. This is especially noteworthy as the presence of infection has been noted to change pharmacokinetics of antimicrobials in both humans and animal models (18, 19). Given that surgical prophylaxis patients were otherwise healthy, our data from infected patients provide valuable insight and different clinical applicabilities for treatment of patients with an active infection.
These data support the use of cefazolin for the treatment of lower limb infections, as the distribution of free-cefazolin concentrations into infected tissues was adequate in the patients studied here. Most importantly, pharmacodynamic targets at the site of infection for susceptible Gram-positive organisms such as S. aureus were obtained based on the absolute free-drug tissue concentrations observed.
ACKNOWLEDGMENTS
We thank Lee J. Steere for his efforts with intravenous therapy services and sample collection. Additionally, we thank Christina Sutherland for conducting all HPLC analyses. We acknowledge Kevin Connors, Shawn MacVane, and Jami Jain for their assistance with sample collection and processing.
Footnotes
Published ahead of print 16 September 2013
REFERENCES
- 1.Hobizal KB, Wukich DK. 2012. Diabetic foot infections: current concept review. Diabet. Foot Ankle 3:18409. 10.3402/dfa.v3i0.18409 [DOI] [PMC free article] [PubMed] [Google Scholar]
- 2.Lipsky BA, Berendt AR, Cornia PB, Pile JC, Peters EJG, Armstrong DG, Deery HG, Embil JM, Joseph WS, Karchmer AW, Pinzur MS, Senneville E. 2013. 2012 Infectious Diseases Society of America clinical practice guideline for the diagnosis and treatment of diabetic foot infections. J. Am. Podiatr. Med. Assoc. 103:2–7 [DOI] [PubMed] [Google Scholar]
- 3.de la Pena A, Liu P, Derendorf H. 2000. Microdialysis in peripheral tissues. Adv. Drug Deliv. Rev. 45:189–216 [DOI] [PubMed] [Google Scholar]
- 4.de Lange EC, de Boer AG, Breimer DD. 2000. Methodological issues in microdialysis sampling for pharmacokinetic studies. Adv. Drug Deliv. Rev. 45:125–148 [DOI] [PubMed] [Google Scholar]
- 5.Kim A, Suecof LA, Sutherland CA, Gao L, Kuti JL, Nicolau DP. 2008. In vivo microdialysis study of the penetration of daptomycin into soft tissues in diabetic versus healthy volunteers. Antimicrob. Agents Chemother. 52:3941–3946 [DOI] [PMC free article] [PubMed] [Google Scholar]
- 6.Bulik CC, Wiskirchen DE, Shepard A, Sutherland CA, Kuti JL, Nicolau DP. 2010. Tissue penetration and pharmacokinetics of tigecycline in diabetic patients with chronic wound infections described by using in vivo microdialysis. Antimicrob. Agents Chemother. 54:5209–5213 [DOI] [PMC free article] [PubMed] [Google Scholar]
- 7.Dudley MN, Nightingale CH, Drezner AD, Low HB, Quintiliani R. 1984. Comparative penetration of cefonicid and cefazolin into the atrial appendage and pericardial fluid of patients undergoing open-heart surgery. Antimicrob. Agents Chemother. 26:347–350 [DOI] [PMC free article] [PubMed] [Google Scholar]
- 8.Bhalodi AA, Crandon JL, Biek D, Nicolau DP. 2012. Efficacy of ceftaroline fosamil in a staphylococcal murine pneumonia model. Antimicrob. Agents Chemother. 56:6160–6165 [DOI] [PMC free article] [PubMed] [Google Scholar]
- 9.Craig WA. 1998. Pharmacokinetic/pharmacodynamic parameters: rationale for antibacterial dosing of mice and men. Clin. Infect. Dis. 26:1–10 [DOI] [PubMed] [Google Scholar]
- 10.Keel RA, Crandon JL, Nicolau DP. 2011. Efficacy of human simulated exposures of ceftaroline administered at 600 milligrams every 12 hours against phenotypically diverse Staphylococcus aureus isolates. Antimicrob. Agents Chemother. 55:4028–4032 [DOI] [PMC free article] [PubMed] [Google Scholar]
- 11.Joukhadar C, Muller M. 2005. Microdialysis: current applications in clinical pharmacokinetic studies and its potential role in the future. Clin. Pharmacokinet. 44:895–913 [DOI] [PubMed] [Google Scholar]
- 12.Zhanel GG, Adam HJ, Baxter M, Nichol K, Denisuik A, Lagace-Wiens P, Walkty A, Karlowsky JA, Schweizer F, Hoban DJ. 2012. Antimicrobial susceptibility of 27,123 pathogens isolated from patients in Canadian hospitals: CANWARD study 2007-2011, abstr C2-135 Abstr. 52nd Intersci. Conf. Antimicrob. Agents Chemother [Google Scholar]
- 13.Douglas A, Altukroni M, Udy AA, Roberts MS, Taraporewalla K, Jenkins J, Lipman J, Roberts JA. 2011. The pharmacokinetics of cefazolin in patients undergoing elective & semi-elective abdominal aortic aneurysm open repair surgery. BMC Anesthesiol. 11:5. 10.1186/1471-2253-11-5 [DOI] [PMC free article] [PubMed] [Google Scholar]
- 14.Hutschala D, Skhirtladze K, Kinstner C, Mayer-Helm B, Muller M, Wolner E, Tschernko EM. 2007. In vivo microdialysis to measure antibiotic penetration into soft tissue during cardiac surgery. Ann. Thorac. Surg. 84:1605–1610 [DOI] [PubMed] [Google Scholar]
- 15.Douglas A, Udy AA, Wallis SC, Jarrett P, Stuart J, Lassig-Smith M, Deans R, Roberts MS, Taraporewalla K, Jenkins J, Medley G, Lipman J, Roberts JA. 2011. Plasma and tissue pharmacokinetics of cefazolin in patients undergoing elective and semielective abdominal aortic aneurysm open repair surgery. Antimicrob. Agents Chemother. 55:5238–5242 [DOI] [PMC free article] [PubMed] [Google Scholar]
- 16.Kirby WM, Regamey C. 1973. Pharmacokinetics of cefazolin compared with four other cephalosporins. J. Infect. Dis. 128(Suppl):S341–S346. 10.1093/infdis/128.Supplement_2.S341 [DOI] [PubMed] [Google Scholar]
- 17.Vella-Brincat JW, Begg EJ, Kirkpatrick CM, Zhang M, Chambers ST, Gallagher K. 2007. Protein binding of cefazolin is saturable in vivo both between and within patients. Br. J. Clin. Pharmacol. 63:753–757 [DOI] [PMC free article] [PubMed] [Google Scholar]
- 18.Keel RA, Crandon JL, Nicolau DP. 2012. Pharmacokinetics and pulmonary disposition of tedizolid and linezolid in a murine pneumonia model under variable conditions. Antimicrob. Agents Chemother. 56:3420–3422 [DOI] [PMC free article] [PubMed] [Google Scholar]
- 19.Kuti JL, Nicolau DP. 2012. Levofloxacin penetration into epithelial lining fluid differs between infected and uninfected patients, abstr A-1964 Abstr. 52nd Intersci. Conf. Antimicrob. Agents Chemother [Google Scholar]