

Abstract
Invasive aspergillosis and candidemia are important causes of morbidity and mortality in immunocompromised and critically ill patients. The triazoles voriconazole, fluconazole, and posaconazole are widely used for the treatment and prophylaxis of these fungal infections. Due to the variability of the pharmacokinetics of the triazoles among and within individual patients, therapeutic drug monitoring is important for optimizing the efficacy and safety of antifungal treatment. A dried blood spot (DBS) analysis was developed and was clinically validated for voriconazole, fluconazole, and posaconazole in 28 patients. Furthermore, a questionnaire was administered to evaluate the patients' opinions of the sampling method. The DBS analytical method showed linearity over the concentration range measured for all triazoles. Results for accuracy and precision were within accepted ranges; samples were stable at room temperature for at least 12 days; and different hematocrit values and blood spot volumes had no significant influence. The ratio of the drug concentration in DBS samples to that in plasma was 1.0 for voriconazole and fluconazole and 0.9 for posaconazole. Sixty percent of the patients preferred DBS analysis as a sampling method; 15% preferred venous blood sampling; and 25% had no preferred method. There was significantly less perception of pain with the DBS sampling method (P = 0.021). In conclusion, DBS analysis is a reliable alternative to venous blood sampling and can be used for therapeutic drug monitoring of voriconazole, fluconazole, and posaconazole. Patients were satisfied with DBS sampling and had less pain than with venous sampling. Most patients preferred DBS sampling to venous blood sampling.
INTRODUCTION
Invasive aspergillosis and candidemia are important causes of morbidity and mortality in immunocompromised and critically ill patients (1–3) and are associated with prolonged hospital stays and increased costs (2–5). Prompt initiation of antifungal therapy at the appropriate dose is required to improve outcomes in patients with invasive aspergillosis and candidemia (6–8). The triazoles fluconazole, voriconazole, and posaconazole are widely used for the treatment and prophylaxis of these fungal infections and are recommended as primary treatment by the Infectious Diseases Society of America (IDSA) (1, 9).
Due to the variability of the pharmacokinetics of the triazoles among and within individual patients, therapeutic drug monitoring (TDM) has been recommended by the IDSA to optimize the efficacy and safety of the antifungal treatment (1, 6, 9). Changes in clinical condition (e.g., hepatic and renal function), problems with absorption of the drug (posaconazole), nonlinear pharmacokinetics (voriconazole), and drug-drug interactions can all contribute to the variability of pharmacokinetics (1, 6, 9–13). For voriconazole, trough concentrations in the range of 1.5 to 5 μg/ml are important for the prevention of treatment failure and toxicity (14–16). For posaconazole, concentrations of at least 0.7 μg/ml for prophylaxis and 1.5 μg/ml for treatment are advised (17–20). For adequate exposure to fluconazole, an area under the concentration-time curve (AUC) of 400 mg·h/liter is required (21–24). Itraconazole concentrations must be at least 0.5 μg/ml for prophylaxis and 1 μg/ml for adequate therapy (6, 25, 26).
To extend the possibilities of TDM for patients at home and for hospitals without an advanced bioanalytical infrastructure, dried blood spot (DBS) sampling, using a finger prick instead of a venous blood sample, would be helpful. DBS analysis for TDM has been demonstrated previously for other drugs used in infectious diseases, such as anti-HIV, antimalaria, and antituberculosis drugs (27–30). DBS analysis has several advantages, including a less-invasive sampling procedure, a smaller sampling volume, simpler storage and transfer of samples at room temperature, and no biohazard risk during the shipment of samples (31–33). The purpose of this research was to develop and clinically validate a DBS analysis for voriconazole, fluconazole, and posaconazole, and to evaluate the patients' opinions on the sampling method.
MATERIALS AND METHODS
Patients and sampling.
From June 2012 to January 2013, patients receiving antifungal therapy with one of the triazoles were recruited from departments and outpatient clinics of the University Medical Center Groningen, Groningen, the Netherlands. Patients aged ≥18 years could participate if they were treated with voriconazole, fluconazole, or posaconazole, a steady-state concentration was achieved, and routine TDM was scheduled. Approval by the local ethics committee was not required, according to Dutch law, because plasma samples were collected for routine care and a noninvasive DBS sampling procedure was developed as an alternative to venous blood sampling in routine patient care. During implementation of the DBS analysis, patients were asked for consent at least 1 day before blood sampling was scheduled.
Venous blood and DBS trough samples were obtained before administration of the antifungal drug. DBS samples were obtained through a finger prick with a lancet puncture (BD Microtainer contact-activated lancet; 2.0 by 1.5 mm). The first drop of blood was wiped and discarded; after that, the blood was dropped directly onto a Whatman FTA DMPK-C paper card (GE Healthcare, the Netherlands). Venous dried blood spot (VDBS) samples were prepared by pipetting 50 μl of venous whole blood onto the paper cards. The remaining whole blood was centrifuged at 3,000 rpm for 5 min to obtain plasma, which was stored at −20°C until analysis. The DBS and VDBS samples were left to dry at room temperature for 3 h and were stored in sealed plastic bags with desiccant sachets at −20°C until analysis.
DBS method validation.
For analysis of the DBS, VDBS, calibration, and quality control (QC) samples of voriconazole and posaconazole, an 8-mm-diameter disc was punched out. For analysis of the fluconazole samples, a 3-mm-diameter disc was punched out. Extraction from the discs was performed by vortexing for 1 min and sonication for 10 min using 200 μl of extracting solvent for voriconazole and posaconazole and 500 μl of extracting solvent for fluconazole. Due to the strong signal of fluconazole with mass spectrometry (MS) and the larger concentration range (0.5 to 100 μg/ml for fluconazole; 0.1 to 10 μg/ml for voriconazole and posaconazole), a smaller punch size and a larger volume of extracting solvent were used for the extraction of fluconazole. The extracting solvent consisted of methanol-water (90:10, vol/vol), with 0.05 μg/ml cyanoimipramine as an internal standard. Afterwards, the samples were again vortexed for 1 min, after which the extract was transferred to a vial with an insert and was centrifuged at 11,000 rpm for 5 min. Subsequently, sample volumes of 5 μl were analyzed using a previously validated liquid chromatography-tandem MS (LC–MS-MS) method (34). Plasma samples were prepared and analyzed using the same LC–MS-MS method. The DBS analytical method was validated in accordance with Guidance for Industry: Bioanalytical Method Validation, by the U.S. Food and Drug Administration (35). DBS calibration and QC samples were prepared by pipetting 50 μl of spiked venous whole blood onto DBS paper. The linearity of the standard curve was assessed with 1/x2 weighting over a concentration range of 0.1 to 10 μg/ml for voriconazole and posaconazole and 0.5 to 100 μg/ml for fluconazole. Within-run and between-run accuracy and precision were evaluated for the QC samples at the lower limit of quantification (LLOQ) and at levels designated low, medium, and high, corresponding to concentrations of 0.1, 0.5, 4.0, and 8.0 μg/ml for voriconazole and posaconazole and 0.5, 5.0, 40, and 75 μg/ml for fluconazole. Each validation level was analyzed in quintuplicate, on 3 consecutive days. The degree of recovery was determined by comparing the extracts from spiked DBSs at low, medium, and high concentrations to extracts from blank DBSs subsequently spiked at low, medium, and high concentrations. Matrix effects were determined by comparing extracts from blank DBSs subsequently spiked at low, medium, and high concentrations with an extraction solvent (methanol-water [90:10, vol/vol]) spiked at low, medium, and high concentrations. Stability was assessed by storing low- and high-concentration DBS samples at room temperature (20°C), 37°C, 50°C, and −80°C for 12 days. Furthermore, the effects of the hematocrit value and the blood spot volume on accuracy and precision were assessed for hematocrit values of 25, 30, 35, 40, and 45% and for blood spot volumes of 30, 50, 70, and 90 μl for low- and high-concentration control samples. For the method validation, the hematocrit value was standardized at 35% and the blood spot volume at 50 μl.
Patient preference.
A questionnaire was developed to evaluate the patients' opinions on the sampling method. Patients filled in the questionnaire themselves after the DBS sampling. The questionnaire was based on previously published questionnaires on quality of life (36, 37) and consisted of general questions on age, gender, employment, frequency of TDM for the triazole used, experience with finger prick sampling, and questions on the venous and DBS sampling methods. Questions on the sampling methods included the ease of performance and duration of the DBS sampling, perception of pain for both methods, satisfaction with each sampling method, and the method preferred. Perception of pain was measured by scoring pain on the 11-point numerical rating scale, where 0 is absolutely no pain and 10 is unbearable pain (38).
Statistical analysis.
In the analytical method validation, bias was defined as the difference between the analytical result and the nominal concentration, expressed as a percentage. The DBS method was validated by comparing the concentrations of the drug in the DBS and VDBS with the concentration in plasma using Passing-Bablok regression and Bland-Altman analysis (with Analyse-it software, version 2.20). Fisher's exact test was used to evaluate the difference (expressed as a percentage) between subtherapeutic posaconazole concentrations in the DBS before and after the use of the conversion factor. For the evaluation of patient preference, answers on questions scored on a scale were expressed as means with standard deviations (SD). Answers on yes-or-no questions were expressed as the percentage of patients answering “yes.” The paired sample t test was used to compare means, and McNemar's test for paired data was used to evaluate the differences in satisfaction with the two sampling methods. Statistical analyses were performed using SPSS for Windows, version 20.0. A P value of <0.05 was considered statistically significant.
RESULTS
Patient demographics and dose characteristics.
Twenty-eight patients with a mean age of 54 years participated in the clinical evaluation of the DBS analysis. The baseline characteristics of the patients are shown in Table 1. Most patients received antifungal therapy for candidiasis (n = 9 [32.1%]) or (suspected) invasive aspergillosis (n = 7 [25.0%]). Other fungal infections were caused by Scedosporium prolificans, Hormographiella aspergillata, or Absidia corymbifera. Voriconazole was dosed at 150 to 400 mg twice daily and fluconazole at 150 to 200 mg once daily. Posaconazole dosages ranged from 300 to 400 mg twice daily to 200 mg 3 or 4 times a day.
Table 1.
Patient characteristics
| Characteristic | Valuea |
|---|---|
| Gender (male) | 19 (67.9) |
| Mean age (yr) (range) | 54 (19–67) |
| Underlying condition | |
| Hematological malignancy | 25 (89.3) |
| Lung transplantation | 2 (7.1) |
| Hemoptysis | 1 (3.6) |
| Fungal infection | |
| Candida albicans | 4 (14.3) |
| Candida glabrata | 2 (7.1) |
| Candida krusei | 2 (7.1) |
| Candida tropicalis | 1 (3.6) |
| Aspergillus fumigatus | 3 (10.7) |
| Suspected aspergillosis | 4 (14.3) |
| Other | 3 (10.7) |
| Prophylaxis | 9 (32.1) |
| Antifungal treatment | |
| Voriconazole | 10 (35.7) |
| Fluconazole | 10 (35.7) |
| Posaconazole | 8 (28.6) |
| Mean hematocrit (%) (range) | 34.7 (20.4–46.8) |
Unless otherwise indicated, the value is expressed as the number (percentage) of patients. The total number of patients was 28.
DBS method validation.
The DBS analytical method showed good linearity over the concentration range for all triazoles. The regression equations were 0.000219 + 0.373 × response for voriconazole, 0.00159 + 0.0141 × response for fluconazole, and 0.00245 + 0.0558 × response for posaconazole. The correlation coefficients (r2) were 0.997 for voriconazole, 0.993 for fluconazole, and 0.991 for posaconazole. The mean measured concentration was between 91.1 and 105.2% of the nominal concentration for all triazoles. Within-run and between-run coefficients of variation (CV) were between 5.6 and 10.8% and 0.0 and 13.1%, respectively, and well within the required range of <20% for the LLOQ level and <15% for the low-, medium-, and high-concentration levels. The level of recovery by extraction from the DBS and the bias caused by variable matrices were between 84.9 and 112.1% and between 89.4 and 109.5%, respectively, for all triazoles, and within the required range of 15%. Furthermore, samples were stable at room temperature (20°C), 37°C, 50°C, and −80°C for 12 days (−10.0 to 14.2%). The bias in hematocrit values of 25 to 45% ranged from −15.3 to 18.6%, compared with samples with a standardized hematocrit of 35%. The bias in blood spot volumes of 30 to 90 μl ranged from −13.2 to 14.8%, compared with samples with a standardized blood spot volume of 50 μl.
Clinical validation.
Thirty samples from 28 patients were included in the clinical validation of the DBS analysis (Table 2). The results of the Passing-Bablok regression between DBS and plasma samples are shown in Fig. 1. The slope of the regression line was 1.0 for voriconazole and fluconazole and 0.9 for posaconazole. To compensate for the difference between the concentrations of posaconazole in DBS and plasma samples, a conversion factor of 1.1 was used to calculate the corresponding concentration in plasma from the concentration in the DBS. With Bland-Altman analysis, the absolute difference between the concentrations in DBS and plasma samples versus the mean concentration in DBS and plasma samples was 0.0 (95% confidence interval [95% CI], −0.22 to 0.22) for voriconazole, −0.33 (95% CI, −0.55 to −0.11) for fluconazole, and −0.18 (95% CI, −0.26 to −0.09) for posaconazole. All values were within the 95% limits of agreement for voriconazole and posaconazole. For fluconazole, 10 out of 11 values were within the 95% limits of agreement, and all values were within the 99% limits of agreement. Passing-Bablok regression and Bland-Altman analysis of drug concentrations in VDBS versus plasma samples showed results similar to those for concentrations in DBS samples for all triazoles; all values were within the 95% limits of agreement (data not shown).
Table 2.
Concentrations of drugs in patient plasma, DBS, and VDBS samples
| Drug and sample | Concn (mg/liter) of drug in: |
||
|---|---|---|---|
| Plasma | DBS | VDBS | |
| Voriconazole | |||
| Sample 1 | 0.1 | 0.1 | 0.1 |
| Sample 2 | 0.4 | 0.5 | 0.5 |
| Sample 3 | 0.7 | 0.8 | 0.8 |
| Sample 4 | 1.0 | 1.3 | 1.2 |
| Sample 5 | 1.6 | 1.4 | 1.9 |
| Sample 6 | 1.6 | 1.5 | 2.0 |
| Sample 7 | 1.9 | 2.1 | 2.1 |
| Sample 8 | 2.5 | 2.9 | 3.0 |
| Sample 9 | 3.7 | 3.1 | |
| Sample 10 | 4.2 | 4.5 | 4.6 |
| Sample 11 | 9.9 | 9.4 | 10.7 |
| Fluconazole | |||
| Sample 1 | 2.8 | 2.5 | 2.8 |
| Sample 2 | 3.0 | 2.5 | 2.9 |
| Sample 3 | 3.0 | 3.1 | 2.9 |
| Sample 4 | 3.4 | 3.2 | 3.9 |
| Sample 5 | 3.9 | 3.2 | 3.6 |
| Sample 6 | 4.6 | 4.1 | 4.3 |
| Sample 7 | 4.7 | 4.4 | 5.2 |
| Sample 8 | 4.8 | 4.2 | 4.5 |
| Sample 9 | 5.7 | 6.1 | 5.8 |
| Sample 10 | 6.3 | 5.7 | 5.9 |
| Sample 11 | 6.9 | 6.5 | 6.0 |
| Posaconazole | |||
| Sample 1 | 0.2 | 0.1 | 0.1 |
| Sample 2 | 0.8 | 0.6 | 0.6 |
| Sample 3 | 0.8 | 0.7 | 0.8 |
| Sample 4 | 1.0 | 0.8 | 0.9 |
| Sample 5 | 1.1 | 0.8 | 0.9 |
| Sample 6 | 1.3 | 1.3 | 1.3 |
| Sample 7 | 2.1 | 1.8 | 1.8 |
| Sample 8 | 1.8 | 1.6 | |
Fig 1.
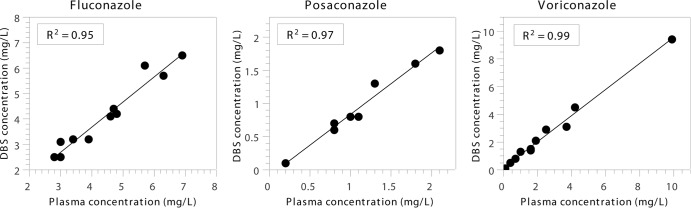
Clinical validation of DBS analysis by Passing-Bablok regression between drug concentrations in DBSs and plasma. For fluconazole (n = 11), the regression line has a slope of 0.98 (95% CI, 0.79 to 1.24) and an intercept of −0.23 (95% CI, −1.43 to 0.52). For posaconazole (n = 8), the regression line has a slope of 0.92 (95% CI, 0.67 to 1.14) and an intercept of −0.10 (95% CI, −0.33 to 0.15). For voriconazole (n = 11), the regression line has a slope of 1.0 (95% CI, 0.86 to 1.17) and an intercept of 0.10 (95% CI, −0.12 to 0.20).
The voriconazole concentration was subtherapeutic in 4 patients (40%), ranging from 0.1 to 1.0 μg/ml, and was considered toxic (9.9 μg/ml) in 1 patient (10%). Among patients receiving posaconazole for prophylaxis, 3 (75%) had a trough concentration in the therapeutic range (>0.7 μg/ml) and 1 (25%) had a trough concentration of 0.2 μg/ml. Among patients receiving posaconazole for treatment, the trough concentration was in the therapeutic range (>1.5 μg/ml) in 2 patients (50%) and ranged from 1.0 to 1.3 μg/ml in the other 2 patients (50%). Before the use of the conversion factor, the DBS posaconazole concentration was subtherapeutic in 4 patients (50%). After the conversion factor of 1.1 was introduced, the DBS posaconazole concentration was subtherapeutic in 3 patients (37.5%) (P = 0.071).
Patient preference.
Ten hospitalized patients and 10 patients from the outpatient clinic with a mean age of 55 years (range, 30 to 67 years) completed the questionnaire after the DBS sampling. Fifteen patients (75%) were male; 10 patients (50%) had paid employment; 6 patients (30%) were unemployed due to their illness; and 4 patients (20%) were unemployed due to other reasons, such as retirement. Most patients (60%) had no experience with blood sampling by a finger prick; 6 patients (30%) had experience with sampling by a finger prick due to diabetes; and 2 patients (10%) had experienced sampling by a finger prick by a nurse in the past. The average frequency of TDM for one of the triazoles was 1.9 (SD, 1.6) times a month. The results of the comparison of DBS sampling with venous blood sampling are shown in Table 3. Twelve patients (60%) preferred DBS analysis as a sampling method; 3 patients (15%) preferred venous blood sampling; and 5 patients (25%) had no preferred method. The perception of pain was significantly less for the DBS sampling method (patients gave DBS sampling a score of 1.4 on the 11-point numerical rating scale, compared to 2.1 for venous sampling [P = 0.021]).
Table 3.
Patients' opinions on the DBS and venous blood sampling methodsa
| Question | Valueb for: |
Pc | |
|---|---|---|---|
| Venous sampling | DBS sampling | ||
| Discomfort of traveling to hospital | 2.4 (1.5) | NA | |
| Hindrance to social activities | 1.3 (0.7) | 1.1 (0.3) | 0.331 |
| Hindrance to work activities | 1.5 (0.9) | 1.2 (0.7) | 0.309 |
| Perception of pain | 2.1 (2.0) | 1.4 (1.3) | 0.021 |
| Satisfaction with sampling method (% answering yes) | 80 | 90 | 0.375 |
| Sampling time (min) | NA | 4.4 (3.4) | |
| Hindrance to self-sampling DBS | NA | 2.3 (1.7) | |
| DBS sampling easy to carry out (% answering yes) | NA | 100 | |
| Advantage not traveling to hospital (% answering yes) | NA | 80 | |
Twenty patients filled out the questionnaire.
Values are mean scores (SD) except where otherwise indicated. On the scale of discomfort or hindrance, from 1 to 5, 1 is no hindrance and 5 is serious hindrance. On the 11-point numerical rating scale for the perception of pain, 0 is absolutely no pain and 10 is unbearable pain. NA, not applicable.
The paired sample t test was used to compare means, and the McNemar test for paired data was used to evaluate the difference in satisfaction with the two sampling methods.
DISCUSSION
A DBS analysis for voriconazole, fluconazole, and posaconazole was developed, clinically validated, and implemented in daily practice. The concentrations of all triazoles in DBS samples were in good agreement with those in plasma. Previous studies on DBS analysis showed that the hematocrit value and the blood spot volume may influence the analysis results for DBS samples (31–33, 39). For analysis of the triazoles, the hematocrit value and blood spot volume had only a minor influence. The mean hematocrit value in patients was 34.7%, which was in good agreement with the standardized hematocrit value of 35%. Concentrations of posaconazole in plasma were slightly higher than those in DBSs. This difference might be caused by a difference in protein binding, which is >98% for posaconazole (18), or the different distributions of the drug in whole blood and plasma, since the same difference was also observed between concentrations in VDBS and plasma samples (39). Although labeled isotopes are preferred as internal standards when mass spectrometry is used, with the use of cyanoimipramine as an internal standard, no ion suppression was observed during analysis of six lots of pooled human serum and the simultaneous direct infusion of a stock solution containing fluconazole, voriconazole, or posaconazole and cyanoimipramine (34). Itraconazole was not included in the method analysis, because itraconazole is rarely used due to hospital policy in favor of voriconazole and posaconazole for invasive aspergillosis and fluconazole for candidemia, in accordance with the IDSA guidelines (1, 9). However, a DBS analysis of itraconazole can be useful if the drug is used for treatment or prophylaxis (1, 6, 25, 26).
A method to simultaneously quantify triazoles in plasma spotted onto dry sample spot devices was developed previously (40). However, fluconazole was not included in this method, and validation was performed only with plasma spotted onto paper cards and not with patients' DBS samples. Differences in protein binding and in the distribution of a drug between whole blood and plasma can lead to different concentrations of the drug in whole blood and plasma. Furthermore, the concentration of a drug in capillary blood obtained by finger pricking is a mixture of venous and arterial blood and mimics arterial rather than venous sampling (39). Clinical validation with patients' DBS samples is therefore required to make sure that DBS samples can be used as a substitute for plasma samples. Finally, no evaluation of the patients' opinions was included.
Our evaluation of the patients' opinions of the sampling method showed that most patients preferred DBS sampling to venous blood sampling. Major advantages of DBS sampling were that patients experienced significantly less pain and did not have to travel to the hospital for blood sampling.
A limitation was that the questionnaire was not validated, although it was based on validated questionnaires. Since patients filled in the questionnaire themselves, and since it consisted of objective questions and scoring systems, we do not expect a large bias.
With DBS analysis, patients can obtain the DBS samples themselves. Previous studies with DBS analysis of antiretroviral and immunosuppressive drugs showed that 87.5 to 98% of the DBS samples obtained by patients were suitable for analysis (41, 42). Besides, when the samples are sent by mail, the physician already has the results of the analysis before the consultation. Furthermore, with DBS sampling, samples do not have to be obtained solely during office hours. DBS samples can be shipped to assigned hospitals for the determination of triazole concentrations, because these samples are stable at room temperature, and shipping them presents no biohazard risk (31–33). TDM of the triazoles can be performed frequently, and patients can receive prolonged courses of antifungal treatment for invasive or refractory fungal infections. Through self-sampling and mailing of DBS samples, the costs of personnel performing venous blood sampling, traveling costs for patients, and costs to patients due to loss of working days can be saved (31).
Although detection of subtherapeutic or toxic trough concentrations of drugs (which is important for the success rate of antifungal therapy) was not the aim of this research, the DBS analysis revealed such concentrations in 50.0% of the patients receiving voriconazole and in 37.5% of the patients receiving posaconazole. The results of the DBS analysis show the necessity and relevance of TDM for optimizing the efficacy and safety of antifungal treatment, especially over prolonged periods (14–18).
In conclusion, a DBS analysis was successfully developed and clinically validated for voriconazole, fluconazole, and posaconazole. Patients were satisfied with DBS sampling, and most patients preferred DBS sampling to venous blood sampling. Besides, patients had significantly less pain with DBS sampling. With this DBS analysis, the possibilities of TDM of the triazoles can be extended to patients at home and to hospitals without an advanced bioanalytical infrastructure.
ACKNOWLEDGMENTS
This work was financially supported by Merck Sharp & Dohme.
Voriconazole pure substance was kindly provided by Pfizer and posaconazole pure substance by Merck Sharp & Dohme.
Footnotes
Published ahead of print 29 July 2013
REFERENCES
- 1.Walsh TJ, Anaissie EJ, Denning DW, Herbrecht R, Kontoyiannis DP, Marr KA, Morrison VA, Segal BH, Steinbach WJ, Stevens DA, van Burik JA, Wingard JR, Patterson TF, Infectious Diseases Society of America 2008. Treatment of aspergillosis: clinical practice guidelines of the Infectious Diseases Society of America. Clin. Infect. Dis. 46:327–360. 10.1086/525258 [DOI] [PubMed] [Google Scholar]
- 2.Gudlaugsson O, Gillespie S, Lee K, Vande Berg J, Hu J, Messer S, Herwaldt L, Pfaller M, Diekema D. 2003. Attributable mortality of nosocomial candidemia, revisited. Clin. Infect. Dis. 37:1172–1177. 10.1086/378745 [DOI] [PubMed] [Google Scholar]
- 3.Eggimann P, Garbino J, Pittet D. 2003. Epidemiology of Candida species infections in critically ill non-immunosuppressed patients. Lancet Infect. Dis. 3:685–702 [DOI] [PubMed] [Google Scholar]
- 4.Kim A, Nicolau DP, Kuti JL. 2011. Hospital costs and outcomes among intravenous antifungal therapies for patients with invasive aspergillosis in the United States. Mycoses 54:e301–e312. 10.1111/j.1439-0507.2010.01903.x [DOI] [PubMed] [Google Scholar]
- 5.Tong KB, Lau CJ, Murtagh K, Layton AJ, Seifeldin R. 2009. The economic impact of aspergillosis: analysis of hospital expenditures across patient subgroups. Int. J. Infect. Dis. 13:24–36. 10.1016/j.ijid.2008.02.013 [DOI] [PubMed] [Google Scholar]
- 6.Andes D, Pascual A, Marchetti O. 2009. Antifungal therapeutic drug monitoring: established and emerging indications. Antimicrob. Agents Chemother. 53:24–34. 10.1128/AAC.00705-08 [DOI] [PMC free article] [PubMed] [Google Scholar]
- 7.Garey KW, Rege M, Pai MP, Mingo DE, Suda KJ, Turpin RS, Bearden DT. 2006. Time to initiation of fluconazole therapy impacts mortality in patients with candidemia: a multi-institutional study. Clin. Infect. Dis. 43:25–31. 10.1086/504810 [DOI] [PubMed] [Google Scholar]
- 8.Morrell M, Fraser VJ, Kollef MH. 2005. Delaying the empiric treatment of Candida bloodstream infection until positive blood culture results are obtained: a potential risk factor for hospital mortality. Antimicrob. Agents Chemother. 49:3640–3645. 10.1128/AAC.49.9.3640-3645.2005 [DOI] [PMC free article] [PubMed] [Google Scholar]
- 9.Pappas PG, Kauffman CA, Andes D, Benjamin DK, Jr, Calandra TF, Edwards JE, Jr, Filler SG, Fisher JF, Kullberg BJ, Ostrosky-Zeichner L, Reboli AC, Rex JH, Walsh TJ, Sobel JD, and Infectious Diseases Society of America 2009. Clinical practice guidelines for the management of candidiasis: 2009 update by the Infectious Diseases Society of America. Clin. Infect. Dis. 48:503–535. 10.1086/596757 [DOI] [PMC free article] [PubMed] [Google Scholar]
- 10.Alffenaar JW, de Vos T, Uges DR, Daenen SM. 2009. High voriconazole trough levels in relation to hepatic function: how to adjust the dosage? Br. J. Clin. Pharmacol. 67:262–263. 10.1111/j.1365-2125.2008.03315.x [DOI] [PMC free article] [PubMed] [Google Scholar]
- 11.Brüggemann RJ, Alffenaar JW, Blijlevens NM, Billaud EM, Kosterink JG, Verweij PE, Burger DM. 2009. Clinical relevance of the pharmacokinetic interactions of azole antifungal drugs with other coadministered agents. Clin. Infect. Dis. 48:1441–1458. 10.1086/598327 [DOI] [PubMed] [Google Scholar]
- 12.Hope WW, Billaud EM, Lestner J, Denning DW. 2008. Therapeutic drug monitoring for triazoles. Curr. Opin. Infect. Dis. 21:580–586. 10.1097/QCO.0b013e3283184611 [DOI] [PubMed] [Google Scholar]
- 13.Pascual A, Csajka C, Buclin T, Bolay S, Bille J, Calandra T, Marchetti O. 2012. Challenging recommended oral and intravenous voriconazole doses for improved efficacy and safety: population pharmacokinetics-based analysis of adult patients with invasive fungal infections. Clin. Infect. Dis. 55:381–390. 10.1093/cid/cis437 [DOI] [PubMed] [Google Scholar]
- 14.Dolton MJ, Ray JE, Chen SC, Ng K, Pont LG, McLachlan AJ. 2012. Multicenter study of voriconazole pharmacokinetics and therapeutic drug monitoring. Antimicrob. Agents Chemother. 56:4793–4799. 10.1128/AAC.00626-12 [DOI] [PMC free article] [PubMed] [Google Scholar]
- 15.Pascual A, Calandra T, Bolay S, Buclin T, Bille J, Marchetti O. 2008. Voriconazole therapeutic drug monitoring in patients with invasive mycoses improves efficacy and safety outcomes. Clin. Infect. Dis. 46:201–211. 10.1086/524669 [DOI] [PubMed] [Google Scholar]
- 16.Troke PF, Hockey HP, Hope WW. 2011. Observational study of the clinical efficacy of voriconazole and its relationship to plasma concentrations in patients. Antimicrob. Agents Chemother. 55:4782–4788. 10.1128/AAC.01083-10 [DOI] [PMC free article] [PubMed] [Google Scholar]
- 17.Dolton MJ, Ray JE, Chen SC, Ng K, Pont L, McLachlan AJ. 13 August 2012. Multicenter study of posaconazole therapeutic drug monitoring: exposure-response relationship and factors affecting concentration. Antimicrob. Agents Chemother. 10.1128/AAC.00802-12 [DOI] [PMC free article] [PubMed] [Google Scholar]
- 18.Dolton MJ, Ray JE, Marriott D, McLachlan AJ. 2012. Posaconazole exposure-response relationship: evaluating the utility of therapeutic drug monitoring. Antimicrob. Agents Chemother. 56:2806–2813. 10.1128/AAC.05900-11 [DOI] [PMC free article] [PubMed] [Google Scholar]
- 19.Green MR, Woolery JE. 2011. Optimising absorption of posaconazole. Mycoses 54:e775–e779. 10.1111/j.1439-0507.2011.02020.x [DOI] [PubMed] [Google Scholar]
- 20.Jang SH, Colangelo PM, Gobburu JV. 2010. Exposure-response of posaconazole used for prophylaxis against invasive fungal infections: evaluating the need to adjust doses based on drug concentrations in plasma. Clin. Pharmacol. Ther. 88:115–119. 10.1038/clpt.2010.64 [DOI] [PubMed] [Google Scholar]
- 21.Pappas PG, Rex JH, Sobel JD, Filler SG, Dismukes WE, Walsh TJ, Edwards JE, Infectious Diseases Society of America 2004. Guidelines for treatment of candidiasis. Clin. Infect. Dis. 38:161–189. 10.1086/380796 [DOI] [PubMed] [Google Scholar]
- 22.Clancy CJ, Yu VL, Morris AJ, Snydman DR, Nguyen MH. 2005. Fluconazole MIC and the fluconazole dose/MIC ratio correlate with therapeutic response among patients with candidemia. Antimicrob. Agents Chemother. 49:3171–3177. 10.1128/AAC.49.8.3171-3177.2005 [DOI] [PMC free article] [PubMed] [Google Scholar]
- 23.Wade KC, Benjamin DK, Jr, Kaufman DA, Ward RM, Smith PB, Jayaraman B, Adamson PC, Gastonguay MR, Barrett JS. 2009. Fluconazole dosing for the prevention or treatment of invasive candidiasis in young infants. Pediatr. Infect. Dis. J. 28:717–723. 10.1097/INF.0b013e31819f1f50 [DOI] [PMC free article] [PubMed] [Google Scholar]
- 24.Han S, Kim J, Yim H, Hur J, Song W, Lee J, Jeon S, Hong T, Woo H, Yim DS. 17 December 2012. Population pharmacokinetic analysis of fluconazole to predict therapeutic outcome in burn patients with Candida infection. Antimicrob. Agents Chemother. 10.1128/AAC.01372-12 [DOI] [PMC free article] [PubMed] [Google Scholar]
- 25.Brett J, Chong O, Graham GG, Ray JE, Marriott D, Williams KM, Day RO. 2013. Antifungal use and therapeutic monitoring of plasma concentrations of itraconazole in heart and lung transplantation patients. Ther. Drug Monit. 35:133–136. 10.1097/FTD.0b013e318275fe69 [DOI] [PubMed] [Google Scholar]
- 26.Cartledge JD, Midgely J, Gazzard BG. 1997. Itraconazole solution: higher serum drug concentrations and better clinical response rates than the capsule formulation in acquired immunodeficiency syndrome patients with candidosis. J. Clin. Pathol. 50:477–480 [DOI] [PMC free article] [PubMed] [Google Scholar]
- 27.Cheomung A, Na-Bangchang K. 2011. HPLC with ultraviolet detection for the determination of chloroquine and desethylchloroquine in whole blood and finger-prick capillary blood dried on filter paper. J. Pharm. Biomed. Anal. 55:1031–1040. 10.1016/j.jpba.2011.03.001 [DOI] [PubMed] [Google Scholar]
- 28.Kromdijk W, Mulder JW, Rosing H, Smit PM, Beijnen JH, Huitema AD. 2012. Use of dried blood spots for the determination of plasma concentrations of nevirapine and efavirenz. J. Antimicrob. Chemother. 67:1211–1216. 10.1093/jac/dks011 [DOI] [PubMed] [Google Scholar]
- 29.Vu DH, Bolhuis MS, Koster RA, Greijdanus B, de Lange WC, van Altena R, Brouwers JR, Uges DR, Alffenaar JW. 27 August 2012. Dried blood spot analysis for therapeutic drug monitoring of linezolid in patients with multidrug-resistant tuberculosis. Antimicrob. Agents Chemother. 10.1128/AAC.01054-12 [DOI] [PMC free article] [PubMed] [Google Scholar]
- 30.Vu DH, Koster RA, Alffenaar JW, Brouwers JR, Uges DR. 2011. Determination of moxifloxacin in dried blood spots using LC-MS/MS and the impact of the hematocrit and blood volume. J. Chromatogr. B Analyt. Technol. Biomed. Life Sci. 879:1063–1070. 10.1016/j.jchromb.2011.03.017 [DOI] [PubMed] [Google Scholar]
- 31.Li W, Tse FL. 2010. Dried blood spot sampling in combination with LC-MS/MS for quantitative analysis of small molecules. Biomed. Chromatogr. 24:49–65. 10.1002/bmc.1367 [DOI] [PubMed] [Google Scholar]
- 32.Vu DH, Alffenaar JW, Edelbroek PM, Brouwers JR, Uges DR. 2011. Dried blood spots: a new tool for tuberculosis treatment optimization. Curr. Pharm. Des. 17:2931–2939 [DOI] [PubMed] [Google Scholar]
- 33.Edelbroek PM, van der Heijden J, Stolk LM. 2009. Dried blood spot methods in therapeutic drug monitoring: methods, assays, and pitfalls. Ther. Drug Monit. 31:327–336. 10.1097/FTD.0b013e31819e91ce [DOI] [PubMed] [Google Scholar]
- 34.Alffenaar JW, Wessels AM, van Hateren K, Greijdanus B, Kosterink JG, Uges DR. 2010. Method for therapeutic drug monitoring of azole antifungal drugs in human serum using LC/MS/MS. J. Chromatogr. B Analyt. Technol. Biomed. Life Sci. 878:39–44. 10.1016/j.jchromb.2009.11.017 [DOI] [PubMed] [Google Scholar]
- 35.U.S. Department of Health and Human Services Food and Drug Administration, Center for Drug Evaluation and Research (CDER), Center for Veterinary Medicine (CMV) May 2001. Guidance for industry: bioanalytical method validation. U.S. Food and Drug Administration, Silver Spring, MD: http://www.fda.gov/downloads/Drugs/Guidances/ucm070107.pdf [Google Scholar]
- 36.Felce D, Perry J. 1995. Quality of life: its definition and measurement. Res. Dev. Disabil. 16:51–74 [DOI] [PubMed] [Google Scholar]
- 37.Cohen SR, Mount BM, Tomas JJ, Mount LF. 1996. Existential well-being is an important determinant of quality of life. Evidence from the McGill Quality of Life Questionnaire. Cancer 77:576–586 [DOI] [PubMed] [Google Scholar]
- 38.Downie WW, Leatham PA, Rhind VM, Wright V, Branco JA, Anderson JA. 1978. Studies with pain rating scales. Ann. Rheum. Dis. 37:378–381 [DOI] [PMC free article] [PubMed] [Google Scholar]
- 39.Emmons G, Rowland M. 2010. Pharmacokinetic considerations as to when to use dried blood spot sampling. Bioanalysis 2:1791–1796. 10.4155/bio.10.159 [DOI] [PubMed] [Google Scholar]
- 40.Baietto L, D'Avolio A, Marra C, Simiele M, Cusato J, Pace S, Ariaudo A, De Rosa FG, Di Perri G. 2012. Development and validation of a new method to simultaneously quantify triazoles in plasma spotted on dry sample spot devices and analysed by HPLC-MS. J. Antimicrob. Chemother. 67:2645–2649. 10.1093/jac/dks285 [DOI] [PubMed] [Google Scholar]
- 41.Kromdijk W, Mulder JW, Smit PM, Ter Heine R, Beijnen JH, Huitema AD. 12 December 2012. Therapeutic drug monitoring of antiretroviral drugs at home using dried blood spots: a proof of concept study. Antivir. Ther. 10.3851/IMP2501 [DOI] [PubMed] [Google Scholar]
- 42.Cheung CY, van der Heijden J, Hoogtanders K, Christiaans M, Liu YL, Chan YH, Choi KS, van de Plas A, Shek CC, Chau KF, Li CS, van Hooff J, Stolk L. 2008. Dried blood spot measurement: application in tacrolimus monitoring using limited sampling strategy and abbreviated AUC estimation. Transpl. Int. 21:140–145. 10.1111/j.1432-2277.2007.00584.x [DOI] [PubMed] [Google Scholar]