

Abstract
In light of the concept of the mutant selection window, i.e., the range between the MIC and the mutant prevention concentration (MPC), MPC-related pharmacokinetic indices should be more predictive of bacterial resistance than the respective MIC-related indices. However, experimental evidence of this hypothesis remains limited and contradictory. To examine the predictive power of the ratios of the area under the curve (AUC24) to the MPC and the MIC, the selection of ciprofloxacin-resistant mutants of four Escherichia coli strains with different MPC/MIC ratios was studied. Each organism was exposed to twice-daily ciprofloxacin for 3 days at AUC24/MIC ratios that provide peak antibiotic concentrations close to the MIC, between the MIC and the MPC, and above the MPC. Resistant E. coli was intensively enriched at AUC24/MPCs from 1 to 10 h (AUC24/MIC from 60 to 360 h) but not at the lower or higher AUC24/MPC and AUC24/MIC ratios. AUC24/MPC and AUC24/MIC relationships of the areas under the time courses of ciprofloxacin-resistant E. coli (AUBCM) were bell-shaped. A Gaussian-like function fits the AUBCM-AUC24/MPC and AUBCM-AUC24/MIC data combined for all organisms (r2 = 0.69 and 0.86, respectively). The predicted anti-mutant AUC24/MPC ratio was 58 ± 35 h, and the respective AUC24/MIC ratio was 1,080 ± 416 h. Although AUC24/MPC was less predictive of strain-independent E. coli resistance than AUC24/MIC, the established anti-mutant AUC24/MPC ratio was closer to values reported for Staphylococcus aureus (60 to 69 h) than the respective AUC24/MIC ratio (1,080 versus 200 to 240 h). This implies that AUC24/MPC might be a better interspecies predictor of bacterial resistance than AUC24/MIC.
INTRODUCTION
The concept of the mutant selection window (MSW), i.e., the range between the MIC and the mutant prevention concentration (MPC) (1), has contributed to an understanding of why antibiotic-resistant mutants are enriched in some but not all treatments. In light of this hypothesis, MPC-related pharmacokinetic indices should be more predictive of bacterial resistance than the respective MIC-related indices. However, the advantages of the former over the latter indices have been reported in only a few in vitro studies with ciprofloxacin-exposed (2) and levofloxacin-exposed(3) Staphylococcus aureus and with ciprofloxacin-exposed Escherichia coli (4). On the other hand, the predictive potentials of the MPC- and MIC-related indices were shown to be similar in an in vivo study of Streptococcus pneumoniae-infected rabbits treated with gatifloxacin using a human-like dosing regimen (5) and in an in vitro study with marbofloxacin- and enrofloxacin-exposed E. coli (6). In our in vitro study with S. aureus exposed to daptomycin and vancomycin, the ratio of the 24-h area under the concentration-time curve (AUC24) to the MPC was less predictive of bacterial resistance than the AUC24/MIC ratio (7).
To further examine the predictive power of AUC24/MPC and AUC24/MIC, the selection of ciprofloxacin-resistant mutants of four E. coli strains at various MPC/MIC ratios was studied over a wide range of simulated AUC24/MICs.
MATERIALS AND METHODS
Antimicrobial agents, bacterial strains, and susceptibility testing.
Ciprofloxacin powder was purchased from AppliChem Biochemica Chemical Synthesis Services, Darmstadt, Germany.
E. coli ATCC 25922, E. coli clinical isolates 4300 and 4454, and E. coli laboratory strain mutator GM2995 (ES1578) (8) were selected for the study. The MICs were determined prior to and after 3-day simulated treatments with ciprofloxacin. Susceptibility testing was performed at least in duplicate by broth microdilution techniques at 24 h postexposure with organisms grown in Ca2+- and Mg2+-supplemented Mueller-Hinton broth (MHB) at an inoculum size of 106 CFU/ml. The MICs of ciprofloxacin were 0.008 μg/ml with E. coli strains ATCC 25922, 4300, and 4454 and 0.016 μg/ml with E. coli strain GM2995.
The MPCs were determined as described elsewhere (2). Briefly, the tested microorganisms were cultured in MHB and incubated for 24 h. The suspension was then centrifuged (4,000 × g for 10 min) and resuspended in MHB to yield a concentration of ∼1010 CFU/ml. A series of agar plates containing known ciprofloxacin concentrations were then inoculated with ∼1010 CFU of E. coli. The inoculated plates were incubated for 48 h at 37°C and screened visually for growth. To estimate the MPC, logarithms of bacterial numbers were plotted against antibiotic concentrations. The MPC was taken as the point at which the plot intersected the lower limit of detection (log CFU/ml = 1).
In vitro dynamic model and simulated pharmacokinetic profiles.
A previously described dynamic model (9) was used in the study. Briefly, the model consisted of two connected flasks, one containing fresh BBL Trypticase soy broth (TSB) and the other with a magnetic stirrer, the central unit, with the same broth containing a bacterial culture plus antibiotic. Peristaltic pumps circulated fresh nutrient medium to the flasks and from the central 100-ml unit at a flow rate of 17.3 ml/h.
The system was filled with sterile TSB and placed in an incubator at 37°C. The central unit was inoculated with an 18-h culture of E. coli. After 2 h of incubation the resulting exponentially growing cultures reached ∼108 CFU/ml, and ciprofloxacin solutions were injected into the central unit at 12-h intervals. The duration of the experiments was defined in each case as the time after the last dose when ciprofloxacin-exposed bacteria reached numbers observed at the beginning of the experiment (≥108 CFU/ml).
A series of monoexponential profiles that mimic twice-daily dosing of ciprofloxacin with a half-life (t1/2) of 4 h was simulated for 3 consecutive days. The simulated t1/2 represented weighted means of values reported for humans: 3.2 to 5.0 h (10). The profiles were designed to provide 24-h ratios of area under the curve (AUC24) to the MIC ratios from 9 to 15 h to 2,880 h (E. coli strains ATCC 25922 and GM2995) and from 15 to 720 h (E. coli strains 4300 and 4454).
Ciprofloxacin concentrations in the central unit of the model were determined by an HPLC assay. Isocratic separation was performed at 30°C on a Luna C18(2) column (250 by 4.6 mm; particle size, 5 μm; Phenomenex, Torrance, CA). The injection volume was 10 μl. The mobile phase consisted of a 3.5-μg/liter solution of phosphoric acid, previously adjusted to pH 3.0 with triethylamine-acetonitrile-methanol (volume ratio, 860:111:29) at a flow rate of 1.2 ml/min (Gilson 305; Gilson S.A.S., Villiers-le-Bel, France). The column effluent was monitored with the fluorescence detector (Waters 2475; Waters Associates, Milford, MA) at 278 nm (excitation) and 450 nm (emission). The calibration plot was linear (r2 ≥ 0.99) over the concentration range of 0.04 to 0.5 μg/ml. The within-run relative standard deviations (n = 5) was 1.4%. The lower limit of accurate detection was 0.04 μg/ml. The determined concentrations of ciprofloxacin were in concordance with the target values without systematic differences over the entire observation period. The estimated half-life of ciprofloxacin was close to the target value (4.3 ± 0.2 h).
Quantitation of the antimicrobial effect and susceptibility changes.
In each experiment, bacterium-containing medium from the central unit of the model was sampled to determine bacterial concentrations throughout the observation period. Samples (100 μl) were serially diluted as appropriate and spirally plated onto TSB agar plates using Easy Spiral Pro (Interscience, St. Nom, France). Colonies were counted by an automated colony counter Interscience Scan 1200 (Interscience, St. Nom, France). The lower limit of counting was 200 CFU/ml (equivalent to 20 colonies per plate). To reveal resistant mutants, each sample was serially diluted if necessary and plated manually onto agar plates containing 2×, 4×, 8×, and 16× the MIC of ciprofloxacin. The lower limit of detection was 10 CFU/ml (equivalent to at least one colony per plate). To reveal changes in susceptibility of ciprofloxacin-exposed bacterial cultures, the MICs were reassessed after antibiotic exposures.
Based on time-kill data, the intensity of the antimicrobial effect, i.e., the area between the control growth and time-kill curves (IE) (9, 11) from time zero to the time after the last antibiotic dose at which the number of antibiotic-exposed bacteria reached 108 CFU/ml, was determined. To delineate AUC24/MIC and AUC24/MPC relationships with resistance, areas under the bacterial concentration-time curves (AUBCs, i.e., the AUBKC [12]) with mutants (AUBCMs [2]) were determined for subpopulations resistant to 2×, 4×, 8×, and 16× the MIC of antibiotic from the beginning of treatment to 72 h corrected for the areas under the lower limit of detection over the same time interval.
Relationships of the antimicrobial effect to AUC24/MIC.
The IE-log AUC24/MIC curve was fitted by the sigmoid function:
| (1) |
where Y is IE, x is log(AUC24/MIC), Y0 and a are the minimal and maximal values of the antimicrobial effect, respectively, x0 is x corresponds to a/2, and b is a parameter reflecting sigmoidicity.
Relationships of the emergence of resistance to AUC24/MIC, AUC24/MPC and the time above MPC (T>MPC).
To relate the enrichment of resistant mutants (expressed as AUBCM) to the simulated AUC24/MICs or AUC24/MPCs, a modified Gaussian type function was used:
| (2) |
where Y is AUBCM, x is log(AUC24/MIC) or log(AUC24/MPC), Y0 is the minimal value of Y, x0 is the log(AUC24/MIC) or log(AUC24/MPC) that corresponds to the maximal value of Y, and a and b are parameters.
AUC24/MIC, AUC24/MPC, and T>MPC relationships with AUBCM determined at the AUC24/MICs or AUC24/MPCs that correspond to T>MPC values of >0 were fitted by the exponential decay function:
| (3) |
where Y is AUBCM, Y0 is the minimal value of Y, x is log (AUC24/MIC), log (AUC24/MPC) or T>MPC, and a and b are parameters.
Mechanisms of resistance.
The nucleotide sequences of the quinolone-resistance determining regions (QRDRs) of gyrA and parC genes were determined for both parental and mutated strains by PCR and sequencing as previously described (13).
Bacterial genomic DNA was isolated using the InstaGene matrix kit (Bio-Rad Laboratories, Inc., Hercules, CA). Amplified fragments were purified by exonuclease I/shrimp alkaline phosphatase (ExoSAP-IT) treatment (GE Healthcare, Ltd., Buckinghamshire, United Kingdom) and were sequenced on both strands using the same primers as in the PCR with the BigDye Terminator v3.1 cycle sequencing kit and ABI Prism 310 genetic analyzer (Applied Biosystems, Foster City, CA). The sequences obtained were compared to those previously reported for gyrA (GenBank accession no. NC_004431, region 2623646.0.2626273) and parC genes (GenBank accession no. NC_004431, region 3593045.0.3595303).
RESULTS
In determining the MPCs, the numbers of surviving E. coli colonies decreased systematically with increasing ciprofloxacin concentrations in the plates (Fig. 1). With E. coli strains ATCC 25922, 4454, and GM2995, a rapid decay of CFU counts was observed, and the estimated MPCs were of the same order: 0.11, 0.25, and 0.5 μg/ml, respectively. Unlike these three organisms, E. coli 4300 exhibited a biphasic pattern of the log CFU-concentration curve with a rapid decay in number of colonies at ciprofloxacin concentration of 0 to 0.016 μg/ml, followed by a plateau at concentrations from 0.5 to 4 μg/ml, and then again a rapid decline in CFU at higher antibiotic concentrations. The MPC of ciprofloxacin determined using the last three points on the CFU-concentration curve was estimated at 15 μg/ml.
Fig 1.
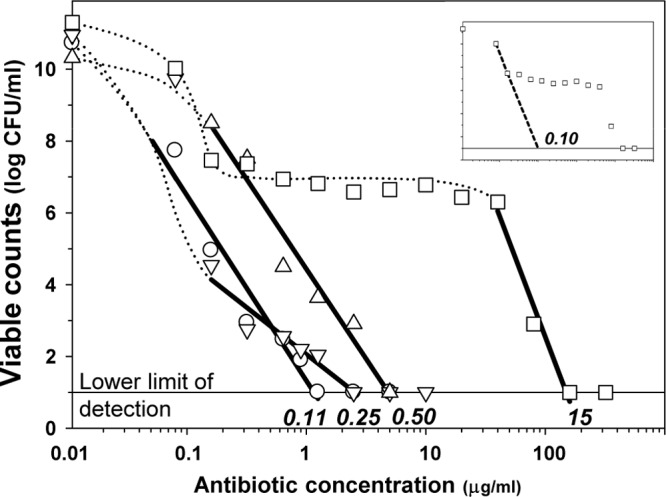
Determination of MPC. Estimated values are indicated by italicized text. Symbols: ○, E. coli ATCC 25922; □, E. coli 4300; ▽, E. coli 4454; △, E. coli GM2995.
Simulated concentrations and the time courses of ciprofloxacin-exposed E. coli grown on antibiotic-free (0× the MIC) and antibiotic-containing (4× and 16× the MIC) media are shown in Fig. 2. As seen in the figure (second row), small and transient reductions, if any, in the number of susceptible cells were observed at the lower AUC24/MIC ratios (9 to 15 h). More noticeable reductions (2.5- to 5-fold) in bacterial numbers, followed by regrowth 6 h after the start of experiments, were seen at an AUC24/MIC ratio of 180 h. The most pronounced reductions (3.5- to 6-fold) in bacterial numbers and the latest regrowth toward the end of simulated treatments were seen at the highest AUC24/MIC ratio of 720 h. At a given AUC24/MIC ratio, similar time-kill curves were observed with all ciprofloxacin-exposed organisms.
Fig 2.

Simulated pharmacokinetics and time courses of susceptible (0× the MIC) and resistant (4× and 16× the MIC) subpopulations of E. coli exposed to ciprofloxacin. Antibiotic dosing is indicated by arrows. The simulated AUC/MIC ratios (in hours) are indicated by numbers at each pharmacokinetic profile. The descriptions of the symbols are the same as those presented in the legend to Fig. 1.
The respective resistance data are shown in the last two rows of Fig. 2. At the minimal AUC24/MIC ratios (9 to 15 h) E. coli mutants resistant to 4× the MIC of ciprofloxacin were enriched on the second (E. coli GM2995), third (E. coli 4454), or fourth day after the start of simulated treatment (E. coli 4300 and ATCC 25922), although the maximal numbers of mutants were 2 to 6 orders lower than those of susceptible cells (third row of Fig. 2). At the higher AUC24/MIC ratio (180 h), the amplification of resistant mutants of all four organisms started earlier, on the second day, and maximal mutant counts approached the maximal values seen with susceptible cells. At the highest AUC24/MIC ratio (720 h), resistant mutants were not enriched during the treatments, although they were enriched after discontinuing treatment. The same patterns were established with the most resistant mutant (fourth row of Fig. 2) and with intermediate mutants, resistant to 2× and 8× the MIC of ciprofloxacin (data not shown). The enrichment of resistant E. coli was accompanied by a concomitant loss in the susceptibility of ciprofloxacin-exposed organisms. At am AUC24/MIC of 180 h, the mean MIC elevation for the four studied organisms was more pronounced (a 25-fold increase in the MIC) than at 9 to 15 h and 720 h (10- and 8-fold increases in the MIC, respectively).
The results of PCR amplification and sequencing of the QRDRs of gyrA and parC genes are shown in the Table 1. In all of the mutants the genetic analysis revealed the presence of single nucleotide substitutions in the gyrA QRDR sequences corresponding to amino acid changes, Ser83Leu (E. coli ATCC 25922 and E. coli 4300), Asp87Tyr (E. coli GM2995), and Asp87Gly (E. coli 4454). None of the isolates had changes in parC. Since none of the strains, including E. coli 4300, had double mutations in gyrA or additional mutations in parC, the MPC ratio of 15 μg/ml that describes the second-step mutations, is not applicable in our case. This circumstance allows us to make a rough approximation of the MPC for E. coli strain 4300 for the first-step mutants assuming that the first two points of the curve exhibiting the number of colonies that arose on ciprofloxacin-containing agar plates belong to the first-step mutants (dotted line in the upper plot in Fig. 1). The respective MPC was estimated at 0.1 μg/ml, and this value was used in the subsequent analysis.
Table 1.
Ciprofloxacin resistance phenotypes and amino acid substitutions in E. coli strains
| E. coli strain | GyrA mutation | ParC mutationa |
|---|---|---|
| ATCC 25922 | Ser83Leu | WT |
| 4300 | Ser83Leu | WT |
| 4454 | Asp87Gly | WT |
| GM2995 | Asp87Tyr | WT |
WT, wild type.
Plots of the AUC24/MIC and AUC24/MPC relationships with AUBCM are represented by similar bell-shaped curves (upper panel of Fig. 3). With each organism, the AUBCM increased with an increase in the AUC24/MIC or AUC24/MPC, reaching a maximum and then, at higher AUC24/MICs or AUC24/MPCs, the AUBCM decreased to zero. The enrichment of resistant mutants led to a loss in susceptibility of ciprofloxacin-exposed E. coli. Maximal loss was observed at AUC24/MICs (or AUC24/MPCs) corresponding to the top of the bell curves: at AUC24/MIC ratios of 180 and 360 h, the MIC elevations seen with the studied organisms averaged 25-fold; at smaller (30 and 60 h) and larger (720 h) AUC24/MICs, the elevations were <10-fold.
Fig 3.

AUC24/MIC- and AUC24/MPC-dependent effects of ciprofloxacin on resistant to 4× the MIC subpopulations of E. coli. Combined data on four bacterial strains (bottom row) are fitted by equation 2. AUC24/MIC: Y0 = 0, x0 = 1.896, a = 414.3, b = 0.6338, c = 4.304. AUC24/MPC: Y0 = 0, x0 = 0.5809, a = 436.1, b = 0.5567, c = 2.000. The descriptions of the symbols are the same as those presented in the legend to Fig. 1.
As seen in the left portion of the figure, both ascending and descending branches of the bells seen with all four organisms were virtually superimposed, although the maximal AUBCM observed with E. coli GM2995 was less than with the other three strains at comparable AUC24/MICs. Unlike the AUC24/MIC, the AUC24/MPC curves of the AUBCMs determined with the different organisms were more stratified (right portion of Fig. 3). This resulted in more variable estimates of the anti-mutant AUC24/MPCs (from 25 to 100 h, a 4-fold difference) compared to the corresponding estimates of the AUC24/MIC ratio (from 720 to 1,440 h, a 2-fold difference). The mean values of the anti-mutant AUC24/MPC and AUC24/MIC ratios were estimated to be 58 ± 35 and 1,080 ± 416 h, respectively. For the same reason, a Gaussian-like function fits the AUBCM-AUC24/MPC combined data set worse than the AUBCM-AUC24/MIC set (bottom panel of Fig. 3): r2 = 0.69 versus r2 = 0.86. Both the AUC24/MPC and the AUC24/MIC resistance relationships were more strain specific than the AUC24/MIC relationship with the ciprofloxacin antimicrobial effect on susceptible E. coli: using combined data on the four studied organisms, a strong correlation was established between IE and AUC24/MIC (r2 = 0.96; Fig. 4).
Fig 4.
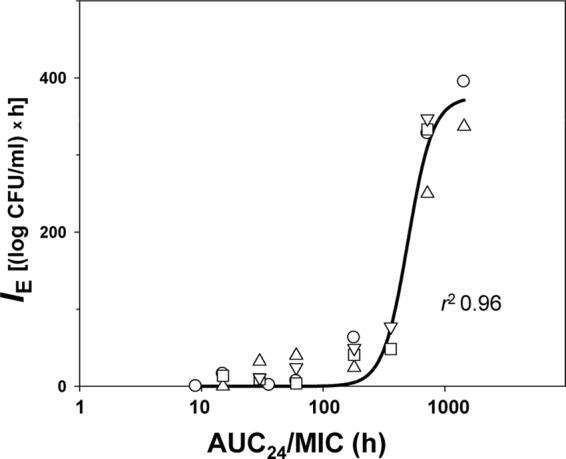
AUC24/MIC-dependent effects of ciprofloxacin on susceptible subpopulation of E. coli fitted by equation 1. Y0 = 0, x0 = 2,697, a = 375, b = 0.1025. The descriptions of the symbols are the same as those presented in the legend to Fig. 1.
DISCUSSION
This study was designed to search for optimal predictors of the development of bacterial resistance and showed similar patterns of the AUC24/MPC and AUC24/MIC relationships with the selection of resistant mutants of ciprofloxacin-exposed E. coli. These relationships were described by bell-shaped curves for all organisms: resistant mutants were intensively enriched at AUC24/MPC from 1 to 10 h and at AUC24/MIC from 60 to 360 h but not at lower or higher AUC24/MPC and AUC24/MIC ratios. However, AUBCM versus AUC24/MPC curves were more specific for each organism than the respective AUBCM versus AUC24/MIC curves. As seen in the upper panel of Fig. 3, the former curves were more stratified than the latter curves. As a result, a Gaussian-like function fits AUBCM versus AUC24/MPC data that were combined for the four organisms worse than the AUBCM-AUC24/MIC data (bottom panel of Fig. 3): r2 = 0.69 versus r2 = 0.86.
A similar but less pronounced difference would be seen if only points on the descending branch of the bell (i.e., the branch that has defining value for prediction of the anti-mutant antibiotic concentration) were considered (Fig. 5). Although the AUC24/MPC and AUC24/MIC relationships with the AUBCM were similar, the enrichment of resistant E. coli correlated better with AUC24/MIC than with AUC24/MPC or the time above the MPC (T>MPC): r2 = 0.81 versus r2 = 0.74 and 0.71, respectively. Not surprisingly, the anti-mutant AUC24/MPC ratios vary from strain to strain in a broader range than the respective AUC24/MIC ratios (a 4-fold versus a 2-fold difference). Even less clear AUC24/MPC relationships with resistance compared to AUC24/MIC relationships were observed previously with daptomycin- and vancomycin-exposed S. aureus (7). In two other studies, E. coli exposed to marbofloxacin and enrofloxacin in an in vitro model (6) and pneumococcal pneumonia in rabbits treated with gatifloxacin (5), both AUC24/MPC and AUC24/MIC exhibited similar bell-shaped relationships with resistance. In fact, the advantages of AUC24/MPC over AUC24/MIC were clearly proven in three in vitro studies: ciprofloxacin-exposed E. coli (4) and ciprofloxacin-exposed (2) and levofloxacin-exposed (3) S. aureus.
Fig 5.
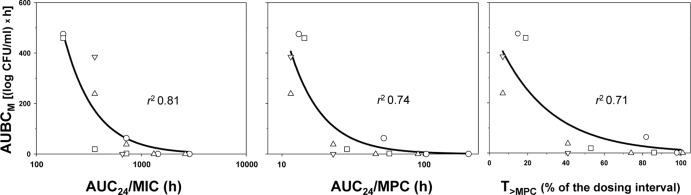
Ciprofloxacin effects of on resistant to 4× the MIC subpopulations of E. coli as related to different predictors fitted by equation 3. Y0 = 0, a = 101000 (AUC24/MIC), 700 (AUC24/MPC), or 525 (T>MPC), and b = 3.39, 4.34, or 0.0369, respectively. The descriptions of the symbols are the same as those presented in the legend to Fig. 1.
The reasons for these discrepancies remain unclear. Obviously, they could result from different experimental design and data interpretation, the choice of bacterial strains, the range of simulated AUC24/MIC and/or AUC24/MPC ratios, the indices reflecting resistance development, etc. For example, the choice of bacterial strains exhibiting an insufficient range of the MPC/MIC ratio could prevent accurate discrimination between the MPC- and MIC-related indices as predictors of bacterial resistance. On the other hand, the use of an insufficient range of simulated AUC24/MIC and/or AUC24/MPC could lead to an unbalanced range of the target effects (the prevalence of resistance manifestations or the lack thereof). However, our analysis of the cited studies does not confirm these concerns. Indeed, in studies showing the advantages of MPC-related indices over MIC-related indices (2–4), the MPC/MIC range was of the same order (4- to 8-fold differences in MPC/MIC) as in studies that do not show such advantages (5–7; the present study): 3- to 8-fold differences in MPC/MIC. Also, the AUC24/MIC ratios simulated (or achieved) in the latter four studies varied over at least 48-fold (the present study), 16- to 33-fold (7), 8-fold (5) and 6- to 7-fold (6) compared to 3- to 5-fold (2), 8-fold (3), and at least 16-fold (4). As for the determination of resistance, similar measures (the ratio of the postexposure MIC to the pre-exposure MIC [3, 6], population analysis data [4, 5; the present study], or both measures [2, 7]) were used both in studies showing the advantages of AUC24/MPC over AUC24/MIC and in studies that did not support this point.
The anti-mutant AUC24/MIC and AUC24/MPC ratios predicted in our study (1,080 and 58 h, respectively) are at least 3-fold higher than those previously reported with ciprofloxacin-exposed E. coli (4): 45 to 364 h and 11 to 23 h, respectively. This difference could result from the shorter observation period used in the referenced study (24 h versus 72 h in the present study): insufficient simulated treatment and/or observation duration could lead to an underestimation of the anti-mutant antibiotic concentrations (14). Also, simulation of a single ciprofloxacin dose (4) instead of conventional twice-daily dosing (the present study) may contribute to the above discrepancies. Despite the relatively high estimated anti-mutant AUC24/MIC ratio (average, 1,080 h; 720 to 1,440 h for the individual organisms), this ratio is attainable in a clinical setting. According to the AUCs reported in human pharmacokinetic studies with ciprofloxacin (500 mg twice a day), the AUC24 of ∼22 μg·h/ml (15) is clinically achievable. Given this estimate, the clinically attainable AUC24/MIC ratio with E. coli strains 4300, 4454, and ATCC 25922 approaches 2,750 h and with E. coli GM2995 is 1,375 h, which is close to or larger than the anti-mutant AUC24/MIC ratio.
In conclusion, although AUC24/MPC as a strain-independent predictor of bacterial resistance did not exhibit any advantages over AUC24/MIC in the present study, the anti-mutant AUC24/MPC ratio established in the present study with E. coli (58 h) appeared to be close to the value reported in our study with fluoroquinolone (including ciprofloxacin)-exposed S. aureus (60 to 69 h [16]) using the same in vitro model. Unlike AUC24/MPC, the anti-mutant AUC24/MICs for E. coli and S. aureus differ 5-fold: 1,080 h in the present study versus 200 to 240 h in the S. aureus study (16). This implies that AUC24/MPC, but not AUC24/MIC, might be a species-independent predictor of bacterial resistance. Obviously, further studies with other organisms are needed to confirm this conclusion.
Overall, our findings support the MSW hypothesis, as applied to ciprofloxacin-exposed E. coli. However, continuing search for the optimal predictor(s) of mutant enrichment is encouraged.
Footnotes
Published ahead of print 29 July 2013
REFERENCES
- 1.Dong Y, Zhao X, Domagala J, Drlica K. 1999. Effect of fluoroquinolone concentration on selection of resistant mutants of Mycobacterium bovis BCG and Staphylococcus aureus. Antimicrob. Agents Chemother. 43:1756–1758 [DOI] [PMC free article] [PubMed] [Google Scholar]
- 2.Firsov AA, Smirnova MV, Strukova EN, Vostrov SN, Portnoy YA, Zinner SH. 2008. Enrichment of resistant Staphylococcus aureus at ciprofloxacin concentrations simulated within the mutant selection window: bolus versus continuous infusion. Int. J. Antimicrob. Agents 32:488–493 [DOI] [PubMed] [Google Scholar]
- 3.Liang B, Bai N, Cai Y, Wang R, Drlica K, Zhao X. 2011. Mutant prevention concentration-based pharmacokinetic/pharmacodynamic indices as dosing targets for suppressing the enrichment of levofloxacin-resistant subpopulations of Staphylococcus aureus. Antimicrob. Agents Chemother. 55:2409–2412 [DOI] [PMC free article] [PubMed] [Google Scholar]
- 4.Olofsson SK, Marcusson LL, Lindgren PK, Hughes D, Cars O. 2006. Selection of ciprofloxacin resistance of Escherichia coli in an in vitro kinetic model: relation between drug exposure and mutant prevention concentration. J. Antimicrob. Chemother. 57:1116–1121 [DOI] [PubMed] [Google Scholar]
- 5.Croisier D, Etienne M, Piroth L, Bergoin E, Lequeu C, Portier H, Chavanet P. 2004. Iin vivo pharmacodynamics efficacy of gatifloxacin against Streptococcus pneumoniae in an experimental model of pneumonia: impact of the low levels of fluoroquinolone resistance on the enrichment of resistant mutants. J. Antimicrob. Chemother. 54:640–647 [DOI] [PubMed] [Google Scholar]
- 6.Gebru E, Choi M-J, Lee S-J, Damte D, Park SC. 2011. Mutant-prevention concentration and mechanism of resistance in clinical isolates and enrofloxacin/ marbofloxacin-selected mutants of Escherichia coli of canine origin. J. Med. Microbiol. 60:1512–1522 [DOI] [PubMed] [Google Scholar]
- 7.Firsov AA, Smirnova MV, Lubenko IY, Vostrov SN, Portnoy YA, Zinner SH. 2006. Testing the mutant selection window hypothesis with Staphylococcus aureus exposed to daptomycin and vancomycin in an in vitro dynamic model. J. Antimicrob. Chemother. 58:1185–1192 [DOI] [PubMed] [Google Scholar]
- 8.Fowler RG, Degnen GE, Cox EC. 1974. Mutational specificity of a conditional Escherichia coli mutator, mutD5. Mol. Gen. Genet. 133:179–191 [DOI] [PubMed] [Google Scholar]
- 9.Firsov AA, Vostrov SN, Shevchenko AA, Cornaglia G. 1997. Parameters of bacterial killing and regrowth kinetics and antimicrobial effect examined in terms of area under the concentration-time curve relationships: action of ciprofloxacin against Escherichia coli in an in vitro dynamic model. Antimicrob. Agents Chemother. 41:1281–1287 [DOI] [PMC free article] [PubMed] [Google Scholar]
- 10.Wilson APR, Grüneberg RN. 1997. Ciprofloxacin: 10 years of clinical experience. Maxim Medical, Oxford, United Kingdom [Google Scholar]
- 11.Firsov AA, Chernykh VM, Navashin SM. 1990. Quantitative analysis of antimicrobial effect kinetics in an in vitro dynamic model. Antimicrob. Agents Chemother. 34:1312–1317 [DOI] [PMC free article] [PubMed] [Google Scholar]
- 12.MacGowan AP, Bowker KE, Wootton M, Holt HA. 1999. Activity of moxifloxacin, administered once a day, against Streptococcus pneumoniae in an in vitro pharmacodynamic model of infection. Antimicrob. Agents Chemother. 43:1560–1564 [DOI] [PMC free article] [PubMed] [Google Scholar]
- 13.Sáenz Y, Zarazaga M, Briñas L, Ruiz-Larrea F, Torres C. 2003. Mutations in gyrA and parC genes in nalidixic acid-resistant Escherichia coli strains from food products, humans, and animals. J. Antimicrob. Chemother. 51:1001–1005 [DOI] [PubMed] [Google Scholar]
- 14.Smirnova MV, Vostrov SN, Strukova EN, Dovzhenko SA, Kobrin MB, Portnoy YA, Zinner SH, Firsov AA. 2009. The impact of duration of antibiotic exposure on bacterial resistance predictions using in vitro dynamic models. J. Antimicrob. Chemother. 64:815–820 [DOI] [PubMed] [Google Scholar]
- 15.Lettieri JT, Rogge MC, Kaiser L, Echols RM, Heller AH. 1992. Pharmacokinetic profiles of ciprofloxacin after single intravenous and oral doses. Antimicrob. Agents Chemother. 36:993–996 [DOI] [PMC free article] [PubMed] [Google Scholar]
- 16.Firsov AA, Vostrov SN, Lubenko IY, Drlica K, Portnoy YA, Zinner SH. 2003. In vitro pharmacodynamic evaluation of the mutant selection window hypothesis using four fluoroquinolones against Staphylococcus aureus. Antimicrob. Agents Chemother. 47:1604–1613 [DOI] [PMC free article] [PubMed] [Google Scholar]