

Abstract
Toxoplasma gondii is an obligate intracellular parasite that invades a wide range of vertebrate host cells. Chronic infections with T. gondii become established in the tissues of the central nervous system, where the parasites may directly or indirectly modulate neuronal function. However, the mechanisms underlying parasite-induced neuronal disorder in the brain remain unclear. This study evaluated host gene expression in mouse brain following infection with T. gondii. BALB/c mice were infected with the PLK strain, and after 32 days of infection, histopathological lesions in the frontal lobe were found to be more severe than in other areas of the brain. Total RNA extracted from infected and uninfected mouse brain samples was subjected to transcriptome analysis using RNA sequencing (RNA-seq). In the T. gondii-infected mice, 935 mouse brain genes were upregulated, whereas 12 genes were downregulated. GOstat analysis predicted that the upregulated genes were primarily involved in host immune responses and cell activation. Positive correlations were found between the numbers of parasites in the infected mouse brains and the expression levels of genes involved in host immune responses. In contrast, genes that had a negative correlation with parasite numbers were predicted to be involved in neurological functions, such as small-GTPase-mediated signal transduction and vesicle-mediated transport. Furthermore, differential gene expression was observed between mice exhibiting the clinical signs of toxoplasmosis and those that did not. Our findings may provide insights into the mechanisms underlying neurological changes during T. gondii infection.
INTRODUCTION
Toxoplasma gondii, an obligate intracellular parasite, invades a wide variety of cells in its vertebrate hosts. The disease caused by T. gondii is usually asymptomatic but can be severe in immunosuppressed individuals, and cyst reactivation causes toxoplasmic encephalitis in AIDS patients (1). In addition, infection of nonimmune women during pregnancy can lead to congenital infection, with hydrocephaly, microcephaly, or intracerebral calcifications occurring in the fetus (2).
Systemic infection by the proliferating stage of the parasite, the tachyzoite, is efficiently controlled by the cellular immune response. However, the pathogen persists in its slowly replicating stage, the bradyzoite, in tissue cysts mainly within the muscle and brain. In chronic infections, parasites within neurons can directly cause neuronal death and atrophy of neuronal processes, while inflammation via production of nitric oxide (NO) and inflammatory cytokines from microglia or immune cells may contribute to the death of neighboring neurons (3). However, the mechanisms underlying parasite-induced neuronal disorder in the brain remain unclear.
In mice and rats, the specificity of behavioral modifications induced by T. gondii has been examined across a broad range of behaviors that primarily concern anxiety and learned fear in these animals (4). Recently, it has been suggested that chronic infection with T. gondii can alter exploratory behaviors, risk assessment, and unconditioned fear responses and that these changes are related to the presence and the location of cysts within the animal (5). In addition, human studies suggest that chronic infection with T. gondii can cause cryptogenic epilepsy (6) and that individuals with schizophrenia have a higher prevalence of antibodies to T. gondii than healthy controls (7). Taken together, these findings suggest that chronic infection has a neuropathological and neurophysiological effect on immunocompetent hosts.
In this study, we investigated the gene expression profile in mouse brain infected with T. gondii using the whole-transcriptome shotgun-sequencing approach RNA sequencing (RNA-seq) in order to understand the functional changes in the central nervous system (CNS) during chronic T. gondii infection. We found that genes involved in immune responses and cell activation were upregulated in the mouse brain after T. gondii infection. In addition, the host genes whose expression was diminished by infection with the parasites were those involved in small-GTPase-mediated signal transduction and vesicle-mediated transport. Mice displaying clinical toxoplasmosis exhibited different gene expression profiles than did asymptomatic mice. These data from RNA-seq demonstrated that while immune responses were stimulated in the mouse brain during infection with T. gondii, neurological functioning was possibly diminished. Our findings provide important information that will assist in elucidation of the mechanisms underlying neurological changes during T. gondii infection and should aid development of novel drugs or treatments for toxoplasmosis.
MATERIALS AND METHODS
Mice.
BALB/c female mice were obtained from CLEA Japan (Tokyo, Japan). The mice were housed under specific-pathogen-free conditions in the animal facility of the National Research Center for Protozoan Diseases at the Obihiro University of Agriculture and Veterinary Medicine, Obihiro, Japan, before experimental use at 8 weeks of age. The mice used in this study were treated and used according to the Guiding Principles for the Care and Use of Research Animals published by the Obihiro University of Agriculture and Veterinary Medicine.
Parasite infections in mice.
T. gondii (strain PLK; type II) parasites were purified from an in vitro culture, washed in sterile phosphate-buffered saline (PBS), and then intraperitoneally inoculated (1 × 10³ parasites) into 8-week-old mice. Daily body weight measurements were taken for 32 days after infection, and all of the mice were checked regularly for clinical signs of T. gondii infection, such as head tilting, limb paralysis, circling motion, kyphosis, and febrile responses (e.g., a starry, stiff coat).
Brain sampling.
For pathological analysis, 15 mice were infected with T. gondii. After 32 days of infection, all of the experimental mice were sacrificed and their brains were rapidly removed. The brains were fixed with a 10% neutral buffered formalin solution for 8 days. We used these brains in the histopathological analysis. In a second experiment, 19 mice were divided into two groups; 4 mice were left uninfected, while 15 mice were infected with T. gondii. After 32 days of infection, 13 of the infected mice showed losses in body weight, while 2 did not. In this experiment, 12 infected mice out of the 13 mice that showed weight loss were used. For the detection of T. gondii in different areas of the brain, seven infected mice that showed body weight losses were selected. The brains from these seven infected mice were divided into eight different areas, the olfactory system, frontal lobe, caudate putamen, hippocampus, hypothalamus, amygdala, periaqueductal gray, and cerebellum. Samples to be used for DNA extraction and quantitative PCR of the parasites were stored at −20°C until use. For the detection of T. gondii in whole-brain samples and RNA-seq analysis, we used the 4 uninfected mice and 5 infected mice out of the total of 13 that showed weight loss. Of the five infected mice, two showed body weight loss with no signs of toxoplasmosis, whereas three showed signs of toxoplasmosis. The brains of the four uninfected mice and five infected mice were individually homogenized in 1 ml of TRI reagent (Sigma-Aldrich, Tokyo, Japan). Thereafter, each brain sample was divided for DNA extraction (for quantitative PCR of parasite numbers) and RNA extraction (for RNA-seq analysis). A flowchart summarizing the numbers of uninfected and infected mice, brain sampling, and methods is shown in Fig. 1.
Fig 1.

Flowchart explaining the numbers of uninfected and infected mice, brain sampling, and methods. In experiment 1, 15 mice were infected with T. gondii. After 32 days of infection, all of the mice were sacrificed, and the brains were fixed with a 10% neutral buffered formalin solution for histopathological analysis. In experiment 2, four uninfected mice and 12 infected mice were used. For the detection of T. gondii in different areas of the brain, the brains from seven infected mice were divided into eight different areas and used for DNA extraction and quantitative PCR of the parasites. For the detection of T. gondii in whole-brain samples and RNA-seq analysis, we used four uninfected mice and five infected mice. Each brain sample was used for DNA extraction (for quantitative PCR of parasite numbers) and RNA extraction (for RNA-seq analysis).
Pathological analysis.
After fixation with a 10% neutral buffered formalin solution, brain samples were cut coronally, embedded in paraffin wax, sectioned at 4 μm, and then stained with hematoxylin and eosin. To estimate the severity of the histopathological lesions, the lesions were scored using the following scheme; 0, no lesion; 1, minimal lesion limited to localized perivascular cuffs with slight mononuclear cell infiltration in the meninges; 2, mild lesion, including perivascular cuffs, meningitis, and local glial cell infiltration; 3, moderate lesion, including perivascular cuffs, meningitis, glial cell activation, focal necrosis, and rarefaction of the neuropil with occasional macrophage infiltration; 4, severe lesion, including perivascular cuffs, meningitis, glial cell activation, rarefaction of the neuropil, and focally extensive necrosis. The scores for all lesions were added for each area, and the total pathological score for each area was used for data analysis. Pathological lesions representing the different scores are shown in Fig. 2A to D.
Fig 2.
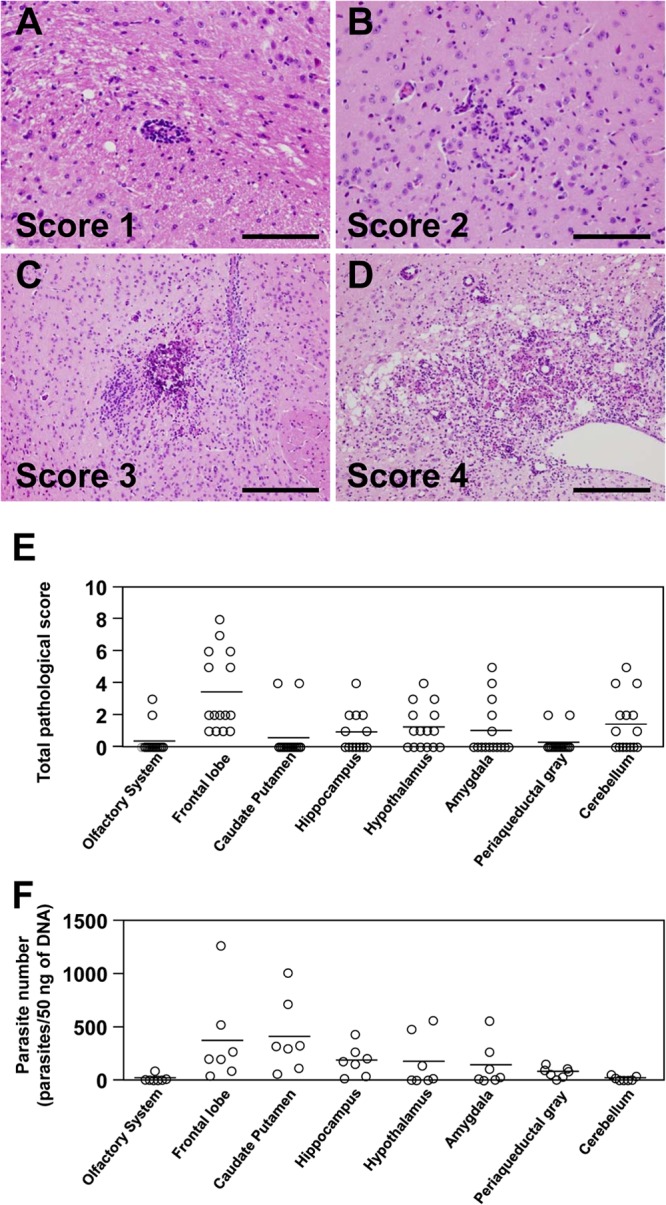
Parasite distributions in different areas of T. gondii-infected mouse brain. (A to D) Histopathological lesions associated with toxoplasmosis in mouse brain infected with T. gondii. PLK strain parasites (1 × 10³) were inoculated intraperitoneally into BALB/c mice (n = 15). At 32 days postinfection, all of the mice were sacrificed, and their brains were rapidly removed. After fixation, the brains were sectioned (4 μm) and stained with hematoxylin and eosin. To estimate the severity of the histopathological lesions, the lesions were scored as follows: (A) localized perivascular cuff (score, 1), (B) local gliosis (score, 2), (C) focal necrosis with calcification (score, 3), and (D) severe glial cell and macrophage infiltration and rarefaction of the neuropil in extensive necrotic foci (score, 4). Scale bars, 100 μm (A and B) or 200 μm (C and D). (E) The total pathological scores for different mouse brain areas were determined as described in Materials and Methods. (F) After DNA extraction from T. gondii-infected mouse brain samples (n = 7), parasite numbers were determined by real-time PCR using primers specific for the T. gondii B1 gene. Each circle represents data for one mouse, and bars represent the average values of all data points (E and F).
DNA extraction and quantitative PCR for T. gondii detection.
Brain samples from the T. gondii-infected mice were collected at 32 days postinfection. DNA was extracted by resuspending the brain samples in extraction buffer (0.1 M Tris-HCl, pH 9.9, 1% SDS, 0.1 M NaCl, 1 mM EDTA, 1 mg/ml proteinase K) and incubating them at 55°C. DNA was purified by phenol-chloroform extraction and ethanol precipitation. Amplification of parasite DNA was performed using primers specific for the T. gondii B1 gene (5′-AAC GGG CGA GTA GCA CCT GAG GAG-3′ and 5′-TGG GTC TAC GTC GAT GGC ATG ACA AC-3′), which is found in all known parasite strains (8). The PCR mixture (25-μl total volume) contained 1× SYBR green PCR buffer, 2 mM MgCl2, 200 μM concentrations of each deoxynucleoside triphosphate (dATP, dCTP, and dGTP), 400 μM dUTP, 0.625 U of AmpliTaq Gold DNA polymerase, 0.25 U of AmpErase uracil-N-glycosylase (AB Applied Biosystems, Carlsbad, CA), 0.5 μmol of each primer, and 50 ng of genomic DNA. Amplification was performed by a standard protocol recommended by the manufacturer (2 min at 50°C, 10 min at 95°C, 40 cycles at 95°C for 15 s, and 60°C for 1 min). Samples were run in duplicate. Amplification, data acquisition, and data analysis were carried out in an ABI Prism 7900HT Sequence Detection System (Applied Biosystems), and the calculated cycle threshold (Ct) values were exported to Microsoft Excel for analysis. A standard curve was established from T. gondii DNA extracted from 1 × 10⁵ parasites using 1 μl of a serial dilution ranging from 10,000 to 0.01 parasites. Parasite numbers were calculated by interpolation on a standard curve, with the Ct values plotted against a known concentration of parasites. After amplification, melting-curve data from the PCR products were acquired using stepwise increases in temperature from 60°C to 95°C. Data analysis was conducted using Dissociation Curves version 1.0 F (AB Applied Biosystems).
Transcriptome sequencing.
Samples underwent poly(A) selection starting with 1 μg of total RNA. Sequencing libraries were constructed with an RNA Sample Prep Kit (Illumina, San Diego, CA), which facilitates multiplex sequencing, according to the manufacturer's instructions. Thirty-six-base-pair single-end sequencing was performed using the Illumina Genome Analyzer IIx (Illumina) with the TruSeq SBS Kit v5-GA (36 cycle; Illumina) according to the manufacturer's instructions.
Aligning sequence tags to the mouse genome and RefSeq.
Raw sequence reads were mapped to the mouse genome (mm10) allowing two mismatches, using TopHat (ver. 1.3.3) (9) and gene transfer format (gtf) data (Mus_musculus.GRCm38.69). Normalized transcription profiles were estimated based on the mapping results using cufflinks (10). For each transcript, the number of fragments per kilobase of transcript per million fragments mapped (FPKM) was converted from the raw read counts. The MGI ID and gene ontology (GO) were obtained from the Mouse Genome Informatics database (11) and then integrated into the estimated expression profiles, together with the gene biotypes extracted from the gtf data.
Identification of differentially expressed genes.
Differentially expressed genes were identified by the DESeq package in R software (12), using a 2-fold change (log2 fold-change, >1 or <−1) and a 5% false-discovery rate (FDR) cutoff for the thresholds. After data normalization and FDR calculations, the resulting expression intensity values were analyzed by the MA plot-based method. The MA plots show on a logarithmic scale the relationship between the log2 fold change (M) for each gene and the average log2 signal intensity (A).
Gene ontology analysis.
The functions of individual genes can be analyzed using GOstat (http://gostat.wehi.edu.au/). This program automatically obtains the GO annotations from a database and generates a statistical analysis of the functional annotations that are overrepresented in the input list of genes. Using GOstat, we identified statistically overrepresented GO terms between the selected genes and the reference genes (all genes; 14,938 genes). Statistical analysis was performed using a Benjamini correction, which controls the FDR (13). FDRs of <0.05 were considered statistically significant.
Correlation coefficient between gene expression levels and parasite numbers.
The correlation coefficient between an FPKM value and the number of parasites in a mouse brain was calculated by using the Pearson correlation coefficient. Previous studies have shown that the strength of the linear association between pairs of variables can be determined using the Pearson correlation coefficient: |r| of >0.7, strong correlation (14, 15). The correlation coefficient range for positive correlations was 0.7 to 1.0, and the no-correlation range was −0.7 to 0.7, while a negative correlation was −0.7 to −1. Genes that exhibited positive or negative correlations with the number of parasites in a mouse brain were analyzed with GOstat.
RESULTS
Mice infected with T. gondii show the typical clinical features of toxoplasmosis.
The PLK strain was used for experimental infections of T. gondii in mice. At 32 days postinfection, the brains from infected mice were sampled, and a pathological analysis was conducted to estimate the severity of the brain lesions in the infected mice. Histopathological lesions, including perivascular cuffs, mononuclear cell meningitis, glial cell activation, and focal necrosis, were observed in all mice that had been infected with T. gondii. The number of lesions ranged from 0 to 3 in each area. A total score for each area was obtained by adding the scores of all lesions. Since most of the lesions that could be found in this study were not severe, the total score for each area was up to 8. The total pathological score for the frontal lobe sections was significantly higher than that for any other region of the brain tested (Fig. 2E). Although tissue cysts were detected in some lesions, the number of cysts was very small, and no tissue cyst tropism was confirmed by histopathology. We found that the parasites were distributed predominantly in the frontal lobe, caudate putamen, hippocampus, hypothalamus, and amygdala, but rarely (less than 50 parasites/50 ng DNA) in the olfactory system or cerebellum (Fig. 2F). The number of parasites in the caudate putamen was significantly higher than in the olfactory system and cerebellum. These results show that the mouse model of infection with T. gondii used in this study caused toxoplasmosis in mice and that the parasites were not uniformly distributed in the different regions of the brain in terms of their numbers and distribution patterns.
Mice infected with T. gondii have altered gene expression profiles in their brains.
Infected mice used in the transcriptome analysis showed the typical signs of toxoplasmosis infection: mouse 1 had a temporary decrease in body weight but recovered, mouse 2 also had decreased body weight, and mouse 3 showed slight signs of illness, whereas mice 4 and 5 had more serious signs of toxoplasmosis accompanied by limb paralysis. We found that, in general, higher numbers of parasites in the whole brain were associated with more serious signs of toxoplasmosis (Table 1).
Table 1.
Clinical signs of T. gondii infection and numbers of parasites in whole brains from infected mice
| Mouse no. | Clinical signs | No. of parasites/50 ng DNA |
|---|---|---|
| 1 | −a | 7.22 |
| 2 | −b | 10.85 |
| 3 | +c | 22.60 |
| 4 | ++d | 25.56 |
| 5 | ++d | 26.98 |
Temporary body weight loss and recovery.
Body weight loss.
Slight signs of illness.
Serious signs of toxoplasmosis.
RNA harvested from the brains of four uninfected and five infected mice was subjected to high-throughput sequencing on an Illumina Genome Analyzer IIx. The resulting raw reads were aligned to the mouse genome, mm10. Nine libraries (4 uninfected and 5 infected mice) were sequenced, and 33 to 47 million raw sequence reads were obtained per sample. Of these reads, 63.5% to 84.9% could be mapped to the mouse genome (Table 2).
Table 2.
Summary of short read sequences obtained in the study
| Infection status | Mouse no. | Total no. of reads | Total no. (%) of mapped reads |
|---|---|---|---|
| Uninfected | 1 | 34,772,709 | 26,326,157 (75.7) |
| 2 | 37,020,500 | 30,757,775 (83.1) | |
| 3 | 46,779,975 | 29,714,293 (63.5) | |
| 4 | 35,936,904 | 30,505,180 (84.9) | |
| Infected | 1 | 34,848,673 | 27,475,590 (78.8) |
| 2 | 33,543,793 | 28,045,473 (83.6) | |
| 3 | 43,530,348 | 35,239,167 (81.0) | |
| 4 | 41,635,845 | 33,935,135 (81.5) | |
| 5 | 36,714,758 | 28,749,909 (78.3) |
To identify differentially expressed genes in the experimental groups, the transcriptome data from uninfected or T. gondii-infected mouse brains were analyzed by DESeq. The magnitude distribution of the significantly changed genes was illustrated by MA plot analysis (Fig. 3). The expression levels of 935 genes from the brains of mice infected with T. gondii were more significantly upregulated than those of genes from the brains of uninfected mice. The top 30 genes that were upregulated after infection with T. gondii are listed in Table 3. In particular, genes for immunoglobulins (Ighg2c, Iglc2, and Igj), chemokines and chemokine receptors (Cxcl9, Cxcr6, Ccl8, Ccl5, Cxcl10, and Cxcr3), interferon (IFN)-inducible GTPase families (Tgtp2, Iigp1, Gbp8, Gbp4, and Igtp), and major histocompatibility complex (MHC) class II antigens (CD74, H2-Eb1, H2-Q7, and H2-Aa) were greatly upregulated in the brains of all of the infected mice. In contrast, only 12 genes were significantly downregulated in the infected mice (Table 4). Of these genes, the Fc receptor-like S, scavenger receptor (Fcrls) gene was clearly downregulated in the infected mouse brains. When the functional annotations of the genes upregulated by T. gondii infection were analyzed using GOstat, the GO terms associated with immune system processes, immune responses, and cell activation were significantly different in the upregulated genes and the reference genes (Table 5).
Fig 3.
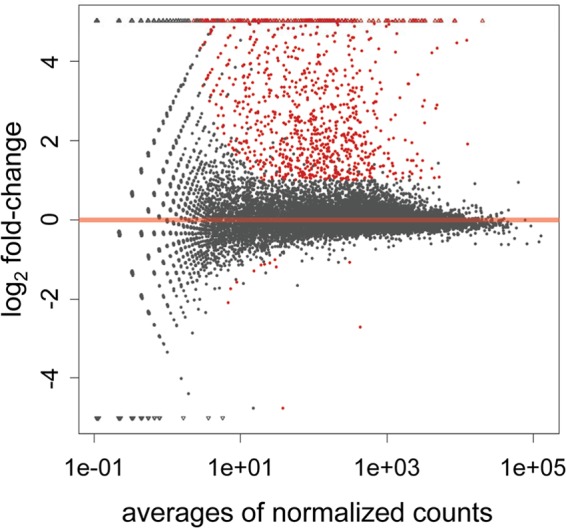
Differential-expression analysis of uninfected and T. gondii-infected mouse brains. Differential gene expression was analyzed using the DESeq R package and plotted as an MA plot of log2 fold change versus the averages of the normalized counts. Each point represents a gene (circle) or a novel transcribed unit (triangle). Genes marked in red were detected as differentially expressed at a 5% FDR with more than a 2-fold change between an uninfected and a T. gondii-infected mouse.
Table 3.
Top 30 genes significantly (>2-fold change and FDR of <0.05) upregulated in T. gondii-infected mouse brains
| Gene symbol | Description | Avg FPKM |
Fold change | FDR | |
|---|---|---|---|---|---|
| Uninfected (n = 4) | Infected (n = 5) | ||||
| Ighg2c | Immunoglobulin heavy constant gamma 2C | 0.34 | 512.70 | 1,502.98 | 2.17E−84 |
| Cd8a | CD8 antigen, alpha chain | 0.00 | 4.03 | 1,336.42 | 2.99E−92 |
| Cxcl9 | Chemokine (C-X-C motif) ligand 9 | 0.01 | 14.52 | 1,163.61 | 7.31E−52 |
| F830016B08Rik | Riken cDNA F830016B08 gene | 0.00 | 2.99 | 1,056.50 | 2.38E−27 |
| Iglc2 | Immunoglobulin lambda constant 2 | 0.02 | 16.87 | 818.64 | 3.18E−30 |
| Nkg7 | Natural killer cell group 7 sequence | 0.01 | 7.85 | 604.41 | 6.92E−28 |
| Gimap7 | GTPase; IMAP family member 7 | 0.01 | 3.79 | 485.67 | 6.19E−54 |
| Cxcr6 | Chemokine (C-X-C motif) receptor 6 | 0.01 | 4.64 | 456.81 | 1.75E−75 |
| Saa3 | Serum amyloid A 3 | 0.12 | 60.42 | 454.19 | 3.65E−07 |
| Cd74 | CD74 antigen (invariant polypeptide of major histocompatibility complex class II antigen associated) | 2.57 | 1,156.68 | 428.38 | 1.29E−156 |
| H2-Eb1 | Histocompatibility 2, class II antigen E beta | 0.81 | 343.45 | 423.75 | 0 |
| Ccl8 | Chemokine (C-C motif) ligand 8 | 0.08 | 35.03 | 411.74 | 4.48E−21 |
| Gm4951 | Predicted gene 4951 | 0.02 | 8.03 | 389.67 | 3.33E−168 |
| Tgtp2 | T-cell-specific GTPase 2 | 0.10 | 12.71 | 389.25 | 7.26E−131 |
| Gbp8 | Guanylate binding protein 8 | 0.03 | 9.63 | 321.55 | 9.82E−72 |
| Ccl5 | Chemokine (C-C motif) ligand 5 | 0.38 | 119.55 | 308.17 | 5.48E−20 |
| Klrk1 | Killer cell lectin-like receptor subfamily K, member 1 | 0.01 | 1.85 | 303.49 | 4.85E−35 |
| Igj | Immunoglobulin joining chain | 0.77 | 164.65 | 288.55 | 3.47E−16 |
| H2-Q7 | Histocompatibility 2, Q region locus 7 | 0.05 | 16.07 | 283.24 | 1.66E−79 |
| Iigp1 | Interferon-inducible GTPase 1 | 0.17 | 49.88 | 282.04 | 2.99E−248 |
| H2-Aa | Histocompatibility 2, class II antigen A, alpha | 1.60 | 429.18 | 274.50 | 1.42E−74 |
| Cst7 | Cystatin F (leukocystatin) | 0.05 | 14.50 | 261.87 | 4.78E−49 |
| Zbp1 | Z-DNA binding protein 1 | 0.06 | 22.41 | 242.11 | 1.91E−79 |
| Cxcl10 | Chemokine (C-X-C motif) ligand 10 | 0.17 | 32.56 | 232.25 | 1.07E−37 |
| Gzma | Granzyme A | 0.01 | 2.65 | 215.56 | 1.71E−32 |
| Cxcr3 | Chemokine (C-X-C motif) receptor 3 | 0.02 | 3.42 | 204.06 | 1.46E−33 |
| Slfn1 | Schlafen 1 | 0.01 | 2.11 | 200.08 | 2.45E−48 |
| Gbp4 | Guanylate binding protein 4 | 0.21 | 42.18 | 195.87 | 3.05E−118 |
| Rnase6 | RNase, RNase A family, 6 | 0.01 | 1.81 | 187.05 | 2.51E−30 |
| Igtp | gAmma interferon-induced GTPase | 0.87 | 161.60 | 180.55 | 0 |
Table 4.
Top 30 genes significantly (>2-fold change and FDR of <0.05) downregulated in T. gondii-infected mouse brains
| Gene symbol | Description | Avg FPKM |
Fold change | FDR | |
|---|---|---|---|---|---|
| Uninfected (n = 4) | Infected (n = 5) | ||||
| Fcrls | Fc receptor-like S, scavenger receptor | 1.35 | 0.08 | 0.04 | 6.67E−45 |
| BC037034 | cDNA sequence BC037034 | 11.87 | 1.84 | 0.15 | 1.78E−06 |
| Cbr2 | Carbonyl reductase 2 | 0.88 | 0.24 | 0.23 | 3.24E−04 |
| Fcna | Ficolin A | 0.41 | 0.11 | 0.30 | 1.81E−03 |
| Matn1 | Matrilin 1, cartilage matrix protein | 0.26 | 0.09 | 0.34 | 1.56E−03 |
| 2010110P09Rik | Calcineurin-like EF hand protein 2 | 1.02 | 0.35 | 0.41 | 5.97E−04 |
| Nkx3-1 | NK-3 transcription factor, locus 1 (Drosophila) | 0.50 | 0.22 | 0.44 | 1.93E−05 |
| Hsbp1l1 | Heat shock factor binding protein 1-like 1 | 0.88 | 0.40 | 0.45 | 7.32E−04 |
| Prss22 | Protease, serine, 22 | 0.91 | 0.42 | 0.46 | 6.73E−04 |
| Sh2d4b | SH2 domain containing 4B | 0.57 | 0.27 | 0.47 | 3.16E−04 |
| Fam57a | Family with sequence similarity 57, member A | 6.63 | 3.91 | 0.48 | 2.71E−06 |
| Aldh1a7 | Aldehyde dehydrogenase family 1, subfamily A7 | 0.74 | 0.37 | 0.50 | 3.01E−04 |
Table 5.
Top 30 GO terms for the genes that were significantly upregulated in mouse brains after infection with T. gondii
| Accession no. | GO term | Reference genes |
Upregulated genes |
FDR | ||
|---|---|---|---|---|---|---|
| No. | % | No. | % | |||
| GO:0002376 | Immune system process | 566 | 4.1 | 215 | 27.4 | 0 |
| GO:0006955 | Immune response | 346 | 2.5 | 159 | 20.3 | 0 |
| GO:0006952 | Defense response | 353 | 2.5 | 116 | 14.8 | 3.69E−84 |
| GO:0009897 | External side of plasma membrane | 121 | 0.9 | 63 | 8.1 | 1.90E−70 |
| GO:0009986 | Cell surface | 168 | 1.2 | 73 | 9.3 | 1.59E−69 |
| GO:0001775 | Cell activation | 202 | 1.4 | 74 | 9.5 | 3.09E−59 |
| GO:0045321 | Leukocyte activation | 189 | 1.4 | 71 | 9.1 | 2.57E−58 |
| GO:0002682 | Regulation of immune system process | 92 | 0.7 | 50 | 6.4 | 1.21E−57 |
| GO:0050776 | Regulation of immune response | 90 | 0.6 | 49 | 6.3 | 1.44E−56 |
| GO:0006954 | Inflammatory response | 178 | 1.3 | 67 | 8.6 | 4.03E−55 |
| GO:0046649 | Lymphocyte activation | 173 | 1.2 | 63 | 8.1 | 6.86E−50 |
| GO:0009611 | Response to wounding | 252 | 1.8 | 76 | 9.7 | 4.23E−49 |
| GO:0002684 | Positive regulation of immune system process | 78 | 0.6 | 42 | 5.4 | 9.32E−48 |
| GO:0009605 | Response to external stimulus | 393 | 2.8 | 95 | 12.1 | 5.89E−47 |
| GO:0050778 | Positive regulation of immune response | 76 | 0.5 | 41 | 5.2 | 1.08E−46 |
| GO:0051239 | Regulation of multicellular organismal process | 250 | 1.8 | 73 | 9.3 | 2.32E−45 |
| GO:0051249 | Regulation of lymphocyte activation | 76 | 0.5 | 40 | 5.1 | 1.47E−44 |
| GO:0050865 | Regulation of cell activation | 79 | 0.6 | 40 | 5.1 | 4.72E−43 |
| GO:0002252 | Immune effector process | 113 | 0.8 | 47 | 6.0 | 2.72E−42 |
| GO:0051240 | Positive regulation of multicellular organismal process | 96 | 0.7 | 43 | 5.5 | 1.88E−41 |
| GO:0042110 | T cell activation | 112 | 0.8 | 45 | 5.8 | 5.00E−39 |
| GO:0045087 | Innate immune response | 78 | 0.6 | 37 | 4.7 | 2.19E−37 |
| GO:0002520 | Immune system development | 228 | 1.6 | 62 | 7.9 | 5.12E−35 |
| GO:0002443 | Leukocyte-mediated immunity | 81 | 0.6 | 36 | 4.6 | 3.89E−34 |
| GO:0005886 | Plasma membrane | 1,476 | 10.6 | 188 | 24.0 | 4.56E−33 |
| GO:0046651 | Lymphocyte proliferation | 70 | 0.5 | 33 | 4.2 | 5.50E−33 |
| GO:0032943 | Mononuclear cell proliferation | 70 | 0.5 | 33 | 4.2 | 5.50E−33 |
| GO:0002449 | Lymphocyte-mediated immunity | 75 | 0.5 | 34 | 4.3 | 8.23E−33 |
| GO:0002250 | Adaptive immune response | 73 | 0.5 | 33 | 4.2 | 1.00E−31 |
| GO:0002460 | Adaptive immune response based on somatic recombination of immune receptors built from immunoglobulin superfamily domains | 73 | 0.5 | 33 | 4.2 | 4.68E−25 |
Gene expression levels are correlated with the number of parasites in the brain.
To investigate whether correlations exist between an FPKM value and the number of parasites in an infected mouse brain, correlation coefficients were calculated. Five hundred and six genes were positively correlated with the number of parasites measured, while 473 genes had negative correlations. GOstat analysis showed that genes that exhibited a positive correlation with the number of parasites present were associated with immune system processes and antigen presentation (Table 6). In contrast, the statistically overrepresented GO terms for the genes that showed negative correlations with parasite numbers included small-GTPase-mediated signal transduction, GTP or guanyl nucleotide binding, vesicle formation (vesicle-mediated transport, cytoplasmic vesicle, coated vesicle, membrane-bound vesicle, and vesicle membrane), and cation transport (Table 7). These results show that T. gondii stimulated the murine immune response and diminished signal transduction and vesicle formation, both of which regulate neurological functions in the brain.
Table 6.
Statistically overrepresented top 30 GO terms (FDR < 0.05) for genes showing positive correlations with the number of parasites present in mouse brains following infection with T. gondii
| Accession no. | GO term | Reference genes |
Genes positively correlated with parasite no. |
FDR | ||
|---|---|---|---|---|---|---|
| No. | % | No. | % | |||
| GO:0002376 | Immune system process | 566 | 3.8 | 83 | 18.4 | 2.05E−47 |
| GO:0006955 | Immune response | 346 | 2.3 | 57 | 12.6 | 4.54E−37 |
| GO:0000323 | Lytic vacuole | 153 | 1.0 | 32 | 7.1 | 6.70E−27 |
| GO:0005764 | Lysosome | 153 | 1.0 | 32 | 7.1 | 6.70E−27 |
| GO:0005773 | Vacuole | 173 | 1.2 | 32 | 7.1 | 4.27E−23 |
| GO:0019882 | Antigen processing and presentation | 43 | 0.3 | 27 | 6.0 | 1.52E−20 |
| GO:0006952 | Defense response | 353 | 2.4 | 44 | 9.7 | 1.02E−18 |
| GO:0048002 | Antigen processing and presentation of peptide antigen | 28 | 0.2 | 22 | 4.9 | 4.95E−18 |
| GO:0019884 | Antigen processing and presentation of exogenous antigen | 22 | 0.1 | 15 | 3.3 | 3.83E−11 |
| GO:0042611 | MHC protein complex | 19 | 0.1 | 14 | 3.1 | 1.15E−10 |
| GO:0009605 | Response to external stimulus | 393 | 2.6 | 38 | 8.4 | 4.78E−10 |
| GO:0002478 | Antigen processing and presentation of exogenous peptide antigen | 17 | 0.1 | 13 | 2.9 | 5.18E−10 |
| GO:0019886 | Antigen processing and presentation of exogenous peptide antigen via MHC class II | 15 | 0.1 | 12 | 2.7 | 2.38E−09 |
| GO:0002495 | Antigen processing and presentation of peptide antigen via MHC class II | 15 | 0.1 | 12 | 2.7 | 2.38E−09 |
| GO:0002504 | Antigen processing and presentation of peptide or polysaccharide antigen via MHC class II | 16 | 0.1 | 12 | 2.7 | 3.79E−09 |
| GO:0001775 | Cell activation | 202 | 1.4 | 24 | 5.3 | 1.10E−08 |
| GO:0002474 | Antigen processing and presentation of peptide antigen via MHC class I | 14 | 0.1 | 11 | 2.4 | 1.81E−08 |
| GO:0006954 | Inflammatory response | 178 | 1.2 | 22 | 4.9 | 2.00E−08 |
| GO:0009611 | Response to wounding | 252 | 1.7 | 27 | 6.0 | 2.42E−08 |
| GO:0045321 | Leukocyte activation | 189 | 1.3 | 22 | 4.9 | 1.33E−07 |
| GO:0004930 | G-protein-coupled receptor activity | 1,303 | 8.7 | 2 | 0.4 | 3.15E−07 |
| GO:0001584 | Rhodopsin-like receptor activity | 1,195 | 8.0 | 1 | 0.2 | 7.35E−07 |
| GO:0016064 | Immunoglobulin-mediated immune response | 55 | 0.4 | 14 | 3.1 | 3.58E−06 |
| GO:0019724 | B cell-mediated immunity | 56 | 0.4 | 14 | 3.1 | 4.18E−06 |
| GO:0007600 | Sensory perception | 1,144 | 7.7 | 2 | 0.4 | 4.68E−06 |
| GO:0050877 | Neurological-system process | 1,346 | 9.0 | 6 | 1.3 | 6.59E−06 |
| GO:0042612 | MHC class I protein complex | 11 | 0.1 | 8 | 1.8 | 8.80E−06 |
| GO:0046649 | Lymphocyte activation | 173 | 1.2 | 19 | 4.2 | 9.08E−06 |
| GO:0007606 | Sensory perception of chemical stimulus | 965 | 6.5 | 0 | 0.0 | 1.16E−05 |
| GO:0002449 | Lymphocyte-mediated immunity | 75 | 0.5 | 15 | 3.3 | 1.35E−05 |
Table 7.
Statistically overrepresented GO terms (FDR < 0.05) for the genes showing negative correlations with the number of parasites present in mouse brains following infection with T. gondii
| Accession no. | GO term | Reference genes |
Genes negatively correlated with parasite no. |
FDR | ||
|---|---|---|---|---|---|---|
| No. | % | No. | % | |||
| GO:0007264 | Small-GTPase-mediated signal transduction | 308 | 2.1 | 27 | 6.7 | 7.14E−06 |
| GO:0016192 | Vesicle-mediated transport | 375 | 2.5 | 30 | 7.5 | 1.05E−05 |
| GO:0005737 | Cytoplasm | 4,861 | 32.5 | 187 | 46.5 | 1.47E−05 |
| GO:0006810 | Transport | 2,099 | 14.1 | 97 | 24.1 | 3.81E−05 |
| GO:0031410 | Cytoplasmic vesicle | 270 | 1.8 | 23 | 5.7 | 6.59E−05 |
| GO:0005525 | GTP binding | 271 | 1.8 | 23 | 5.7 | 6.59E−05 |
| GO:0051234 | Establishment of localization | 2,152 | 14.4 | 97 | 24.1 | 8.97E−05 |
| GO:0031982 | Vesicle | 277 | 1.9 | 23 | 5.7 | 8.97E−05 |
| GO:0032561 | Guanyl ribonucleotide binding | 279 | 1.9 | 23 | 5.7 | 8.97E−05 |
| GO:0019001 | Guanyl nucleotide binding | 279 | 1.9 | 23 | 5.7 | 8.97E−05 |
| GO:0051179 | Localization | 2,430 | 16.3 | 104 | 25.9 | 3.25E−04 |
| GO:0044444 | Cytoplasmic part | 2,791 | 18.7 | 115 | 28.6 | 4.68E−04 |
| GO:0030136 | Clathrin-coated vesicle | 70 | 0.5 | 12 | 3.0 | 6.28E−04 |
| GO:0016023 | Cytoplasmic-membrane-bound vesicle | 175 | 1.2 | 16 | 4.0 | 6.92E−04 |
| GO:0005794 | Golgi apparatus | 513 | 3.4 | 32 | 8.0 | 9.89E−04 |
| GO:0031988 | Membrane-bound vesicle | 182 | 1.2 | 16 | 4.0 | 1.30E−03 |
| GO:0030135 | Coated vesicle | 83 | 0.6 | 12 | 3.0 | 2.03E−03 |
| GO:0051649 | Establishment of cellular localization | 653 | 4.4 | 37 | 9.2 | 2.03E−03 |
| GO:0051641 | Cellular localization | 662 | 4.4 | 37 | 9.2 | 2.80E−03 |
| GO:0044433 | Cytoplasmic vesicle part | 47 | 0.3 | 9 | 2.2 | 3.30E−03 |
| GO:0015672 | Monovalent inorganic-cation transport | 276 | 1.8 | 20 | 5.0 | 3.78E−03 |
| GO:0007242 | Intracellular signaling cascade | 909 | 6.1 | 46 | 11.4 | 4.24E−03 |
| GO:0003001 | Generation of a signal involved in cell-cell signaling | 82 | 0.5 | 11 | 2.7 | 6.90E−03 |
| GO:0012506 | Vesicle membrane | 54 | 0.4 | 9 | 2.2 | 7.82E−03 |
| GO:0030672 | Synaptic-vesicle membrane | 11 | 0.1 | 5 | 1.2 | 8.76E−03 |
| GO:0015986 | ATP synthesis-coupled proton transport | 31 | 0.2 | 7 | 1.7 | 1.01E−02 |
| GO:0015985 | Energy-coupled proton transport down electrochemical gradient | 31 | 0.2 | 7 | 1.7 | 1.01E−02 |
| GO:0045055 | Regulated secretory pathway | 60 | 0.4 | 9 | 2.2 | 1.47E−02 |
| GO:0006812 | Cation transport | 439 | 2.9 | 26 | 6.5 | 1.62E−02 |
| GO:0005622 | Intracellular | 7,756 | 51.9 | 249 | 61.9 | 1.63E-02 |
Mice exhibiting clinical toxoplasmosis had gene expression profiles different from those lacking the signs of clinical disease.
Differences were observed in the severity of toxoplasmosis among the infected animals. Mice 3, 4, and 5 showed signs of toxoplasmosis, whereas mice 1 and 2 did not. To identify differences in the gene expression profiles of the mice exhibiting clinical signs (mice 3, 4, and 5) versus mice lacking such signs (mice 1 and 2), the differentially expressed genes were analyzed with DESeq. The expression levels of interferon regulatory factor 4 (Irf4) and transforming growth factor beta induced (Tgfbi) were higher in the mice with clinical signs than in those without signs. In contrast, the expression level of early growth response 4 (Egr4) was significantly lower than in the mice lacking the clinical signs of toxoplasmosis (Table 8). These results show that mice displaying clinical toxoplasmosis exhibited different gene expression profiles than those that did not, and genes that showed different expression levels in these two groups of mice are likely to be associated with toxoplasmosis.
Table 8.
Genes significantly (>2-fold change and FDR of <0.05) altered in brain samples from mice exhibiting clinical signs of toxoplasmosis
| Gene symbol | Description | Avg FPKM |
FPKM fold change | FDR | |
|---|---|---|---|---|---|
| No sign (n = 2) | Clinical signs (n = 3) | ||||
| Irf4 | Interferon regulatory factor 4 | 0.84 | 1.88 | 2.24 | 6.00E−03 |
| Tgfbi | Transforming growth factor beta induced | 3.22 | 6.81 | 2.11 | 2.65E−03 |
| Egr4 | Early growth response 4 | 28.77 | 13.16 | 0.46 | 5.27E−06 |
DISCUSSION
It has been reported that T. gondii modifies the behavior of its intermediate hosts when the infection proceeds into its latent phase, which is characterized by the presence of parasite cysts in the brain. Infected rodents show impaired learning and memory, as well as increased activity (16). Furthermore, persistent T. gondii infection has been associated with an increased rate of serious psychiatric disorders and suicide and decreased psychomotor performance in humans (17), which might be caused by neuropathological and neurophysiological effects on this intermediate host. Hence, there is a strong desire to understand the changes of brain gene expression during T. gondii infection in order to elucidate the mechanisms for neuronal disorder. In this study, we first investigated the gene expression profile in mouse brains infected with T. gondii using the whole-transcriptome shotgun-sequencing approach RNA-seq. The results showed that not only were the host immune responses in the brain stimulated by infection with T. gondii, but expression of genes related to neuronal function, such as GTPase-mediated signal transduction, GTP or guanyl nucleotide binding, vesicle formation, and cation transport, decreased when higher numbers of parasites were present in the brain, as shown by the RNA-seq data. These results suggest that certain aspects of neurological function may have diminished during T. gondii infection.
In this study, we developed a mouse model of acute/subacute T. gondii infection that incorporated behavior and transcriptome changes accompanied by pathological changes in the brain using BALB/c mice at 32 days after infection. In general, BALB/c mice are more resistant to T. gondii infection than other mouse strains (18–20), because a single decapeptide, HF10 (HPGSVNEFDF), derived from the dense granule protein 6 (GRA6), was found to be the immunodominant Ld-restricted epitope that induced protective effects in H-2d (BALB/c) mice infected with the Prugneaud type II T. gondii strain (21). Indeed, recent studies that have analyzed the frequency of neurological symptoms in mice used strains such as C57BL/6 (22, 23), CD1 (24), and SW (3) at 6 to 18 weeks postinfection. Some researchers have used BALB/c mice to analyze behavior changes in the mice at 2 and 6 months after T. gondii infection (5, 25). Therefore, the mouse model of T. gondii infection in BALB/c mice used in the present study could be used for evaluating toxoplasmosis at an earlier stage after infection than in the studies described above.
In a related study, analysis of gene expression in a chronically T. gondii-infected mouse brain model using full-genome microarrays showed that expression of genes such as those encoding suppression of cytokine signaling (SOCS1), CD36, complement component 1 (C1q), and glial fibrillary acidic protein (GFAP) increased (3). Consistent with these findings, our data showed that particular genes were upregulated (SOCS1, 6.3-fold; CD36, 3.9-fold; C1q, 7.2-fold; and GFAP, 4.0-fold) after infection with T. gondii, although we used different mouse and parasite strains and infection periods.
T. gondii infection resulted in upregulation of IFN-inducible GTPase families and chemokines. A recent study suggested that IFN-γ-inducible p65 GTPases, including Gbp1, Gbp2, Gbp3, Gbp5, and Gbp7, play pivotal roles in anti-T. gondii host defense mechanisms by controlling IFN-γ-mediated Irgb6-dependent cellular innate immunity (26). Although the functions of Gbp4 and Gbp8 in T. gondii infection are not understood, these molecules might be associated with IFN-γ-dependent host defense. Furthermore, previous research has shown that CXCL9/MIG, CXCL10/IP-10, and CCL5/RANTES are chemokines predominantly induced in the brains of BALB/c mice during chronic infection with T. gondii (27).
After proliferation of tachyzoites in various organs during the acute stage of infection, the parasite forms cysts preferentially in the brain and establishes a chronic infection, which is a balance between host immunity and parasite evasion of immune responses (28). The presence of Th1 cytokines in the brain parenchyma may cause activation of microglia, resulting in the production of toxic metabolites and inflammatory cytokines (29–32). In this study, the genes involved in the immune response and cell activation were upregulated after T. gondii infection. In the brain, microglia assume an important role in the production of inflammatory cytokines, as well as antigen-presenting cells, such as dendritic cells and macrophages from the blood. Further experiments are needed to understand what kinds of cells express the genes involved in the immune response in the brain during T. gondii infection.
In this study, Fcrls expression was significantly downregulated in mice infected with T. gondii. Fcrls, also known as macrophage scavenger receptor 2 (Msr2), is a scavenger receptor for which very little information is available and whose specific expression in microglia is intriguing, since scavenger receptors are normally widely expressed in monocytic cells (33). In addition, Fcrls was preferentially expressed by microglia and upregulated during cuprizone-induced inflammation (34). The downregulation of Fcrls expression in T. gondii-infected mouse brain might be associated with modulation of the function of microglia.
A recent study has shown that T. gondii infection of mammalian dopaminergic PC-12 cells enhanced the K+-induced release of dopamine severalfold, with a direct correlation observed between the number of infected cells and the quantity of dopamine released. This effect was related to T. gondii orchestration of a significant increase in dopamine metabolism via tyrosine hydroxylase production, which is the rate-limiting enzyme for dopamine synthesis in neural cells (35). Furthermore, in vitro experiments demonstrated that tachyzoites actively prevented the normal Ca2+ responses of glutamate-stimulated neurons; hence, it was suggested that T. gondii infects neurons and may directly modulate neuronal function (5). In this study, genes that were identified as being negatively correlated with parasite numbers were involved in small-GTPase-mediated signal transduction and GTP or guanyl nucleotide binding. The activities of small GTPases are regulated by their guanine nucleotide-binding states (36). Small GTPases play critical roles in molecular processing underlying neuronal plasticity and memory formation (37), axonogenesis (38), and CNS development (39). These small GTPases play indispensable roles in the CNS; hence, loss-of-function mutations in these molecules cause genetic diseases in mice and humans (40). In addition, expression of genes associated with vesicle formation, such as vesicle-mediated transport, cytoplasmic vesicles, coated vesicles, membrane-bound vesicles, and vesicle membranes, was diminished when large numbers of parasites were present in the brain. Vesicle-mediated transport is important in the docking of synaptic vesicles to the presynaptic plasma membrane, their signal-dependent fusion, and release of neurotransmitters at the synapse (41). The expression of genes related to cation transport also decreased when large numbers of T. gondii parasites were present in the brain. Cation transporters mediate facilitated diffusion of a variety of endogenous substances and drugs (42). These transporters are relevant to Parkinson's disease, which is a progressive disease related to degeneration of nigrostriatal dopaminergic neurons and which can be caused by genetic and environmental factors (43). From this evidence, it is suggested that diminished gene expression associated with neuronal function may cause neuronal disorders as a result of T. gondii infection.
It is possible that toxoplasmosis is related to upregulation of Irf4 and Tgfbi. Irf4 belongs to the IRF family of transcription factors, which have emerged as crucial controllers of both interleukin 17 (IL-17) and IL-21 production. These cytokines are presumed to be responsible for the development of autoimmune responses (44). It has been reported that macrophages and a dendritic cell line infected with type III T. gondii expressed Irf4 mRNA at a higher level than the cells infected with type II parasites (45). Tgfbi, a secreted protein that is induced by transforming growth factor beta in various cell types, has roles in the regulation of bone mass and bone size through periosteal bone formation (46). Tgfbi has also been shown to be a tumor suppressor factor; transfection of the Tgfbi gene into tumor cells resulted in a significant reduction in tumor growth, while Tgfbi-deficient mice showed an increased incidence of spontaneous tumors (47). However, there are no published studies on the function of Tgfbi in T. gondii infection.
In the present study, Egr4 expression in mice displaying the clinical signs of toxoplasmosis was lower than in mice displaying no such signs. Egr4 has the most neuron-specific expression pattern and induces activation of the neuronal potassium chloride cotransporter 2 (KCC2), which is necessary for the fast synaptic inhibition required for maintaining the low intracellular chloride concentration that is needed for the hyperpolarizing actions of the inhibitory neurotransmitters GABA and glycine (48, 49). Thus, these genes (Irf4, Tgfbi, and Egr4 genes) may be associated with the development of toxoplasmosis or change of neuronal function.
It would be interesting to understand why particular areas of the brain accumulate cysts during chronic T. gondii infection. Cyst accumulation in different areas of a particular neuronal circuit may lead to different behavioral alterations. A recent study on the relationship between cyst accumulation and behavioral changes in the host has shown that BALB/c mice infected with the DX strain of T. gondii (a type II strain) lost their fear of the smell of cat urine and spent a significantly longer time in close proximity to cat urine than the uninfected controls (at day 60 postinfection). In addition, the numbers of cysts decreased in the cortex, thalamus, hippocampus, and striatum but were unaltered in the hypothalamus, amygdala, olfactory bulb, cerebellum, and brain stem at day 60 compared with day 30 postinfection (5). Furthermore, the striking differences in the total parasite load and cyst distribution indicate a probabilistic nature of brain infestation. Nevertheless, some brain regions are consistently more infected than others. In a different study, it was found that these included the olfactory bulb; the entorhinal, somatosensory, motor and orbital, frontal association, and visual cortices; and, importantly, the hippocampus and amygdala (24). Consistent with previous reports (24, 50), the histopathological lesions in the frontal lobe were more severe than in the other areas of the brain. However, higher frequencies of parasites were detected in the frontal lobe and caudate putamen than in the other brain areas (using PCR) in our study. The severity of the histopathological brain lesions had no strong association with the number of parasites present in the T. gondii-infected mice. It has been reported that neurons in the cortex were more damaged by oxygen and glucose deprivation than those in the hippocampus and striatum as a result of differences in the antioxidant state and Bcl-xL expression levels in these brain regions (51). In addition, histopathology showed that the number of infiltrating glial cells was higher in the frontal lobe than in the other regions of the brain (data not shown), suggesting that the frontal lobe neurons might have been more sensitive to toxic inflammatory factors from infiltrating glial cells than other regions of the brain. Therefore, the PLK strain also provokes inflammation mainly in the frontal lobe.
Upon entry into the CNS, tachyzoites appear to infect astrocytes, neurons, and microglia. Microglia generate pro- and anti-inflammatory cytokines and chemokines following T. gondii infection (52–55). In addition to microglia, astrocytes can also inhibit parasite replication upon activation (56). Inflammatory cytokines and NO produced by microglia may cause damage to neurons. The term “psychoneuroimmunology” relates to the complex bidirectional interactions that occur between the CNS and the immune system. Because T. gondii infection modulates immune function, there might be feedback from the immune system to the brain. However, neurons are the predominantly infected cell type during chronic infection with T. gondii, so parasites may be able to directly change the function of neurons. Neurons play an important role in sending and receiving messages through chemical or electrical signals. Signals are sent to and from the CNS via action potentials that allow the signals to travel by changing the concentration of ions (sodium outside and potassium inside) within the axons and dendrites.
In the present study, we found that host immune responses accompanied by cell activation and antigen presentation were stimulated by infection with T. gondii in the mouse brain. Our data suggest the possibility that T. gondii infection of the brain may disrupt neuronal function by decreasing small-GTPase-mediated signal transduction, vesicle formation, and cation transport. Some genes that showed different expression patterns in the brains of the infected, but not the uninfected, mice may play critical roles in the type of neuronal disorder associated with T. gondii infection. Overall, our data provide new and important information about host responses to T. gondii infection of the brain that provides a platform to dissect the mechanisms underlying T. gondii-induced neurological changes and assists in the development of effective treatments for toxoplasmosis. Further studies are needed to elucidate the function of genes that are up- or downregulated after infection with T. gondii in the immune and neuronal systems. Use of small interfering RNA (siRNA) and overexpression of host genes may help illuminate aspects of the host-parasite relationship that are crucial for parasite survival and host pathology during T. gondii infection. Importantly, further studies on CNS-immune system interactions and the behavioral changes that occur during chronic infection with T. gondii should lead to greater understanding of toxoplasmosis.
ACKNOWLEDGMENTS
We thank Youko Matsushita, Megumi Noda, and Yoshie Imura for excellent technical assistance.
This research was supported by the Japan Society for the Promotion of Science through the Funding Program for Next Generation World-Leading Researchers (NEXT Program), initiated by the Council for Science and Technology Policy (2011/LS003), and a Grant-in-Aid for Research Activity Start-up (24880006) from JSPS, Japan.
Footnotes
Published ahead of print 15 July 2013
REFERENCES
- 1.Luft BJ, Conley F, Remington JS, Laverdiere M, Wagner KF, Levine JF, Craven PC, Strandberg DA, File TM, Rice N, Meunier-Carpentier F. 1983. Outbreak of central-nervous-system toxoplasmosis in western Europe and North America. Lancet i:781–784 [DOI] [PubMed] [Google Scholar]
- 2.McLeod R, Boyer KM, Lee D, Mui E, Wroblewski K, Karrison T, Noble AG, Withers S, Swisher CN, Heydemann PT, Sautter M, Babiarz J, Rabiah P, Meier P, Grigg ME. 2012. Toxoplasmosis Study Group. Prematurity and severity are associated with Toxoplasma gondii alleles (NCCCTS, 1981–2009). Clin. Infect. Dis. 54:1595–1605 [DOI] [PMC free article] [PubMed] [Google Scholar]
- 3.Hermes G, Ajioka JW, Kelly KA, Mui E, Roberts F, Kasza K, Mayr T, Kirisits MJ, Wollmann R, Ferguson DJ, Roberts CW, Hwang JH, Trendler T, Kennan RP, Suzuki Y, Reardon C, Hickey WF, Chen L, McLeod R. 2008. Neurological and behavioral abnormalities, ventricular dilatation, altered cellular functions, inflammation, and neuronal injury in brains of mice due to common, persistent, parasitic infection. J. Neuroinflammation 5:48. [DOI] [PMC free article] [PubMed] [Google Scholar]
- 4.Vyas A, Kim SK, Giacomini N, Boothroyd JC, Sapolsky RM. 2007. Behavioral changes induced by Toxoplasma infection of rodents are highly specific to aversion of cat odors. Proc. Natl. Acad. Sci. U. S. A. 104:6442–6447 [DOI] [PMC free article] [PubMed] [Google Scholar]
- 5.Haroon F, Händel U, Angenstein F, Goldschmidt J, Kreutzmann P, Lison H, Fischer KD, Scheich H, Wetzel W, Schlüter D, Budinger E. 2012. Toxoplasma gondii actively inhibits neuronal function in chronically infected mice. PLoS One 7:e35516. 10.1371/journal.pone.0035516 [DOI] [PMC free article] [PubMed] [Google Scholar]
- 6.Stommel EW, Seguin R, Thadani VM, Schwartzman JD, Gilbert K, Ryan KA, Tosteson TD, Kasper LH. 2001. Cryptogenic epilepsy: an infectious etiology? Epilepsia 42:436–438 [DOI] [PubMed] [Google Scholar]
- 7.Yolken RH, Dickerson FB, Fuller ET. 2009. Toxoplasma and schizophrenia. Parasite Immunol. 31:706–715 [DOI] [PubMed] [Google Scholar]
- 8.Contini C, Seraceni S, Cultrera R, Incorvaia C, Sebastiani A, Picot S. 2005. Evaluation of a real-time PCR-based assay using the Lightcycler system for detection of Toxoplasma gondii bradyzoite genes in blood specimens from patients with toxoplasmic retinochoroiditis. Int. J. Parasitol. 35:275–283 [DOI] [PubMed] [Google Scholar]
- 9.Trapnell C, Pachter L, Salzberg SL. 2009. TopHat: discovering splice junctions with RNA-Seq. Bioinformatics 25:1105–1111 [DOI] [PMC free article] [PubMed] [Google Scholar]
- 10.Trapnell C, Williams BA, Pertea G, Mortazavi A, Kwan G, van Baren MJ, Salzberg SL, Wold BJ, Pachter L. 2010. Transcript assembly and quantification by RNA-Seq reveals unannotated transcripts and isoform switching during cell differentiation. Nat. Biotechnol. 28:511–515 [DOI] [PMC free article] [PubMed] [Google Scholar]
- 11.Eppig JT, Blake JA, Bult CJ, Kadin JA, Richardson JE. 2012. The Mouse Genome Database (MGD): comprehensive resource for genetics and genomics of the laboratory mouse. Nucleic Acids Res. 40:D881–D886 [DOI] [PMC free article] [PubMed] [Google Scholar]
- 12.Anders S, Huber W. 2010. Differential expression analysis for sequence count data. Genome Biol. 11:R106. [DOI] [PMC free article] [PubMed] [Google Scholar]
- 13.Benjamini Y, Hochberg Y. 1995. Controlling the false discovery rate: a practical and powerful approach to multiple testing. J. R. Stat. Soc. B 57:289–300 [Google Scholar]
- 14.Young LC, Campling BG, Voskoglou-Nomikos T, Cole SP, Deeley RG, Gerlach JH. 1999. Expression of multidrug resistance protein-related genes in lung cancer: correlation with drug response. Clin. Cancer Res. 5:673–680 [PubMed] [Google Scholar]
- 15.Grem JL, Danenberg KD, Behan K, Parr A, Young L, Danenberg PV, Nguyen D, Drake J, Monks A, Allegra CJ. 2001. Thymidine kinase, thymidylate synthase, and dihydropyrimidine dehydrogenase profiles of cell lines of the National Cancer Institute's Anticancer Drug Screen. Clin. Cancer Res. 7:999–1009 [PubMed] [Google Scholar]
- 16.Webster JP. 2007. The effect of Toxoplasma gondii on animal behavior: playing cat and mouse. Schizophr. Bull. 33:752–756 [DOI] [PMC free article] [PubMed] [Google Scholar]
- 17.Dalimi A, Abdoli A. 2012. Latent toxoplasmosis and human. Iran J. Parasitol. 7:1–17 [PMC free article] [PubMed] [Google Scholar]
- 18.Johnson AM. 1984. Strain-dependent, route of challenge-dependent, murine susceptibility to toxoplasmosis. Z. Parasitenkd. 70:303–309 [DOI] [PubMed] [Google Scholar]
- 19.Suzuki Y, Yang Q, Remington JS. 1995. Genetic resistance against acute toxoplasmosis depends on the strain of Toxoplasma gondii. J. Parasitol. 81:1032–1034 [PubMed] [Google Scholar]
- 20.Luo W, Aosai F, Ueda M, Yamashita K, Shimizu K, Sekiya S, Yano A. 1997. Kinetics in parasite abundance in susceptible and resistant mice infected with an avirulent strain of Toxoplasma gondii by using quantitative competitive PCR. J. Parasitol. 83:1070–1074 [PubMed] [Google Scholar]
- 21.Blanchard N, Gonzalez F, Schaeffer M, Joncker NT, Cheng T, Shastri AJ, Robey EA, Shastri N. 2008. Immunodominant, protective response to the parasite Toxoplasma gondii requires antigen processing in the endoplasmic reticulum. Nat. Immunol. 9:937–944 [DOI] [PMC free article] [PubMed] [Google Scholar]
- 22.Afonso C, Paixão VB, Costa RM. 2012. Chronic Toxoplasma infection modifies the structure and the risk of host behavior. PLoS One 7:e32489. 10.1371/journal.pone.0032489 [DOI] [PMC free article] [PubMed] [Google Scholar]
- 23.Gatkowska J, Wieczorek M, Dziadek B, Dzitko K, Dlugonska H. 2012. Behavioral changes in mice caused by Toxoplasma gondii invasion of brain. Parasitol. Res. 111:53–58 [DOI] [PMC free article] [PubMed] [Google Scholar]
- 24.Berenreiterová M, Flegr J, Kuběna AA, Němec P. 2011. The distribution of Toxoplasma gondii cysts in the brain of a mouse with latent toxoplasmosis: implications for the behavioral manipulation hypothesis. PLoS One 6:e28925. 10.1371/journal.pone.0028925 [DOI] [PMC free article] [PubMed] [Google Scholar]
- 25.Xiao J, Kannan G, Jones-Brando L, Brannock C, Krasnova IN, Cadet JL, Pletnikov M, Yolken RH. 2012. Sex-specific changes in gene expression and behavior induced by chronic Toxoplasma infection in mice. Neuroscience 206:39–48 [DOI] [PubMed] [Google Scholar]
- 26.Yamamoto M, Okuyama M, Ma JS, Kimura T, Kamiyama N, Saiga H, Ohshima J, Sasai M, Kayama H, Okamoto T, Huang DC, Soldati-Favre D, Horie K, Takeda J, Takeda K. 2012. A cluster of interferon-γ-inducible p65 GTPases plays a critical role in host defense against Toxoplasma gondii. Immunity 37:302–313 [DOI] [PubMed] [Google Scholar]
- 27.Villalba M, Hott M, Martin C, Aguila B, Valdivia S, Quezada C, Zambrano A, Concha MI, Otth C. 2012. Herpes simplex virus type 1 induces simultaneous activation of Toll-like receptors 2 and 4 and expression of the endogenous ligand serum amyloid A in astrocytes. Med. Microbiol. Immunol. 201:371–379 [DOI] [PubMed] [Google Scholar]
- 28.Carruthers VB, Suzuki Y. 2007. Effects of Toxoplasma gondii infection on the brain. Schizophr. Bull. 33:745–751 [DOI] [PMC free article] [PubMed] [Google Scholar]
- 29.Helliwell B. 2001. Role of free radicals in the neurodegenerative diseases. Drugs Aging 18:685–716 [DOI] [PubMed] [Google Scholar]
- 30.Kang H, Suzuki Y. 2001. Requirement of non-T cells that produce gamma interferon for prevention of reactivation of Toxoplasma gondii infection in the brain. Infect. Immun. 69:2920–2927 [DOI] [PMC free article] [PubMed] [Google Scholar]
- 31.Schluter D, Kaefer N, Hof H, Wiestler OD, Deckert-Schluter M. 1997. Expression pattern and cellular origin of cytokines in the normal and Toxoplasma gondii-infected murine brain. Am. J. Pathol. 150:1021–1035 [PMC free article] [PubMed] [Google Scholar]
- 32.Zhang SC, Goetz BD, Carre JL, Duncan ID. 2001. Reactive microglia in dysmyelination and demyelination. Glia 34:101–109 [DOI] [PubMed] [Google Scholar]
- 33.Murphy JE, Tedbury PR, Homer-Vanniasinkam S, Walker JH, Ponnambalam S. 2005. Biochemistry and cell biology of mammalian scavenger receptors. Atherosclerosis 182:1–15 [DOI] [PubMed] [Google Scholar]
- 34.Bédard A, Tremblay P, Chernomoretz A, Vallières L. 2007. Identification of genes preferentially expressed by microglia and upregulated during cuprizone-induced inflammation. Glia 55:777–789 [DOI] [PubMed] [Google Scholar]
- 35.Prandovszky E, Gaskell E, Martin H, Dubey JP, Webster JP, McConkey GA. 2011. The neurotropic parasite Toxoplasma gondii increases dopamine metabolism. PLoS One 6:e23866. 10.1371/journal.pone.0023866 [DOI] [PMC free article] [PubMed] [Google Scholar]
- 36.Takai Y, Sasaki T, Matozaki T. 2001. Small GTP-binding proteins. Physiol. Rev. 81:153–208 [DOI] [PubMed] [Google Scholar]
- 37.Ye X, Carew TJ. 2010. Small G protein signaling in neuronal plasticity and memory formation: the specific role of ras family proteins. Neuron 68:340–361 [DOI] [PMC free article] [PubMed] [Google Scholar]
- 38.Hall A, Lalli G. 2010. Rho and Ras GTPases in axon growth, guidance, and branching. Cold Spring Harb. Perspect Biol. 2:a001818. 10.1101/cshperspect.a001818 [DOI] [PMC free article] [PubMed] [Google Scholar]
- 39.Ng EL, Tang BL. 2008. Rab GTPases and their roles in brain neurons and glia. Brain Res. Rev. 58:236–246 [DOI] [PubMed] [Google Scholar]
- 40.Seabra MC, Mules EH, Hume AN. 2002. Rab GTPases, intracellular traffic and disease. Trends Mol. Med. 8:23–30 [DOI] [PubMed] [Google Scholar]
- 41.Söllner T, Rothman JE. 1994. Neurotransmission: harnessing fusion machinery at the synapse. Trends Neurosci. 17:344–348 [DOI] [PubMed] [Google Scholar]
- 42.Koepsell H. 1998. Organic cation transporters in intestine, kidney, liver, and brain. Annu. Rev. Physiol. 60:243–266 [DOI] [PubMed] [Google Scholar]
- 43.Blesa J, Phani S, Jackson-Lewis V, Przedborski S. 2012. Classic and new animal models of Parkinson's disease. J. Biomed. Biotechnol. 2012:845618. 10.1155/2012/845618 [DOI] [PMC free article] [PubMed] [Google Scholar]
- 44.Biswas PS, Bhagat G, Pernis AB. 2010. IRF4 and its regulators: evolving insights into the pathogenesis of inflammatory arthritis? Immunol. Rev. 233:79–96 [DOI] [PMC free article] [PubMed] [Google Scholar]
- 45.Jensen KD, Wang Y, Wojno ED, Shastri AJ, Hu K, Cornel L, Boedec E, Ong YC, Chien YH, Hunter CA, Boothroyd JC, Saeij JP. 2011. Toxoplasma polymorphic effectors determine macrophage polarization and intestinal inflammation. Cell Host Microbe 9:472–483 [DOI] [PMC free article] [PubMed] [Google Scholar]
- 46.Yu H, Wergedal JE, Zhao Y, Mohan S. 2012. Targeted disruption of TGFBI in mice reveals its role in regulating bone mass and bone size through periosteal bone formation. Calcif. Tissue Int. 91:81–87 [DOI] [PubMed] [Google Scholar]
- 47.Hei TK, Zhao Y, Zhou H, Ivanov V. 2011. Mechanism of radiation carcinogenesis: role of the TGFBI gene and the inflammatory signaling cascade. Adv. Exp. Med. Biol. 720:163–170 [DOI] [PMC free article] [PubMed] [Google Scholar]
- 48.Uvarov P, Ludwig A, Markkanen M, Rivera C, Airaksinen MS. 2006. Upregulation of the neuron-specific K+/Cl- cotransporter expression by transcription factor early growth response 4. J. Neurosci. 26:13463–13473 [DOI] [PMC free article] [PubMed] [Google Scholar]
- 49.Ludwig A, Uvarov P, Pellegrino C, Thomas-Crusells J, Schuchmann S, Saarma M, Airaksinen MS, Rivera C. 2011. Neurturin evokes MAPK-dependent upregulation of Egr4 and KCC2 in developing neurons. Neural Plast. 2011:1–8 [DOI] [PMC free article] [PubMed] [Google Scholar]
- 50.Dellacasa-Lindberg I, Hitziger N, Barragan A. 2007. Localized recrudescence of Toxoplasma infections in the central nervous system of immunocompromised mice assessed by in vivo bioluminescence imaging. Microbes Infect. 9:1291–1298 [DOI] [PubMed] [Google Scholar]
- 51.Xu L, Sapolsky RM, Giffard RG. 2001. Differential sensitivity of murine astrocytes and neurons from different brain regions to injury. Exp. Neurol. 169:416–424 [DOI] [PubMed] [Google Scholar]
- 52.Dogruman-Al F, Fidan I, Celebi B, Yesilyurt E, Erdal B, Babur C, Kustimur S. 2011. Cytokine profile in murine toxoplasmosis. Asian Pac. J. Trop. Med. 4:16–19 [DOI] [PubMed] [Google Scholar]
- 53.Flores M, Saavedra R, Bautista R, Viedma R, Tenorio EP, Leng L, Sánchez Y, Juárez I, Satoskar AA, Shenoy AS, Terrazas LI, Bucala R, Barbi J, Satoskar AR, Rodriguez-Sosa M. 2008. Macrophage migration inhibitory factor (MIF) is critical for the host resistance against Toxoplasma gondii. FASEB J. 22:3661–3671 [DOI] [PMC free article] [PubMed] [Google Scholar]
- 54.Middleton MK, Zukas AM, Rubinstein T, Kinder M, Wilson EH, Zhu P, Blair IA, Hunter CA, Puré E. 2009. 12/15-lipoxygenase-dependent myeloid production of interleukin-12 is essential for resistance to chronic toxoplasmosis. Infect. Immun. 77:5690–5700 [DOI] [PMC free article] [PubMed] [Google Scholar]
- 55.Ploix CC, Noor S, Crane J, Masek K, Carter W, Lo DD, Wilson EH, Carson MJ. 2011. CNS-derived CCL21 is both sufficient to drive homeostatic CD4+ T cell proliferation and necessary for efficient CD4+ T cell migration into the CNS parenchyma following Toxoplasma gondii infection. Brain Behav. Immun. 25:883–896 [DOI] [PMC free article] [PubMed] [Google Scholar]
- 56.Rozenfeld C, Martinez R, Figueiredo RT, Bozza MT, Lima FR, Pires AL, Silva PM, Bonomo A, Lannes-Vieira J, De Souza W, Moura-Neto V. 2003. Soluble factors released by Toxoplasma gondii-infected astrocytes down-modulate nitric oxide production by gamma interferon-activated microglia and prevent neuronal degeneration. Infect. Immun. 71:2047–2057 [DOI] [PMC free article] [PubMed] [Google Scholar]