Abstract
Cardiopulmonary arrest remains one of the leading causes of death and disability in Western countries. Although ventricular fibrillation (VF) models in rodents mimic the “square wave” type of insult (rapid loss of pulse and pressure) commonly observed in adult humans at the onset of cardiac arrest (CA), they are not popular because of the complicated animal procedure, poor animal survival and thermal injury. Here we present a modified, simple, reliable, ventricular fibrillation-induced rat model of CA that will be useful in studying mechanisms of CA-induced delayed neuronal death as well as the efficacy of neuroprotective drugs. CA was induced in male Sprague Dawley rats using a modified method of von Planta et al. In brief, VF was induced in anesthetized, paralyzed, mechanically ventilated rats by an alternating current delivered to the entrance of the superior vena cava into the heart. Resuscitation was initiated by administering a bolus injection of epinephrine and sodium bicarbonate followed by mechanical ventilation and manual chest compressions and countershock with a 10-J DC current. Neurologic deficit score was higher in the CA group compared to the sham group during early reperfusion periods, suggesting brain damage. Significant damage in CA1 hippocampus (21% normal neurons compared to control animals) was observed following histopathological assessment at seven days of reperfusion. We propose that this method of VF-induced CA in rat provides a tool to study the mechanism of CA-induced neuronal death without compromising heart functions.
Keywords: Hippocampus, global cerebral ischemia, cardiac arrest, animal model
Introduction
Cardiopulmonary arrest is one of the leading causes of death and disability in Western countries. Despite quick emergency responses and better techniques of defibrillation, the chances of survival following cardiac arrest (CA) are still poor. In fact, of the 70,000/year patients that are resuscitated after CA, 60% die from extensive secondary brain injury while only 3–10% are able to resume their former lifestyles 1. Ventricular fibrillation (VF) is the most common cause of sudden cardiac death 2. The incidence of VF-induced out-of-hospital CA is over 10 per 100,000 3. Most of the studies investigating mechanism of cell death and neuroprotective paradigms against CA-induced brain damage employ commonly used 2-vessel occlusion (2-VO) with hypotension, and 4-vessel occlusion (4-VO) animal models to induce global cerebral ischemia owing to the relatively easy procedure 4, 5. However, those models do not mimic all features of CA, such as whole body ischemia.
Great efforts in this field have been placed on developing CA models that encompass most cardiovascular variables observed in human cases and that may play additional roles in the development of pathology that ensues in the brain after CA. Presently, several models are available to induce CA in rats, including induction of CA by a rapid intra-atrial injection of potassium chloride, delivering alternating current to the right ventricular endocardium, transoesophageal cardiac pacing, transthoracal electrical fibrillation, asphyxia, chest compression, compression of the heart vascular bundle against the sternum by use of a microsurgical hook, and simultaneous aortic occlusion created by an arterial balloon and right atrial occlusion by a venous balloon catheter, among others 6–19. All of these models have a few pros and cons. Although the VF model mimics the “square wave” type of insult (rapid loss of pulse and pressure) commonly observed in adult humans at the onset of CA, it is not the model of choice owing to complicated animal procedure, poor animal survival and thermal injury.
Here we describe a modified, simple, and reliable VF technique induced in rats as a model of CA that could be useful in studying the mechanisms of cerebral ischemia-induced delayed cell death, as well as the efficacy of neuroprotective drugs 15.
Materials and methods
Animals
All animal procedures were carried out in accordance with the Guide for the Care and Use of Laboratory Animals published by the National Institutes of Health and were approved by the Animal Care and Use Committee of the University of Miami. According to these guidelines, efforts were made to minimize the number of animals and their suffering.
Induction of cardiac arrest
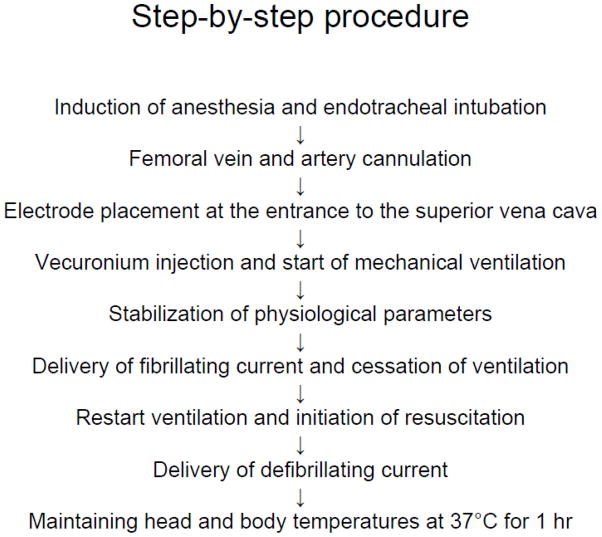
VF was induced by a modified method of von Planta et al.15 (see Figure 1 for summary). Male Sprague-Dawley rats were anesthetized with 4% isofluorane and a 30:70 mixture of oxygen and nitrous oxide followed by endotracheal intubation. Isoflurane was subsequently lowered to 1.5 to 2% for endovascular access. The femoral vein and femoral artery were each cannulated using a single lumen (PE-50) catheter for drug delivery, and for continuous blood pressure monitoring and blood gas analysis, respectively. Electrocardiographic leads were attached to the limbs. Through the left external jugular vein, an electrode was advanced through the left superior vena cava (Figure 2A and B) and stopped at the entrance of the superior vena cava into the right atrium. The electrode was placed at the correct location using a fluoroscope. The length of inserted electrode from bifurcation of external jugular vein and left superior vena cava to heart was 42 – 45 mm. Vecuronium (2 mg/Kg) (Gensia Sicor Pharmaceuticals, Irvine, CA, USA) was injected intravenously followed by mechanical ventilation (60 breaths/min) and lowering of isoflurane to 0.5–2%. The tidal volume was 8 – 10 ml/kg body weight. Physiological variables, including, pCO2, pO2, pH, HCO3− and arterial base excess (ABL50, Radiometer Copenhagen, Westlake, OH, USA), were maintained within normal limits by adjusting the ventilator (UGO Biological Research Apparatus, Comerio, Italy) volume settings. Mean arterial blood pressure (MAP) (AMP 6600 Blood pressure amplifier, Gould Instrument Systems, Valley View, OH, USA) and a five-lead electrocardiogram (ECG) (ML132, ADInstruments, Colorado Springs, CO, USA) were continuously monitored. The data was recorded using Chart v4.1 (ADInstruments). The head and body temperatures were maintained at 36.5 – 37.0 °C using a heating lamp and heating pad, respectively. A progressive increase in 60 Hz current to a 3 – 5 mA was then delivered to the entrance of the superior vena cava. To reduce thermal injury at the site of the electrode, 30 seconds after the induction of VF the current was reduced to approximately one-half of the fibrillating current for another minute and then was decreased gradually so the current reached zero at 2 min after the initial delivery of current. Fibrillating current was delivered for 2 minutes in order to prevent spontaneous heart fibrillation. After the induction of VF, the ventilator was stopped. Upon completion of CA, the ventilator was restarted and resuscitation initiated by administering a bolus injection of epinephrine (Cura Pharmaceutical Co. Inc., Eatontown, NJ, USA) (5 μg/kg, i.v.) and sodium bicarbonate (Hospira Inc., Lake Forest, IL, USA) (1 meq/kg, i.v.) followed by mechanical ventilation with 100% oxygen at a rate of 80 breaths/minute and manual chest compressions at a rate of 200/min for one minute. To decrease lung injury at the time of resuscitation/chest massage, tidal volume was decreased to 75 % of the original settings. To increase gas exchange and to prevent alveolar damage, positive end-expiratory pressure (PEEP) was performed by placing the ventilator exhaust about 2 cm deep into the water. At the end of one minute of chest compression, the animals were countershocked with a 10-J DC current delivered between the anterior chest and a conductive foil placed on the back of the animal (Figure 2C). If VF was not reversed within 20 seconds, an additional DC countershock was applied and then chest compression resumed for another 30 seconds before the next pair of countershocks until MAP reached 60 mm Hg and was maintained by a spontaneously beating heart for more than 10 seconds. Tidal volume was restored to the level before induction of cardiac arrest. After 10 minutes of restoration of spontaneous circulation (ROSC), the ventilator rate was decreased to 60 breaths/min and the oxygen lowered to 30% in a mixture with N2O. The PEEP was stopped. Arterial blood gases were then measured. If any corrections in acid-base status were necessary, sodium bicarbonate was administered and/or the ventilator settings were adjusted. Once the animal was hemodynamically stable and spontaneously breathing, usually by 10–15 min after ROSC, the catheters were removed and the animal extubated, and 100 % O2 was delivered via face mask for about an hour. Head and body temperatures were maintained at 37°C using heating lamps for 1 hr. Rats were then placed in a humidified incubator that maintained an ambient temperature of 29°C. Control animals (sham) underwent femoral vein and femoral artery catheterization and did not experience CA. The resuscitation fluids were not used; however, sham animals were isoflurane-treated exactly as the experimentals.
Figure 1.
Schematic diagram of procedural steps for induction of ventricular fibrillation-induced cardiac arrest.
Figure 2.

(A) Position of electrode in left jugular vein, (B) position of electrode as viewed by fluoroscope, and (C) position of electrodes to deliver countershocks.
Heart rates and blood pressure analysis
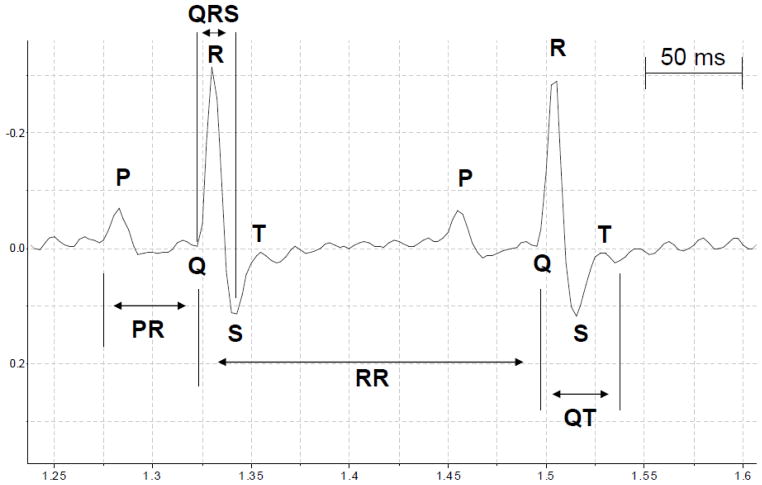
Details of ECG changes were evaluated as described earlier and included the following parameters: heart rate; RR interval; P wave length; PR interval; QRS length; and QT interval 20, 21. Time intervals in the ECG waveform were measured from data files using Chart 4 software (ADInstruments Inc., Colorado Springs, CO, USA). We calculated the average of each ECG parameter extrapolated from 20 heart cycles (RR intervals) 10 min before VF and 10 min after VF. All variables analyzed are expressed in milliseconds (msec). The RR intervals were calculated as the difference in time recorded for two successive R-wave onsets (Figure 3). The RR interval was considered as an index of cardiac cycle. Length of P wave and PR intervals were calculated as indicators of atrial and atrioventricular conduction, respectively. PR interval was measured as the time between start of the P wave and the start of the R wave (Figure 3). The QRS interval was measured as an indicator of ventricular depolarization and conduction. It was calculated as the time between start of the Q wave and the S wave peak (Figure 3). As an indicator of ventricular repolarization we measured the QT interval (the time between the start of the Q wave and the end of the T wave) (Figure 3). The QT interval presented in table 3 has been corrected for heart rate (QTc) as described earlier 22.
Figure 3.
Schematic diagram showing ECG tracings. The letters P, Q, R, S, and T designate the respective waves. RR intervals: cardiac cycle; P wave: atrial depolarization; PR intervals: atrioventricular conduction; QRS intervals: ventricular depolarization; QT intervals and T wave: ventricular repolarization.
Table 3.
Means values (± SEM) of ECG parameters measured 10 minutes before and 10 minutes after Ventricular Fibrillation (VF).
| ECG parameters | Before VF | After VF | P |
|---|---|---|---|
| Heart Rate (beats/min) | 345 ± 15 | 367 ± 22 | ns |
| RR intervals (msec) | 169 ± 10 | 177 ± 10 | ns |
| P wave length (msec) | 24 ± 1 | 23 ± 2 | ns |
| PR intervals (msec) | 47 ± 6 | 42 ± 4 | ns |
| QRS length (msec) | 29.5 ± 0.3 | 28.4 ± 0.7 | ns |
| QT intervals (msec) | 24 ± 0.7 | 21 ± 0.9 | ns |
| QTc intervals (msec) | 66.5 ± 0.9 | 64.3 ± 0.5 | ns |
Qtc intervals: QT intervals corrected for heart rate.
Histology
At the end of 7 days of reperfusion, rats were anesthetized with isoflurane and perfused with FAM (a mixture of 40 % formaldehyde, glacial acetic acid, and methanol, 1:1:8 by volume) for 19 min following a 1 min initial perfusion with physiologic saline. The perfusate was delivered into the root of the ascending aorta at a constant pressure of 110–120 mm Hg as previously described 18, 23. The brains were then removed from the skull and cut into 3 – 5 mm thick blocks using a rat brain matrix (ASI instruments, Warren, MI, USA). Processed coronal brain blocks were embedded in paraffin and coronal brain sections of 10 μm thickness were cut. To determine neuron survival, serial sections (200 μm apart) from 2.8 to 4.0 mm posterior to bregma were collected. Brain sections were then placed on a glass slide and incubated overnight in an oven at 54° to 55° C to remove paraffin. The sections were then stained with hematoxylin and eosin. Stained sections were covered with micro cover glasses using Permount (Fisher Scientific, PA, USA). For animals belonging to both groups, the number of normal neurons within the entire CA1 region of hippocampus (about 18 microscopic fields) was quantified as described earlier at bregma level 3.8 mm 24. Normal-appearing pyramidal-shaped neurons were counted in CA1 hippocampus.
Neurological deficit score
A neurological deficit score (NDS) was performed daily for 7 days after CA. The total NDS consists of five components: consciousness and respiration, cranial nerve function, motor function, sensory function and coordination (balance beam walk, placing test, depth perception, righting reflex) and for motor and sensory function as previously described 25. The NDS ranges from 0 (normal) to 100 (brain-dead).
Statistics
All data are expressed as mean ± SEM. Statistical evaluation of the data was performed using Student’s test. A p value < 0.05 was considered significant.
Results
Physiological parameters
Before induction of CA, all physiological variables measured were statistically similar in sham-operated and CA groups (Table 1). Physiological parameters remained unchanged throughout the surgical procedure in the sham-operated group (n = 7). In the CA group, physiological variables remained unchanged before and after induction of CA. Because during resuscitation animals were mechanically ventilated with 100% oxygen, by 10 min after resuscitation pO2 was higher by 320 % compared to baseline (before CA) (n = 10).
Table 1.
Physiological parameters.
| Group | Variable | Cardiac arrest | |
|---|---|---|---|
| Before | After | ||
| Sham (n = 7) | Body weight | 340 ± 15 | |
| pH | 7.48 ± 0.01 | 7.47 ± 0.01 | |
| pCO2 mm Hg | 38 ± 0.9 | 37 ± 0.5 | |
| pO2 mm Hg | 121 ± 5 | 125 ± 6 | |
| Plasma glucose mg/dl | 161 ± 10 | ||
| Cardiac arrest (n = 10) | Body weight | 333 ± 8 | |
| pH | 7.48 ± 0.01 | 7.47 ± 0.03 | |
| pCO2 mm Hg | 38 ± 1 | 37 ± 2 | |
| pO2 mm Hg | 130 ± 9 | 416 ± 38* | |
| Plasma glucose mg/dl | 153 ± 18 | ||
Results are expressed as mean ± SEM of the number of observations given in the parenthesis.
p<0.01 as compared to sham.
Blood pressure and ECG parameters
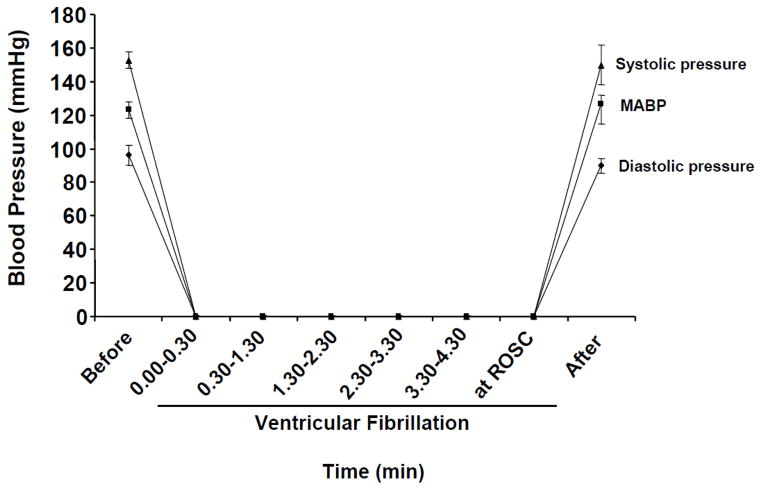
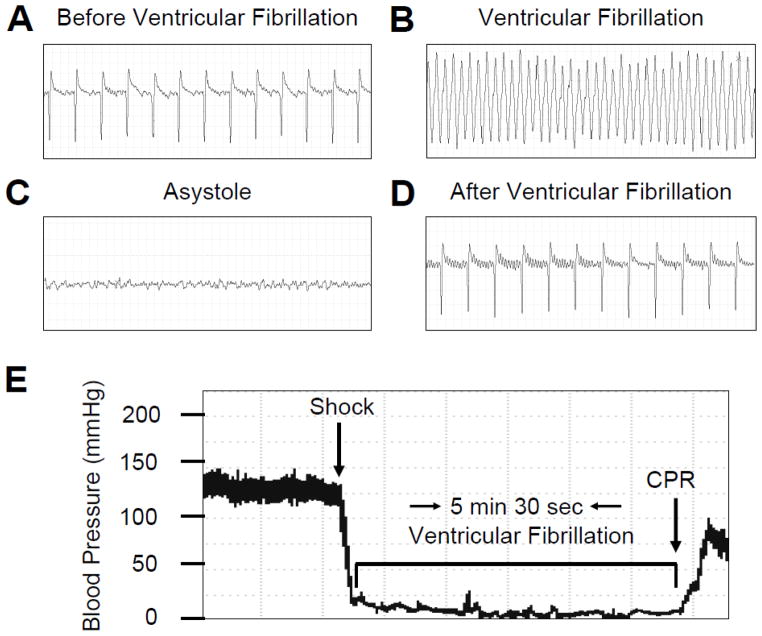
During the induction of CA, an immediate ventricular fibrillation was observed followed by sudden drop in blood pressure to close to 0 mmHg (Figure 4) (n = 7). When the fibrillating current was stopped, asystole was observed and blood pressure remained zero mm Hg until resuscitation (n = 7). The rate of survival is presented in Table 2. Before induction of CA, all animals presented a normal sinus rhythm, interatrial (P wave length), and interventricular conductions (QRS interval) with a heart rate of 345 ± 15/min (Table 3) (n = 10). After the shock, the hearts fibrillated with an immediate drop in blood pressure (Figure 4). In all animals, we observed the presence of “chaotic asynchronous fractionated activity of the heart” (a signature of ventricular fibrillation) (Figure 5) (n = 7). After the first three minutes the amplitude of the waves gradually reduced and asystole was observed. Resuscitation was started on average at about 5 minutes and 19 seconds of VF. Immediately after resuscitation, the rat hearts presented several ventricular ectopic beats; in two cases we observed episodes of ventricular tachycardia. The mean duration for ROSC was 203 ± 10 sec. Ten minutes after resuscitation, ECG appeared normal with a heart rate of (367 ± 22) (Table 3, Figure 5) (n = 10).
Figure 4.
The systolic pressure, diastolic pressure, and mean arterial blood pressure before, during, and after ventricular fibrillation (VF). The mean arterial pressure drastically decreased to 0 mmHg upon induction of VF. Systolic pressure and diastolic pressure decreased simultaneously following VF (Figures C, A and B). Upon resuscitation, mean arterial pressure returned to normal values within few minutes.
Table 2.
Survival rate following cardiac arrest.
| Group | Died or discarded/total number of rat |
|---|---|
| Sham | 0/7 |
| Cardiac arrest | 3/20 died early after ROSC due to lung edema |
| 1/20 unable to induce ventricular fibrillation | |
| 5/20 unable to resuscitate | |
| 1/20 died at 24h of reperfusion |
Figure 5.
Representative of ECG traces (A – D) and blood pressure tracing (E). (A) ECG 10 minutes before induction of ventricular fibrillation (VF), (B) during VF, (C) during asystole and, (D) 10 minutes after resuscitation, (E) blood pressure trace before during and after VF. Each ECG time interval is 2.5 seconds. CPR: cardiopulmonary resuscitation.
No significant differences were found in systolic (153 ± 5 vs. 150 ± 12, ns), diastolic (96. ± 6 vs. 90 ± 4, ns, ns) and mean (123 ± 5 vs. 126 ± 6, ns) blood pressure before and after VF (Table 3) (n = 7). To confirm the hypothesis that our method to induce VF in rat is not harmful for the heart, we analyzed in all surviving rats the ECG parameters before and after VF (Table 3) (n = 7). We analyzed five variables: RR interval, P wave length, PR interval, QRS length and, QT interval 20, 21. No significant differences were observed in RR interval, which is considered as a measure of cardiac cycle (169 ± 10 msec before CA vs. 177 ± 10 msec after CA). A P wave preceding the QRS complex was evident in all rats before and after VF as an indicative of synusal rhythm. No change in amplitude and duration of the P wave was present before (24 ± 1 msec) and after (23 ± 2 msec) VF. The PR interval was calculated as the time between the start of the P wave and the start of the R wave (Figure 3). The averages of PR intervals before and after VF were 47 ± 6 msec and 42 ± 4 msec, respectively. The QRS interval is an indicator of ventricular depolarization and conduction. During the period before and after VF, no significant differences were observed in the average of the QRS intervals (29.5 ± 0.3 msec, and 28.4 ± 0.7 msec, respectively). No significant differences were presented in the averages of QT interval and QTc, before and after VF (Table 3). Our results demonstrate that the electrical heart conduction was normal before VF in each rat. After VF, all ECG parameters returned to normal values and exhibited normal electrical heart conduction.
Neurological deficit score
To determine whether this model of cardiac arrest resulted in neurological deficits (NDS), NDS were measured before the induction of CA and at different times following CA. All rats exhibited normal with neurological deficit score (NDS) of zero prior to the CA insult. In CA rats at 3 h, 24 h, 48 h and 72 h following CA NDS score was 63 ± 5, 26 ± 2, 14 ± 2 and 6 ± 1, respectively (n = 3).
Hippocampal histopathology
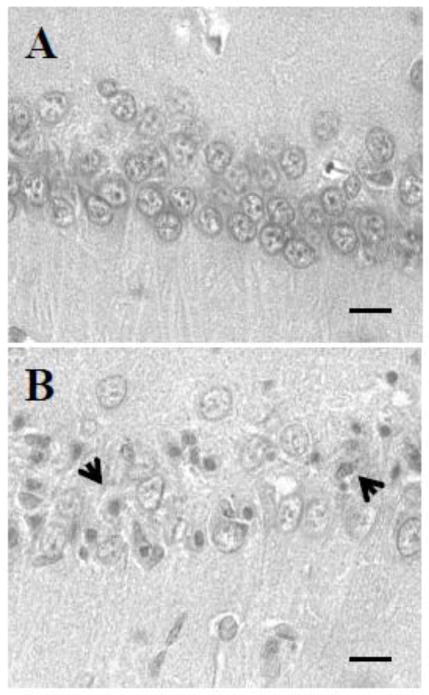
Neurons exhibiting ischemic cell change (ICC) were present throughout the forebrain and hindbrain. These changes consisted of: (1) eosinophilic cytoplasm, (2) dark-staining triangular-shaped nuclei, and (3) eosinophilic-staining nucleolus. Rats were subjected on average to 5 minutes and 19 seconds of CA and were allowed to survive for 7 days. At the end of 7 days rat brains were analyzed for histopathology (Figure 6). Neurons exhibiting ischemic cell change (ICC) (eosinophilic cytoplasm, dark-staining triangular shaped nuclei, and eosinophilic-staining nucleolus) were present throughout the CA1 hippocampus. The number of normal neurons in the CA1 hippocampal region in sham CA rats was 1263 ± 43 (n = 6) (Figure 7). The number of normal neurons was decreased by 79% (n = 4) (261 ± 58, p<0.001) in the CA group as compared to the sham CA group (Figure 7). These results indicate that the paradigm of ventricular fibrillation CA that we used here results in neuronal loss in the CA1 hippocampus.
Figure 6.
Representative histological images of hippocampal CA1 region at 7 days of reperfusion afterward: (A) sham and (B) cardiac arrest. Arrow shows neurons exhibiting ICC. All images were captured at 40X magnification. Scale bar indicates 30 m.
Figure 7.
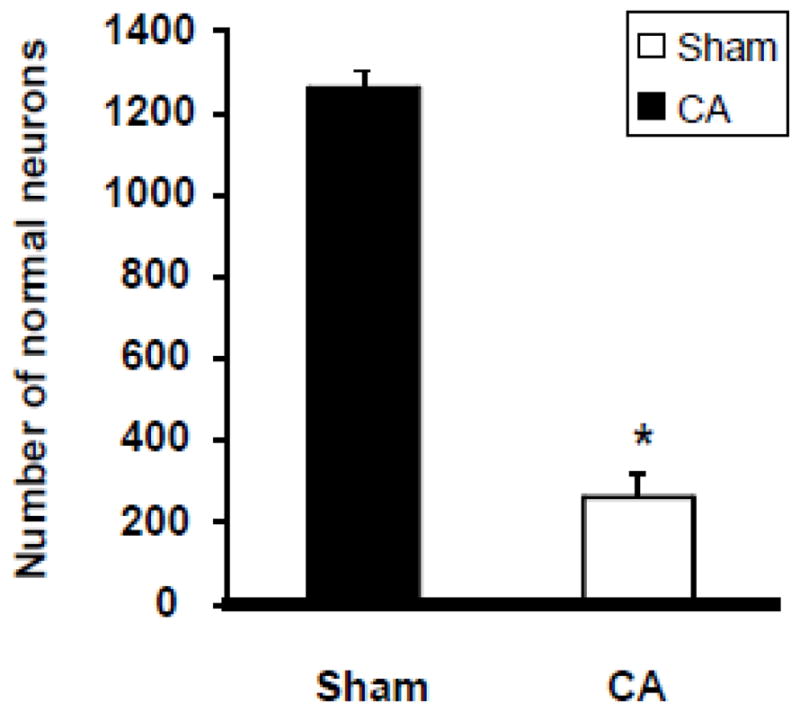
Numbers of normal neurons in CA1 region of rat hippocampus after CA. Normal neuronal counts were made in the entire CA1 region (about 18 microscopic fields) of hippocampus in both experimental groups. * p<0.05 compared to sham-operated animals.
Discussion
Disruption in cerebral blood flow owing to cardiac arrest initiates a cascade of cellular derangements which results in permanent brain damage. Pharmacological agents with promising results in animal studies have failed in clinical settings. Although many factors have been suggested for this failure, it has been suggested that the commonly used global cerebral ischemia animal models (2-vessel occlusion with hypotension and the 4-vessel occlusion model) may not accurately simulate cardiac arrest, because this is a multifactorial condition where major systemic factors are affected, including the heart itself. Animal models that closely mimic human cardiac arrest conditions are less popular owing to the complicated animal procedure required and poor survival. In this study, we attempted to develop a modified, simple and reliable ventricular fibrillation-induced cardiac arrest model in rats that mimics the “square wave” type of insult (rapid loss of pulse and pressure) commonly observed in adult humans at the onset of CA.
In the present study, we attempted to improve the model of VF-induced cardiac arrest established by von Planta et al. 15. In that study VF was induced by delivering 10 mA alternating current to the right ventricular endocardium. With the aim of reducing thermal injury at the site of electrode placement, fibrillating current was reduced to about one-half of the fibrillating current and was continued for an additional 3 min. Investigators were able to resuscitate only 57% of animals (eight out of 14 animals) exposed to VF-induced CA. Such a low rate of resuscitation in these rats may be due to thermal injury to endocardium by the fibrillating current. In an attempt to avoid/reduce thermal injury to the endocardium, we used a fluoroscope to identify the exact location to place the electrode and this overcome minor anatomical differences. This enabled us to lower the ventricular fibrillation-inducing current from 10 mA to 3 – 5 mA. We were also able to reduce the initial duration of fibrillating current from 90 sec to 30 sec and the total duration for fibrillating current from 270 sec to 120 sec compared to the study by von Planta et al.15 No signs of thermal injury were observed at the site of electrode placement in hearts of rats subjected to VF-CA. ECG parameters were also comparable between sham and CA groups. We were able to resuscitate 75% of rats subjected to VF-CA. It is possible that reduced thermal injury due to the lower current required to induce CA greatly improved resuscitation rates compared to the earlier established model 15. This contention is supported by earlier studies that avoided thermal injury to the heart by trans-esophageal delivery of the fibrillating current. These studies reported high (73 - 100%) ROSC rates7, 8. However, the effect of thermal injury to esophagus on long-term survival remains to be determined.
To use the VF-CA model to study long-term effects of CA on brain, it is essential to study relatively longer survival times. In earlier studies, the animals were allowed to survive for 30 min to 24 hours of reperfusion following CA 7, 8, 15. von Planta et al. reported that 29% of animals (four of 14 animals) exposed to VF-induced CA survived for 24 h post-ROSC.15 In order to address this, we allowed animals to survive for seven days. During initial experiments we observed that some of the animals developed lung edema post-ROSC, potentially due to lung injury during resuscitation/chest massage. To decrease lung injury at the time of resuscitation/chest massage, tidal volume was decreased to 75 % of original settings. At the end of resuscitation, the ventilator settings were brought to pre-CA levels. To increase gas exchange and to prevent alveolar damage, PEEP was performed by placing the ventilator exhaust about 2 cm deep into the water. The depth of pipe was lowered when necessary to avoid blood pressure drop. PEEP was stopped if the blood gases measured at 10 min following CA were in normal range. Thus, the modified method to induce VF-CA described here has significant improvements compared to existing models. We were not able to resuscitate 25% of animals and another 15% of animals died from lung edema. We speculate that improvised method of resuscitation, as exemplified by the automated resuscitation device described earlier, may help increase rate of successful resuscitation as well as decrease incidence of lung edema. The effect of such a resuscitation device on survival rate remains to be determined. We observed that VF-CA resulted in 79% cell death in CA1 hippocampus. The degree of CA1 damage observed in this model is similar to those observed with eight minutes of asphyxial cardiac arrest or 8–10 minutes of global cerebral ischemia induced by 2-VO with hypotension 24, 26–28. However, in these models mortality was relatively lower compared to VF-CA model 24, 26–28. Together these studies do not indicate a correlation between the degree of CA1 damage and mortality.
To fulfill the STAIR recommended criteria (histological and behavioral outcomes, and physiological parameters such as blood pressure, temperature, blood gases and blood glucose), we measured multiple (histological and behavioral) outcomes following CA and maintained physiological parameters in normal physiological range 29. Arterial blood pressure was monitored before during and up to about 1 h post-CA. Blood glucose was also monitored before induction of CA. The method of ventricular fibrillation-induced cardiac arrest described here provides a tool to study the effect of neuroprotective drugs in preclinical settings.
In summary, the model described here offers a simple and reliable way to utilize ventricular fibrillation-induced cardiac arrest to study the effects of cardiac arrest-induced cerebral ischemia on brain.
Acknowledgments
This study was supported by NIH grants NS45676, NS054147, NS34773, NS05820, and NS073779. We would like to thank Dr. Maritza Martinez for technical assistance and Prof. Brant Watson for critical reading of this manuscript.
Footnotes
Conflict of Interest:
Kunjan R. Dave declares that he has no conflict of interest.
David DellaMorte declares that he has no conflict of interest.
Isabel Saul declares that she has no conflict of interest.
Ricardo Prado declares that he has no conflict of interest.
Miguel A. Perez-Pinzon declares that he has no conflict of interest.
All institutional and national guidelines for the care and use of laboratory animals were followed.
References
- 1.Krause GS, Kumar K, White BC, Aust SD, Wiegenstein JG. Ischemia, resuscitation, and reperfusion: Mechanisms of tissue injury and prospects for protection. Am Heart J. 1986;111:768–780. doi: 10.1016/0002-8703(86)90114-6. [DOI] [PubMed] [Google Scholar]
- 2.Pokorny J, Stanek V, Vrana M. Sudden cardiac death thirty years ago and at present. The role of autonomic disturbances in acute myocardial infarction revisited. Physiol Res. 2011;60:715–728. doi: 10.33549/physiolres.932110. [DOI] [PubMed] [Google Scholar]
- 3.Bunch TJ, White RD. Trends in treated ventricular fibrillation in out-of-hospital cardiac arrest: Ischemic compared to non-ischemic heart disease. Resuscitation. 2005;67:51–54. doi: 10.1016/j.resuscitation.2005.04.015. [DOI] [PubMed] [Google Scholar]
- 4.Ginsberg MD, Busto R. Rodent models of cerebral ischemia. Stroke. 1989;20:1627–1642. doi: 10.1161/01.str.20.12.1627. [DOI] [PubMed] [Google Scholar]
- 5.Traystman RJ. Animal models of focal and global cerebral ischemia. ILAR Journal. 2003;44:85–95. doi: 10.1093/ilar.44.2.85. [DOI] [PubMed] [Google Scholar]
- 6.Ding Z, Fach C, Sasse A, Godecke A, Schrader J. A minimally invasive approach for efficient gene delivery to rodent hearts. Gene Ther. 2004;11:260–265. doi: 10.1038/sj.gt.3302167. [DOI] [PubMed] [Google Scholar]
- 7.Chen MH, Liu TW, Xie L, Song FQ, He T, Zeng ZY, et al. Ventricular fibrillation induced by transoesophageal cardiac pacing: A new model of cardiac arrest in rats. Resuscitation. 2007;74:546–551. doi: 10.1016/j.resuscitation.2007.01.039. [DOI] [PubMed] [Google Scholar]
- 8.Chen MH, Liu TW, Xie L, Song FQ, He T, Zeng ZY, et al. A simpler cardiac arrest model in rats. Am J Emerg Med. 2007;25:623–630. doi: 10.1016/j.ajem.2006.11.033. [DOI] [PubMed] [Google Scholar]
- 9.Pluta R, Kida E, Lossinsky AS, Golabek AA, Mossakowski MJ, Wisniewski HM. Complete cerebral ischemia with short-term survival in rats induced by cardiac arrest. I. Extracellular accumulation of alzheimer’s beta-amyloid protein precursor in the brain. Brain Res. 1994;649:323–328. doi: 10.1016/0006-8993(94)91081-2. [DOI] [PubMed] [Google Scholar]
- 10.Krajewski S, Mai JK, Krajewska M, Sikorska M, Mossakowski MJ, Reed JC. Upregulation of bax protein levels in neurons following cerebral ischemia. J Neurosci. 1995;15:6364–6376. doi: 10.1523/JNEUROSCI.15-10-06364.1995. [DOI] [PMC free article] [PubMed] [Google Scholar]
- 11.Hossmann KA, Oschlies U, Schwindt W, Krep H. Electron microscopic investigation of rat brain after brief cardiac arrest. Acta Neuropathol. 2001;101:101–113. doi: 10.1007/s004010000260. [DOI] [PubMed] [Google Scholar]
- 12.Pichiule P, Chavez JC, Xu K, LaManna JC. Vascular endothelial growth factor upregulation in transient global ischemia induced by cardiac arrest and resuscitation in rat brain. Brain Res Mol Brain Res. 1999;74:83–90. doi: 10.1016/s0169-328x(99)00261-2. [DOI] [PubMed] [Google Scholar]
- 13.Crumrine RC, LaManna JC. Regional cerebral metabolites, blood flow, plasma volume, and mean transit time in total cerebral ischemia in the rat. J Cereb Blood Flow Metab. 1991;11:272–282. doi: 10.1038/jcbfm.1991.59. [DOI] [PubMed] [Google Scholar]
- 14.Studer W, Wu X, Siegemund M, Marsch S, Seeberger M, Filipovic M. Influence of dobutamine on the variables of systemic haemodynamics, metabolism, and intestinal perfusion after cardiopulmonary resuscitation in the rat. Resuscitation. 2005;64:227–232. doi: 10.1016/j.resuscitation.2004.08.003. [DOI] [PubMed] [Google Scholar]
- 15.von Planta I, Weil MH, von Planta M, Bisera J, Bruno S, Gazmuri RJ, et al. Cardiopulmonary resuscitation in the rat. J Appl Physiol. 1988;65:2641–2647. doi: 10.1152/jappl.1988.65.6.2641. [DOI] [PubMed] [Google Scholar]
- 16.Reid KH, Young C, Schurr A, Tseng M, Payne RS, Keelen P, et al. Audiogenic seizures following global ischemia induced by chest compression in long-evans rats. Epilepsy Res. 1996;23:195–209. doi: 10.1016/0920-1211(95)00099-2. [DOI] [PubMed] [Google Scholar]
- 17.Kawai K, Nitecka L, Ruetzler CA, Nagashima G, Joo F, Mies G, et al. Global cerebral ischemia associated with cardiac arrest in the rat: I. Dynamics of early neuronal changes. J Cereb Blood Flow Metab. 1992;12:238–249. doi: 10.1038/jcbfm.1992.34. [DOI] [PubMed] [Google Scholar]
- 18.Dave KR, Raval AP, Prado R, Katz LM, Sick TJ, Ginsberg MD, et al. Mild cardiopulmonary arrest promotes synaptic dysfunction in rat hippocampus. Brain Res. 2004;1024:89–96. doi: 10.1016/j.brainres.2004.07.050. [DOI] [PubMed] [Google Scholar]
- 19.Katz L, Ebmeyer U, Safar P, Radovsky A, Neumar R. Outcome model of asphyxial cardiac arrest in rats. J Cereb Blood Flow Metab. 1995;15:1032–1039. doi: 10.1038/jcbfm.1995.129. [DOI] [PubMed] [Google Scholar]
- 20.Ghasi S, Onuaguluchi G. Time course of effect of piperazine citrate on the electrocardiogram of the rat. Am J Ther. 2007;14:524–532. doi: 10.1097/01.pap.0000249959.74771.a1. [DOI] [PubMed] [Google Scholar]
- 21.Kralova E, Mokran T, Murin J, Stankovicova T. Electrocardiography in two models of isoproterenol-induced left ventricular remodelling. Physiol Res. 2008 doi: 10.33549/physiolres.931556. [DOI] [PubMed] [Google Scholar]
- 22.Onuaguluchi G, Tanz RD, McCawley E. Electrocardiographic changes induced by amrinone in the isolated perfused guinea-pig langendorff heart preparation. Arch Int Pharmacodyn Ther. 1983;264:263–273. [PubMed] [Google Scholar]
- 23.Perez-Pinzon MA, Xu GP, Dietrich WD, Rosenthal M, Sick TJ. Rapid preconditioning protects rats against ischemic neuronal damage after 3 but not 7 days of reperfusion following global cerebral ischemia. J Cereb Blood Flow Metab. 1997;17:175–182. doi: 10.1097/00004647-199702000-00007. [DOI] [PubMed] [Google Scholar]
- 24.Dave KR, Lange-Asschenfeldt C, Raval AP, Prado R, Busto R, Saul I, et al. Ischemic preconditioning ameliorates excitotoxicity by shifting glutamate/gamma-aminobutyric acid release and biosynthesis. Journal of neuroscience research. 2005;82:665–673. doi: 10.1002/jnr.20674. [DOI] [PubMed] [Google Scholar]
- 25.Katz LM, Wang Y, Rockoff S, Bouldin TW. Low-dose carbicarb improves cerebral outcome after asphyxial cardiac arrest in rats. Ann Emerg Med. 2002;39:359–365. doi: 10.1067/mem.2002.121522. [DOI] [PubMed] [Google Scholar]
- 26.Cheng O, Ostrowski RP, Liu W, Zhang JH. Activation of liver x receptor reduces global ischemic brain injury by reduction of nuclear factor-kappab. Neuroscience. 2010;166:1101–1109. doi: 10.1016/j.neuroscience.2010.01.024. [DOI] [PMC free article] [PubMed] [Google Scholar]
- 27.Della-Morte D, Dave KR, DeFazio RA, Bao YC, Raval AP, Perez-Pinzon MA. Resveratrol pretreatment protects rat brain from cerebral ischemic damage via a sirtuin 1-uncoupling protein 2 pathway. Neuroscience. 2009;159:993–1002. doi: 10.1016/j.neuroscience.2009.01.017. [DOI] [PMC free article] [PubMed] [Google Scholar]
- 28.Iwata M, Inoue S, Kawaguchi M, Nakamura M, Konishi N, Furuya H. Posttreatment but not pretreatment with selective beta-adrenoreceptor 1 antagonists provides neuroprotection in the hippocampus in rats subjected to transient forebrain ischemia. Anesthesia and analgesia. 2010;110:1126–1132. doi: 10.1213/ANE.0b013e3181d278f7. [DOI] [PubMed] [Google Scholar]
- 29.Fisher M, Feuerstein G, Howells DW, Hurn PD, Kent TA, Savitz SI, et al. Update of the stroke therapy academic industry roundtable preclinical recommendations. Stroke. 2009;40:2244–2250. doi: 10.1161/STROKEAHA.108.541128. [DOI] [PMC free article] [PubMed] [Google Scholar]


