

Abstract
Objective
Soluble ST2 (sST2) is a biomarker of myocardial strain and inflammation. The characteristics of acute respiratory distress syndrome (ARDS) include inflammation and cardiovascular dysfunction. We sought to determine whether plasma sST2 concentration is associated with outcome and response to conservative fluid management, and whether sST2 concentration discriminates ARDS from decompensated heart failure (HF).
Design, Setting, and Patients
We assayed plasma sST2 concentrations in 826 patients in the Fluid and Catheter Treatment Trial (FACTT), a multi-center randomized controlled trial of conservative fluid management in ARDS, as well as a cohort of patients with decompensated HF. We tested whether sST2 was associated with outcome, response to therapy, and diagnostic utility for ARDS vs. HF.
Measurements and Main Results
Non-survivors had higher day 0 (P<.0001) and day 3 (P<.0001) sST2 concentrations. After adjustment for severity of illness, higher sST2 concentration was associated with mortality, with odds ratio (ORadj) 1.47 (95% confidence interval [CI] 0.99 – 2.20, P=.06) at day 0, 2.94 (95% CI 2.00 – 4.33, P<.0001) at day 3, and 3.63 (95% CI 2.38 – 5.53, P<.0001) if sST2 increased between days. Cumulative fluid balance was more positive among patients with higher day 0 (median 5212 mL, interquartile range [IQR] 200 – 12284 vs. 2020 mL, −2034 – 7091; P<0.0001), and day 3 sST2 (median 7678 mL, IQR 2217 – 14278 vs. 1492 mL, −2384 – 6239; P<0.0001). sST2 showed excellent discriminative ability between the FACTT and HF populations (Area under ROC curve=0.98, P<0.0001).
Conclusions
Higher sST2 concentrations are associated with worse outcome in ARDS and may have value for discriminating ARDS from heart failure.
MeSH headings: Acute respiratory distress syndrome, Biomarkers, Fluid Therapy
INTRODUCTION
Acute respiratory distress syndrome (ARDS) is a syndrome of respiratory failure characterized by systemic and pulmonary inflammation and endothelial injury resulting in capillary leak, alveolar edema, and hypoxemia [1]. Pulmonary vascular dysfunction may result in myocardial injury and dysfunction [2]. ARDS is heterogeneous in etiology and progression and clinical data are often insufficient to guide therapy [3]. Studies have shown that biomarkers of inflammation [4,5] and myocardial cell injury [6] are associated with prognosis in ARDS.
Suppression of tumorigenicity-2 (ST2) is an interleukin-1 receptor family member that exists in both a transmembrane and soluble (sST2) isoform [7]. Interleukin-33 (IL-33) is the functional ligand for ST2, and ST2/IL-33 signaling was first described as a mediator of inflammation and immunity [8]. In experiments using murine alveolar cell lines, inflammatory stimuli increased endogenous ST2 production, while pretreatment with sST2 significantly reduced cytokine production [9]. Other studies have shown that serum sST2 concentrations are elevated in patients with disorders including asthma, idiopathic pulmonary fibrosis, severe sepsis, and trauma [10–12]. A study by Hoogerwerf et al. showed that sST2 concentrations were associated with disease severity and mortality in severe sepsis [13]. These data suggest that sST2 could be associated with acute lung inflammation.
Other studies have suggested a role for ST2 in cardiac disease. Isolated cardiomyocytes exposed to mechanical strain upregulate ST2 expression [14]. In animal models, ST2 pathway abnormalities are associated with myocardial fibrosis and dysfunction, and reduced survival [15]. These studies are reinforced by clinical data showing that among patients with acute myocardial infarction, elevated sST2 concentrations are associated with increased risk of heart failure (HF) or mortality [16], while in patients with HF, sST2 concentrations are among the most powerful biomarker predictors of death or hospitalization [17].
Given these associations between ST2, inflammation, and myocardial strain, we hypothesized that sST2 concentrations would be associated with clinical outcomes in ARDS, a syndrome that combines elements of pulmonary inflammation and myocardial dysfunction. Given that sST2 is increased in conditions of cardiomyocyte stretch, we also sought to evaluate whether sST2 concentration was associated with response to treatment with different fluid management strategies. Finally, we sought to compare sST2 concentrations from ARDS patients to patients with myocardial strain due to acutely decompensated HF. We utilized samples from the Fluid and Catheter Treatment Trial (FACTT), a randomized controlled trial of liberal vs. conservative fluid management in patients with ARDS [18], and the N-terminal Pro-BNP Investigation of Dyspnea in the Emergency Department (PRIDE), an observational study of emergency department patients presenting with respiratory distress [19].
MATERIALS & METHODS
Study Design
Patients with ARDS, at that time referred to as acute lung injury prior to publication of the Berlin criteria [20], were taken from FACTT [18]. This study demonstrated significant associations between conservative fluid management and the outcomes of ventilator-free days (VFD), and ICU-free days (IFD). All FACTT patients with available blood samples were included in our study. PRIDE was a prospective study of patients with acute respiratory distress, evaluating the utility of natriuretic peptide testing for HF diagnosis. We selected PRIDE subjects adjudicated to have acutely decompensated HF (N=209). Complete FACTT and PRIDE protocols are as previously described [18,19], including inclusion and exclusion criteria. FACTT exclusion criteria [18] included presence of ARDS for more than 48 hours, inability to obtain consent, or presence of chronic or irreversible conditions influencing survival (such as advanced cancer), impairing weaning, or compromising protocol compliance (e.g., dialysis dependence). PRIDE exclusion criteria [19] included myocardial ischemia, severe chronic kidney disease, unblinded natriuretic peptide measurement, or prolonged interval between diuretic treatment and enrollment.
We utilized blood samples taken from FACTT patients on day 0 (the day of study enrollment) and day 3 (72 hours later), and PRIDE samples from day 0 (emergency department presentation). All studies were approved by institutional review boards.
Data Collection
FACTT baseline data included demographic characteristics, coexisting conditions, cause of ARDS, and Acute Physiology and Chronic Health Evaluation (APACHE) III score [21]. Physiologic variables were collected by study protocol. Outcomes included 60-day mortality, VFD, and IFD from hospital day 1–28. Other data included daily cumulative fluid balance, renal function parameters, and presence of shock. PRIDE data included baseline characteristics, chest radiograph interpretation, and adjudicated etiology of respiratory distress. Acute kidney injury (AKI) was defined according to Acute Kidney Injury Network (AKIN) stage 1 criteria [22], as 50% or 0.3 mg/dL increase in serum creatinine from study days 0–3.
Blood sample analysis
Samples from both studies were stored in EDTA plasma at −80 C and assayed using a highly sensitive sST2 assay (Presage™, Critical Diagnostics, San Diego, CA, USA) [23].
Statistical Analysis
Data were analyzed using SAS v9.3 software (SAS Institute, Cary, NC, USA). Categorical variables were compared using chi-squared tests. Continuous variables were compared using Wilcoxon rank-sum tests. Receiver-operating characteristic (ROC) analysis was used to analyze the relationship between sST2 and mortality, and a cutpoint for mortality prediction was selected using the Youden [24] method. This cutpoint was used to stratify patients into groups by lower or higher sST2 concentration. Multivariate logistic regression was used to study the association between sST2 and 60-day mortality, adjusted for admission APACHE III score. Linear regression was used to study the association between day 0 sST2, fluid balance, and other covariates (shock, kidney injury, diuretic dose, and therapeutic strategy).
PRIDE samples were used to test the value of sST2 concentration in discriminating between ARDS patients (FACTT) and acutely decompensated HF patients (PRIDE) using ROC analysis.
RESULTS
Baseline characteristics in FACTT
FACTT enrollment occurred as previously published [18]. Paired day 0/day 3 specimens were available from 826 patients. Patients from liberal and conservative treatment strategy groups had similar baseline characteristics (Table 1).
Table 1.
Baseline characteristics*
| Characteristic | Liberal Strategy (N=408) |
Conservative Strategy (N=418) |
P |
|---|---|---|---|
| Age (yr) | 49 (38–60) | 48 (38–59) | 0.91 |
| Female sex (%) | 45 | 48 | 0.39 |
| Race or Ethnic group (%) | |||
| White | 65 | 66 | 0.69 |
| Black | 23 | 19 | 0.20 |
| Other** | 13 | 15 | 0.33 |
| Primary lung injury (%) | |||
| Pneumonia | 47 | 45 | 0.46 |
| Sepsis | 25 | 22 | 0.18 |
| Aspiration | 13 | 17 | 0.13 |
| Trauma | 8 | 8 | 0.77 |
| Multiple transfusion | 0 | 2 | 0.08 |
| Other | 6 | 7 | 0.64 |
| Coexisting conditions (%) | |||
| Diabetes | 19 | 17 | 0.56 |
| HIV infection or AIDS | 7 | 7 | 0.79 |
| Cirrhosis | 4 | 3 | 0.77 |
| Solid tumors | 3 | 1 | 0.02 |
| Leukemia | 1 | 2 | 0.12 |
| Lymphoma | 1 | 2 | 0.39 |
| Immunosuppression | 7 | 8 | 0.51 |
| APACHE III score | 91 (71–116) | 88 (69–111) | 0.20 |
| Medical ICU (%) | 66 | 64 | 0.68 |
| Hemodynamic variables | |||
| Mean arterial pressure (mm Hg) | 75 (67–87) | 75.0 (67.0–85.0) | 0.50 |
| CVP (mm Hg) | 12 (9–15) | 11 (8–15) | 0.09 |
| PAOP (mm Hg) | 16 (12–20) | 15 (12–20) | 0.56 |
| Cardiac index (liters/min/m2) | 4.1 (3.3–5.1) | 4.0 (3.3–5.3) | 0.94 |
| Mixed venous oxygen saturation (%) | 69 (64–76) | 70 (65–75) | 0.82 |
| Met shock criteria (%) | 37 | 36 | 0.80 |
| Prerandomization fluid balance (ml) | 1960 (468–4285) | 1914 (500–4477) | 0.94 |
| Respiratory variables | |||
| Tidal volume (ml/kg) | 450 (400–514) | 450 (400–510) | 0.51 |
| Plateau pressure (cm of water) | 26 (21–30) | 26 (22–30) | 0.86 |
| PaO2:FiO2 | 138.2 (103.3–187.5) | 142.9 (99.0–198.3) | 0.88 |
| Oxygenation index† | 10.3 (6.7–16.0) | 10.2 (6.1–16.8) | 0.88 |
| PEEP (cm of water) | 10 (5–12) | 10 (5–12) | 0.66 |
| Lung injury score‡ | 3 (2–4) | 3 (2–4) | 0.33 |
| Arterial pH | 7.37 (7.30–7.42) | 7.37 (7.31–7.43) | 0.60 |
| Renal and metabolic variables | |||
| Blood urea nitrogen (mg/dl) | 18 (12–31) | 17 (11–28) | 0.17 |
| Creatinine (mg/dl) | 1.0 (0.7–1.5) | 1.0 (.07–1.5) | 0.58 |
| Bicarbonate (mmol/liter) | 22.0 (19.0–25.0) | 13.0 (19.0–26.0) | 0.19 |
| Hemoglobin (g/dl) | 10.1 (9.1–11.6) | 10.2 (9.1–11.4) | 0.47 |
| Glucose (mg/dl) | 122 (102–161) | 121 (100–158) | 0.37 |
Abbreviations: HIV (human immunodeficiency virus), AIDS (acquired immunodeficiency syndrome), APACHE (Acute Physiology and Chronic Health Evaluation), ICU (intensive care unit), CVP (central venous pressure), PAOP (pulmonary artery occlusion pressure), and PEEP (positive end-expiratory pressure).
Continuous variables are provided as median (25%–75% interquartile range). Categorical variables are provided as percentages. Due to rounding, percentages may not total 100%.
For purposes of de-identification, all races other than black and white were reported as “other” by the ARDS Network data repository.
Oxygenation index is calculated as (mean airway pressure x FiO2)/PaO2 x 100
Lung injury score ranges from 0 to 4, based on number of quadrants affected on chest radiograph
Characteristics of ST2 concentrations
Day 0 and day 3 sST2 concentrations were significantly higher in non-survivors than survivors (Figure 1). Day 0 median sST2 concentration was 517 ng/mL, (interquartile range [IQR] 300 – 684 ng/mL) in survivors, vs. 590 ng/mL (IQR 463 – 947 ng/mL) in non-survivors (P<0.0001). Day 3 median sST2 concentration was 250 ng/mL (IQR 139 – 460 ng/mL) in survivors vs. 495 ng/mL (IQR 304 – 636 ng/mL) in non-survivors (P<0.0001). The change in sST2 (day 3 concentration minus day 0 concentration) was significantly different between survivors (median Δ −210 ng/mL, IQR −413 – 53 ng/mL) and non-survivors (median Δ −104 ng/mL, IQR −336 – 34 ng/mL, P<0.0001). For patients whose sST2 concentration rose between days (N=138), mortality was significantly higher (46% vs. 19% for other patients, P<0.0001).
Figure 1.
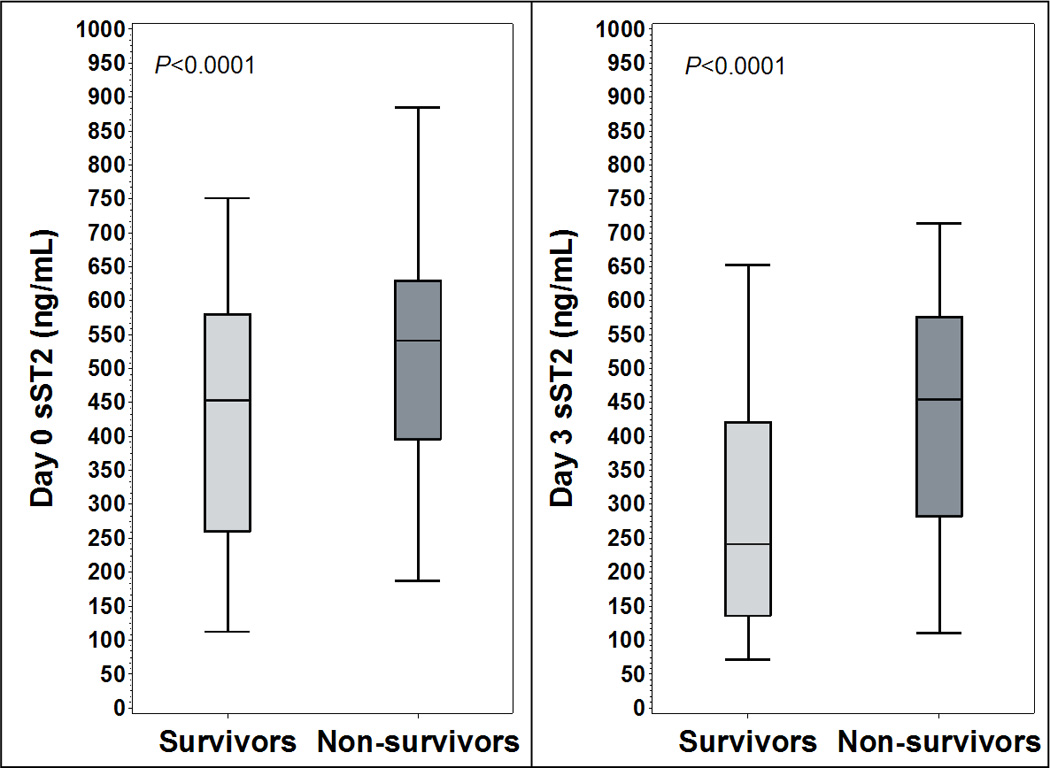
Day 0 and day 3 plasma sST2 concentration compared between survivors and non-survivors
Legend: Vertical bars represent median +/− interquartile range, error bars represent 95% confidence interval
Major Outcomes
We studied the relationship between sST2 and 60-day mortality using logistic regression (Table 2). ROC analysis was used to select cut-points for separating patients into high and low sST2 groups at day 0 and day 3. The day 0 sST2 ROC cut-point was 534 ng/mL and the day 3 ROC cut-point was 296 ng/mL. Both day 0 and day 3 sST2 concentrations above the respective cut-points, as well as increasing sST2 concentration between day 0 and day 3, were significantly associated with increased odds of death. We adjusted for severity of illness by adding baseline APACHE III score as a covariate to each model. Day 3 sST2 concentration above the ROC cut-point and increasing sST2 concentration between day 0 and day 3 continued to be associated with increased odds of death after adjustment. Higher day 0 sST2 concentration was not significantly associated with mortality in the adjusted model. Testing for collinearity showed that both day 0 and day 3 concentrations were significantly correlated with APACHE III (R=0.40, P<0.0001 for day 0 and R=0.42, P<0.0001 for day 3). Change in sST2 concentration was not correlated with APACHE III (R= −0.06, P=0.09).
Table 2.
Logistic regression analysis of association between sST2 concentrations and 60-day mortality
| Variable | Odds Ratio |
95% CI low |
95% CI high |
P |
|---|---|---|---|---|
| Unadjusted associations between sST2 concentrations and mortality | ||||
| Day 0 sST2 above ROC cutpoint* | 2.33 | 1.61 | 3.38 | <.0001 |
| Day 3 sST2 above ROC cutpoint** | 4.55 | 3.18 | 6.51 | <.0001 |
| sST2 concentrations increased between day 0 and day 3† | 3.66 | 2.50 | 5.39 | <.0001 |
| Adjusted Day 0 analysis | ||||
| Day 0 sST2 above ROC cutpoint* | 1.47 | 0.99 | 2.20 | .06 |
| APACHE III score (per 10 unit increase) | 1.03 | 1.02 | 1.03 | <.0001 |
| Adjusted Day 3 analysis | ||||
| Day 3 sST2 above ROC cutpoint** | 2.94 | 2.00 | 4.33 | <.0001 |
| APACHE III score (per 10 unit increase) | 1.02 | 1.02 | 1.03 | <.0001 |
| Adjusted analysis of change in sST2 concentrations | ||||
| sST2 concentrations increased between day 0 and day 3† |
3.63 | 2.38 | 5.53 | <.0001 |
| APACHE III score (per 10 unit increase) | 1.03 | 1.02 | 1.03 | <.0001 |
Abbreviations: CI: confidence interval, ROC: receiver operating characteristic, APACHE: Acute Physiology and Chronic Health Evaluation
Odds ratio for 60-day mortality associated with day 0 sST2 concentration above the ROC cutpoint
Odds ratio for 60-day mortality associated with day 3 sST2 concentration above the ROC cutpoint
Odds ratio for 60-day mortality associated with increase in sST2 concentration between day 0 and day 3
Higher sST2 concentrations at day 0 and day 3 were independently associated with fewer ventilator-free (VFD) and ICU-free days (IFD) in the first 28 days of hospitalization. Increasing sST2 concentration between days 0 and 3 was also associated with decreases in both measures (Table 3).
Table 3.
Relationship between sST2 concentration and secondary outcomes
| Group | VFD (median, 25%–75% IQR) |
P | IFD (median, 25%–75% IQR) |
P |
|---|---|---|---|---|
| Day 0 sST2 concentration above ROC cutpoint |
16 (0–22) | 13 (0–21) | ||
| Day 0 sST2 concentration below ROC cutpoint |
21 (11–24) | <.0001 | 18 (10–23) | <.0001 |
| Day 3 sST2 concentration above ROC cutpoint |
10 (0–20) | 6 (0–18) | ||
| Day 3 sST2 concentration below ROC cutpoint |
21 (14–25) | <.0001 | 19 (11–23) | <.0001 |
| sST2 increased from day 0 to day 3 | 5 (0–19) | 1 (0–16) | ||
| sST2 did not increase from day 0 to day 3 | 19 (6–24) | <.0001 | 17 (2–22) | <.0001 |
Abbreviations: ROC: receiver operating characteristic, VFD: ventilator-free days in first 28 days of hospitalization, IFD: ICU-free days in first 28 days of hospitalization, IQR: interquartile range
Effect of randomized fluid management strategy on sST2 concentration
Prior to initiation of fluid management, baseline sST2 concentrations were similar in both treatment groups (median 540 ng/mL, IQR 348 – 763 ng/mL in liberal group vs. 526 ng/mL, IQR 306 – 713 ng/mL in conservative group, P=0.15). After therapy initation, the change in concentration between day 0 and day 3 did not significantly differ between groups (median Δ −182 ng/mL, IQR −395 – −36 ng/mL liberal vs. median Δ −186 ng/mL, IQR −388 – −37 ng/mL conservative, P=0.86). We then examined the group of patients who responded to protocol-directed therapy (as measured by successful reduction in CVP between days 0 and 3). These “responders” had higher CVP at baseline (median 13, IQR 10 – 17 mm Hg vs. median 10, IQR 7–12 mm Hg, P<0.0001), but received higher cumulative doses of furosemide (median 120 mg, IQR 20 – 300 mg vs. median 40 mg, IQR 0–160 mg, P<0.0001), and ultimately had lower cumulative fluid balance (median 2213 cc, IQR −2205 – 7580 cc vs. median 7605 cc, IQR 2441 – 13486 cc, P<0.0001). In the conservative fluid management group, this group of patients whose CVP dropped had significantly greater reduction in sST2 (median Δ −208 ng/mL, IQR −389 – −48 ng/mL, P=0.03), whereas sST2 concentrations did not decrease significantly among the corresponding group of patients whose CVP declined in the liberal management group (median Δ −186 ng/mL, IQR −378 – −46 ng/mL, P=0.64). These associations remained significant even after excluding patients with shock (P=0.05 in conservative group, P=0.73 in liberal group). The proportion of patients developing AKI was also similar between “responder” groups (30% vs 27%, P=0.49).
To explore these findings, we studied cumulative fluid balance between days 0–3. Fluid balance was significantly more positive among patients with higher day 0 sST2 (median 5212 mL, IQR 200 – 12284 mL vs. 2020 mL, IQR −2034 – 7091 mL; P<0.0001), and day 3 sST2 (7678 mL, IQR 2217 – 14278 mL vs. 1492 mL, IQR −2384 – 6239 mL; P<0.0001). Because FACTT protocols required shock resolution prior to initiating treatment strategies, we performed subgroup analyses of patients who were not in shock at any point through day 3 (N=415). Among non-shock patients, higher sST2 was associated with more positive fluid balance, median 1847 mL (IQR −1695 – 7131 mL) among higher day 0 sST2 patients vs. 64 mL (IQR −3480 – 3570 mL) among low day 0 sST2 patients (P=0.001), and median 2753 mL, (IQR −1340 – 7565 mL) for high day 3 sST2 patients vs. median 206 mL (IQR −3158 – 3574) for low day 3 sST2 patients (P<0.0001). We then compared fluid balance between fluid management groups with and without shock. Full results of these analyses are shown in Figure 2, representing median fluid balances compared between fluid management and shock categories (data available in Supplemental Table 2). For every combination of shock status and treatment group, fluid balance was more positive among patients with higher sST2, and in most cases this was statistically significant. Patients with higher day 3 sST2 had significantly more positive fluid balance for all shock categories regardless of treatment group.
Figure 2.

Cumulative day 0 to day 3 fluid balance, compared by management strategy, sST2 category, and presence of shock
Legend: Vertical axes represent median cumulative day 0 to day 3 fluid balance in mL
To understand how day 3 sST2 concentration varied according to factors occurring on days 0 through 3, we conducted linear regression with day 3 sST2 concentration as the outcome, and other factors as explanatory variables (Table 4). In this model, baseline sST2 concentration, fluid balance, severity of illness, and development of AKI all had significant effects on day 3 sST2.
Table 4.
Multivariate linear regression model for effect of covariates on day 3 sST2 concentration
| Variable | F Value | Parameter Estimate |
95% Confidence Limits | P | |
|---|---|---|---|---|---|
| Day 0 sST2 (per unit) | 182.64 | 0.34 | 0.29 | 0.39 | <.0001 |
| Day 0–3 fluid balance | 54.12 | 0.01 | 0.006 | 0.01 | <.0001 |
| AKI | 18.11 | 84.96 | 45.76 | 124.15 | <.0001 |
| APACHE III score | 7.15 | 0.91 | 0.24 | 1.58 | 0.008 |
| Conservative fluid management | 3.10 | 33.0 | −3.78 | 69.78 | 0.08 |
| Shock | 0.57 | 14.65 | −23.44 | 52.74 | 0.45 |
| Cumulative furosemide dose | 0.35 | −0.02 | −0.09 | 0.05 | 0.56 |
Outcome variable for this model was total day 3 sST2 concentration, with explanatory variables shown above.
Abbreviations: AKI: acute kidney injury, APACHE: Acute Physiology and Chronic Health Evaluation
Diagnostic significance of day 0 sST2 concentration
Baseline characteristics of PRIDE and FACTT populations are compared in Supplemental Table 1. FACTT patients were younger and more likely to have human immunodeficiency virus infection. PRIDE patients were more likely to be diabetic or to have malignancies. While APACHE score data were not available from PRIDE, there were small but statistically significant differences in serum blood urea nitrogen, creatinine, bicarbonate, glucose, and hematocrit (all higher in PRIDE).
Baseline sST2 concentrations were significantly lower in PRIDE than FACTT (median 534 [IQR 325.0 – 724.9] vs 43 [26.4 – 78.6] ng/mL, P<0.0001). Among PRIDE patients with radiographic evidence of pulmonary edema (N=87), median sST2 concentrations were 46 ng/mL (IQR 28.4 – 70.3), significantly lower than FACTT patients (P<0.0001, Figure 3). ROC analysis (Figure 4) demonstrated area under the ROC curve of 0.98 (P<0.0001), and an sST2 cutoff of 142 ng/mL was 91% sensitive and 94% specific for discriminating FACTT and PRIDE patients, with positive predictive value of 99%. In logistic regression, sST2 concentration above 142 ng/mL was associated with OR of 191.4 for the diagnosis of ARDS (95% CI 83.6 – 438.1, P<0.0001).
Figure 3.

FACTT ARDS patients vs. PRIDE acutely decompensated HF patients
Legend: Day 0 plasma sST2 concentration compared between acute respiratory distress syndrome (ARDS) patients from FACTT and acutely decompensated heart failure (HF) patients from PRIDE. Vertical bars represent median +/− interquartile range, error bars represent 95% confidence interval
Figure 4.

Receiver-operating characteristic (ROC) curve for baseline sST2 ability to discriminate between ARDS and acutely decompensated HF
Legend: Figure depicts sensitivity and 1-specificity plotted for each value of day 0 sST2, with calculated area under curve (AUC)
DISCUSSION
Higher plasma sST2 concentration in ARDS was associated with unfavorable outcomes: increased duration of mechanical ventilation, longer ICU, and increased mortality. Plasma sST2 was also closely related to fluid balance, a relationship that persisted when accounting for shock, AKI, and diuretic dose. Interestingly, FACTT patients with ARDS had markedly higher sST2 concentrations than PRIDE patients with acutely decompensated HF, such that baseline sST2 concentrations were highly discriminative between these groups.
Higher sST2 concentrations on days 0 and 3 were associated with worse outcomes, and at both time points, sST2 concentration was correlated with baseline APACHE III score. Of note, increasing sST2 concentration between days 0 and 3 was associated with markedly increased mortality risk, suggesting that changes in sST2 over time might provide information regarding changes in clinical condition. As sST2 is known to be involved in conditions of inflammation and myocardial strain[11,12,16], it is not clear whether elevated concentrations are related to the presence of either process, or to other aspects of ARDS pathophysiology.
We found no evidence that randomization to conservative fluid management lowered sST2 concentrations. However, among patients whose CVP decreased when treated accordingly, sST2 decreased, whereas the same was not true for patients treated with liberal fluid management. Fluid management protocols were targeted towards reducing CVP, suggesting that falling sST2 paralleled successful treatment. In addition, there was a relationship between sST2 and fluid balance. Among patients randomized to liberal management, higher sST2 on day 0 was associated with significantly higher cumulative fluid balance from days 0–3, whereas among those receiving conservative fluid management, fluid balance was not significantly different, suggesting that conservative treatment may mitigate the association between sST2 concentration and fluid balance. At day 3, higher sST2 concentration was associated with significantly higher fluid balance among all groups. Although causality cannot be determined, it seems plausible that sST2 concentrations at day 3 are reflective of more positive fluid balance over days 0–3. Further evidence for this is provided by linear regression, showing a significant association between fluid balance and day 3 sST2 concentration, modeled as an outcome.
These data suggest that sST2 concentrations may describe a population of patients who are responsive to conservative fluid management, in that sST2 concentrations fall along with CVP, and are associated with fluid balance. It is difficult to elucidate whether high sST2 concentrations at day 3 were a result of inadequate attempts at conservative fluid management or whether these patients represent a subset of ARDS patients who were refractory to therapy. On a related note, as Liu and colleagues showed, liberal fluid management was associated with a greater incidence of organ failure (specifically, AKI) in FACTT [25]. Another study suggesting that diuretic use was protective against mortality in this cohort [26]. These suggest that sST2 concentration might identify a population of patients who might benefit from increased fluid removal. This hypothesis could be tested in a clinical trial.
In addition to the prognostic information discussed, and existing data demonstrating utility for risk stratification in ischemic heart disease and HF [16,29,30], our data suggest potential diagnostic utility for sST2. This is of interest because both ARDS and acutely decompensated HF involve respiratory failure and pulmonary edema, and may be difficult to distinguish clinically [27,28]. For this analysis, we selected HF patients from PRIDE with respiratory distress and radiographic evidence of pulmonary edema compatible with the diagnosis of ARDS, and found that baseline sST2 values had high sensitivity and specificity for discriminating between study populations. This finding should be further developed to determine whether sST2 concentration may be used as a biomarker for diagnostic purposes.
Despite these findings, there are still important questions to be answered regarding the mechanistic role of sST2 in ARDS. To date, human studies have focused on the role of sST2 as a marker of myocardial strain. Given the associations found with fluid balance and clinical outcomes, it seems plausible that sST2 is elevated due to myocardial strain in patients with ARDS. Other studies in similar populations have also suggested a prognostic role for myocardial injury markers[6,31]. However, it is not clear why patients with ARDS had markedly higher sST2 concentrations than HF patients; in patients with end-stage HF syndromes, sST2 concentrations may be higher than the subjects in PRIDE, but still most often lower than most of the ARDS subjects from FACTT (J. Januzzi, personal observation). Other studies have also shown lower sST2 values in patients with other cardiac conditions than the concentrations seen in ARDS patients here[16,17]. We note that there are numerous other studies suggesting a role for this molecule in inflammation, which may explain the high sST2 values we recorded in FACTT. In particular, studies have implicated the ST2/IL-33 pathway in the pathogenesis of asthma and other pulmonary inflammatory states. One study by Tajima and colleagues showed increased sST2 expression in a mouse model of bleomycin lung injury and in vitro preparations of human lung fibroblasts and alveolar epithelium that were subjected to inflammatory stimuli [32]. Another human showed increased sST2 concentrations during exacerbations of pulmonary fibrosis [12]. Combined with our findings, it seems plausible that the combination of myocardial strain and inflammation seen in ARDS would result in markedly higher concentrations than myocardial strain alone. Further research is needed to determine what factors are associated with sST2 production in ARDS, whether this molecule acts as an important mediator in human ARDS, and whether this biomarker is specific for pulmonary inflammation.
We acknowledge that this study has some important limitations. First, conceptually, in order for a biomarker to add utility to clinical practice or scientific understanding, it should provide information that is not readily available through routine clinical measures [33]. For example, although baseline sST2 values here showed excellent discriminative ability for ARDS vs. HF, the “gold standard” in this study is still routine clinical diagnosis. Another important caveat to these results is the high potential for unappreciated confounding in comparing FACTT and PRIDE patients. There were major differences in the design of these studies, and study results could vary considerably on that basis alone. While we have hypothesized that the large difference in sST2 between groups is related to diagnosis, this relationship might be confounded by differences in patient characteristics, sampling time, need for mechanical ventilation, or other unmeasured variables. Because of the question of the difference between comparison groups, these results can only be viewed as preliminary and hypothesis-generating. Further studies accounting for confounders are necessary to determine whether sST2 can truly discriminate between conditions. If this biomarker offers specific information regarding pathophysiology that cannot be otherwise obtained, it could be a useful adjunct to clinical diagnosis or offer other insights into disease processes. In addition, sST2 may provide value in terms of overall prognosis as well as predicting or gauging response to fluid management strategies. However, these possibilities must be proven in studies that are designed with those goals in mind.
In addition, partly because we were limited by the available data and biospecimens, and by the size of our manuscript, we did not include detailed analyses of pathophysiologic factors such as subsequent organ failures (including serial organ failure scores, or APACHE III scores after the first 24 hours), the relationship between biomarker levels and measures of cardiac function (such as right ventricular function), or the relationship between sST2 and other inflammatory or cardiac biomarkers such as interleukins or cardiac troponins. As such, our manuscript is limited in terms of understanding the contribution of such factors to characteristics of sST2 concentration in ARDS patients. Further study is required to better understand these issues.
CONCLUSIONS
Plasma sST2 concentrations in patients with ARDS are predictive of worse outcomes, and are associated with fluid management parameters such as fluid balance and response to fluid management strategy. When patients from the FACTT and PRIDE studies were compared, baseline sST2 concentrations also showed excellent ability to discriminate between these study populations, although these results should be viewed as hypothesis-generating, and future studies are needed to test this in conjunction with other standard clinical assessments that are used to distinguish HF from ARDS. Additional studies will be needed to further determine mechanistic factors associated with sST2 production and evaluate its clinical utility.
Supplementary Material
ACKNOWLEDGEMENTS
The authors acknowledge the work of the ARDS Network clinical investigators who enrolled patients and compiled the original data and samples utilized in this study. The following persons and institutions participated in the FACTT study: Steering Committee Chair: G.R. Bernard; Clinical Coordinating Center: D.A. Schoenfeld, B.T. Thompson, N. Ringwood, C. Oldmixon, F. Molay, A. Korpak, R. Morse, D. Hayden, M. Ancukiewicz, A. Minihan; Protocol-Review Committee—J.G.N. Garcia, R. Balk, S. Emerson, M. Shasby, W.Sibbald; Data Safety and Monitoring Board: R. Spragg, G. Corbie-Smith, J. Kelley, K. Leeper, A.S. Slutsky, B. Turnbull, C. Vreim; ARDS Clinical Trials Network Consultant: P. Parsons; Clinical Centers are as follows: University of Washington, Harborview: L. Hudson, K. Steinberg, M. Neff, R. Maier, K. Sims, C. Cooper, T. Berry-Bell, G. Carter, L. Andersson; University of Michigan: G.B. Toews, R.H. Bartlett, C. Watts, R. Hyzy, D. Arnoldi, R. Dechert, M. Purple; University of Maryland: H. Silverman, C. Shanholtz, A. Moore, L. Heinrich, W. Corral; Johns Hopkins University: R. Brower, D. Thompson, H. Fessler, S. Murray, A. Sculley; Cleveland Clinic Foundation: H.P. Wiedemann, A.C. Arroliga, J. Komara, T. Isabella, M. Ferrari; University Hospitals of Cleveland: J. Kern, R. Hejal, D. Haney; MetroHealth Medical Center: A.F. Connors; University of Colorado Health Sciences Center: E. Abraham, R. McIntyre, F. Piedalue; Denver Veterans Affairs Medical Center: C. Welsh; Denver Health Medical Center: I. Douglas, R. Wolkin; St. Anthony Hospital: T. Bost, B. Sagel, A. Hawkes; Duke University: N. MacIntyre, J. Govert, W. Fulkerson, L. Mallatrat, L. Brown, S. Everett, E. VanDyne, N. Knudsen, M. Gentile; University of North Carolina: P. Rock, S. Carson, C. Schuler, L. Baker, V. Salo; Vanderbilt Universit: A.P. Wheeler, G. Bernard, T. Rice, S. Bozeman, T. Welch; University of Pennsylvania: P. Lanken, J. Christie, B. Fuchs, B Finkel, S. Kaplan, V. Gracias, C.W. Hanson, P. Reilly, M.B. Shapiro, R. Burke, E. O’Connor, D. Wolfe; Jefferson Medical College: J. Gottlieb, P. Park, D.M. Dillon, A. Girod, J. Furlong; LDS Hospital: A. Morris, C. Grissom, L. Weaver, J. Orme, T. Clemmer, R. Davis, J. Gleed, S. Pies, T. Graydon, S. Anderson, K. Bennion, P. Skinner; McKay-Dee Hospital: C. Lawton, J. d’Hulst, D. Hanselman; Utah Valley Regional Medical Center: K. Sundar, T. Hill, K. Ludwig, D. Nielson; University of California, San Francisco: M.A. Matthay, M. Eisner, B. Daniel, O. Garcia; San Francisco General: J. Luce, R. Kallet; University of California, San Francisco, Fresno: M. Peterson, J. Lanford; Baylor College of Medicine: K. Guntupalli, V. Bandi, C. Pope; Baystate Medical Center: J. Steingrub, M. Tidswell, L. Kozikowski; Louisiana State University Health Sciences Center: B. deBoisblanc, J. Hunt, C. Glynn, P. Lauto, G. Meyaski, C. Romaine; Louisiana State University Earl K. Long Center: S. Brierre, C. LeBlanc, K. Reed; Alton-Ochsner Clinic Foundation: D. Taylor, C. Thompson; Tulane University Medical Center: F. Simeone, M. Johnston, M. Wright; University of Chicago: G. Schmidt, J. Hall, S. Hemmann, B. Gehlbach, Vinayak, W. Schweickert; Northwestern University: J. Dematte D’Amico, H. Donnelly; University of Texas Health Sciences Center: A. Anzueto, J. McCarthy, S. Kucera, J. Peters, T. Houlihan, R. Steward, D. Vines; University of Virginia: J. Truwit, A.F. Connors, M. Marshall, W. Matsumura, R. Brett; University of Pittsburgh: M. Donahoe, P. Linden, J. Puyana, L. Lucht, A. Verno; Wake Forest University: R.D. Hite, P. Morris, A. Howard, A. Nesser, S. Perez; Moses Cone Memorial Hospital: P. Wright, C. Carter-Cole, J. McLean; St. Paul’s Hospital, Vancouver: J. Russell, L. Lazowski, K. Foley; Vancouver General Hospital: D. Chittock, L. Grandolfo; Mayo Foundation: M. Murray.
This study was supported in part by National Heart, Lung, and Blood Institute (NHLBI) grants HL60710, HL67197, HL084060, and HL086667. Soluble ST2 assays were donated by Critical Diagnostics. The FACTT study was supported, in part, by contracts (NO1-HR 46046-64 and NO1-HR-16146-54) with the NHLBI.
Footnotes
Publisher's Disclaimer: This is a PDF file of an unedited manuscript that has been accepted for publication. As a service to our customers we are providing this early version of the manuscript. The manuscript will undergo copyediting, typesetting, and review of the resulting proof before it is published in its final citable form. Please note that during the production process errors may be discovered which could affect the content, and all legal disclaimers that apply to the journal pertain.
Dr. Harris is a board member at Altor Biosciences, has given expert testimony for MedQuest and has received payment for the development of educational presentations from the American Physician Inst. Dr. Matthay has consulted for GSK, Biogen, and Roche Genentech. Dr. Januzzi is a board member, has consulted for and received grant support from Critical Diagnostics. The rest of the authors have not disclosed any potential conflicts of interest.
REFERENCES
- 1.Ware LB, Matthay MA. The acute respiratory distress syndrome. N. Engl. J. Med. 2000 May 4;342(18):1334–1349. doi: 10.1056/NEJM200005043421806. PMID: 10793167. [DOI] [PubMed] [Google Scholar]
- 2.Bull TM, Clark B, McFann K, Moss M. Pulmonary vascular dysfunction is associated with poor outcomes in patients with acute lung injury. Am. J. Respir. Crit. Care Med. 2010 Nov 1;182(9):1123–1128. doi: 10.1164/rccm.201002-0250OC. PMID: 20558628. [DOI] [PMC free article] [PubMed] [Google Scholar]
- 3.Calfee CS, Eisner MD, Ware LB, Thompson BT, Parsons PE, Wheeler AP, et al. Trauma-associated lung injury differs clinically and biologically from acute lung injury due to other clinical disorders. Crit. Care Med. 2007 Oct;35(10):2243–2250. doi: 10.1097/01.ccm.0000280434.33451.87. PMID: 17944012. [DOI] [PMC free article] [PubMed] [Google Scholar]
- 4.Calfee CS, Ware LB, Glidden DV, Eisner MD, Parsons PE, Thompson BT, et al. Use of risk reclassification with multiple biomarkers improves mortality prediction in acute lung injury. Crit. Care Med. 2011 Apr;39(4):711–717. doi: 10.1097/CCM.0b013e318207ec3c. PMID: 21283009. [DOI] [PMC free article] [PubMed] [Google Scholar]
- 5.Ware LB, Koyama T, Billheimer DD, Wu W, Bernard GR, Thompson BT, et al. Prognostic and pathogenetic value of combining clinical and biochemical indices in patients with acute lung injury. Chest. 2010 Feb;137(2):288–296. doi: 10.1378/chest.09-1484. PMID: 19858233. [DOI] [PMC free article] [PubMed] [Google Scholar]
- 6.Bajwa EK, Boyce PD, Januzzi JL, Gong MN, Thompson BT, Christiani DC. Biomarker evidence of myocardial cell injury is associated with mortality in acute respiratory distress syndrome. Crit. Care Med. 2007 Nov;35(11):2484–2490. doi: 10.1097/01.ccm.0000281852.36573.22. PMID: 18084839. [DOI] [PubMed] [Google Scholar]
- 7.Iwahana H, Yanagisawa K, Ito-Kosaka A, Kuroiwa K, Tago K, Komatsu N, et al. Different promoter usage multiple transcription initiation sites of the interleukin-1 receptor-related human ST2 gene in UT-7 and TM12 cells. Eur. J. Biochem. 1999 Sep;264(2):397–406. doi: 10.1046/j.1432-1327.1999.00615.x. PMID: 10491084. [DOI] [PubMed] [Google Scholar]
- 8.Schmitz J, Owyang A, Oldham E, Song Y, Murphy E, McClanahan TK, et al. IL-33, an interleukin-1-like cytokine that signals via the IL-1 receptor-related protein ST2 and induces T helper type 2-associated cytokines. Immunity. 2005 Nov;23(5):479–490. doi: 10.1016/j.immuni.2005.09.015. PMID: 16286016. [DOI] [PubMed] [Google Scholar]
- 9.Oshikawa K, Yanagisawa K, Tominaga Sichi, Sugiyama Y. ST2 protein induced by inflammatory stimuli can modulate acute lung inflammation. Biochem. Biophys. Res. Commun. 2002 Nov 22;299(1):18–24. doi: 10.1016/s0006-291x(02)02578-0. PMID: 12435383. [DOI] [PubMed] [Google Scholar]
- 10.Brunner M, Krenn C, Roth G, Moser B, Dworschak M, Jensen-Jarolim E, et al. Increased levels of soluble ST2 protein and IgG1 production in patients with sepsis and trauma. Intensive Care Med. 2004 Jul;30(7):1468–1473. doi: 10.1007/s00134-004-2184-x. PMID: 14991091. [DOI] [PubMed] [Google Scholar]
- 11.Oshikawa K, Kuroiwa K, Tago K, Iwahana H, Yanagisawa K, Ohno S, et al. Elevated soluble ST2 protein levels in sera of patients with asthma with an acute exacerbation. Am. J. Respir. Crit. Care Med. 2001 Jul 15;164(2):277–281. doi: 10.1164/ajrccm.164.2.2008120. PMID: 11463601. [DOI] [PubMed] [Google Scholar]
- 12.Tajima S, Oshikawa K, Tominaga S, Sugiyama Y. The increase in serum soluble ST2 protein upon acute exacerbation of idiopathic pulmonary fibrosis. Chest. 2003 Oct;124(4):1206–1214. doi: 10.1378/chest.124.4.1206. PMID: 14555548. [DOI] [PubMed] [Google Scholar]
- 13.Hoogerwerf JJ, Tanck MWT, Van Zoelen MAD, Wittebole X, Laterre P-F, Van der Poll T. Soluble ST2 plasma concentrations predict mortality in severe sepsis. Intensive Care Med. 2010 Apr;36(4):630–637. doi: 10.1007/s00134-010-1773-0. PMID: 20151106. [DOI] [PMC free article] [PubMed] [Google Scholar]
- 14.Weinberg EO, Shimpo M, De Keulenaer GW, MacGillivray C, Tominaga S, Solomon SD, et al. Expression and regulation of ST2, an interleukin-1 receptor family member, in cardiomyocytes and myocardial infarction. Circulation. 2002 Dec 3;106(23):2961–2966. doi: 10.1161/01.CIR.0000038705.69871.D9. PMID: 12460879. [DOI] [PMC free article] [PubMed] [Google Scholar]
- 15.Seki K, Sanada S, Kudinova AY, Steinhauser ML, Handa V, Gannon J, et al. Interleukin-33 prevents apoptosis and improves survival after experimental myocardial infarction through ST2 signaling. Circ Heart Fail. 2009 Nov;2(6):684–691. doi: 10.1161/CIRCHEARTFAILURE.109.873240. PMID: 19919994. [DOI] [PubMed] [Google Scholar]
- 16.Sabatine MS, Morrow DA, Higgins LJ, MacGillivray C, Guo W, Bode C, et al. Complementary roles for biomarkers of biomechanical strain ST2 and N-terminal prohormone B-type natriuretic peptide in patients with ST-elevation myocardial infarction. Circulation. 2008 Apr 15;117(15):1936–1944. doi: 10.1161/CIRCULATIONAHA.107.728022. PMID: 18378613. [DOI] [PMC free article] [PubMed] [Google Scholar]
- 17.Pascual-Figal DA, Manzano-Fernández S, Boronat M, Casas T, Garrido IP, Bonaque JC, et al. Soluble ST2, high-sensitivity troponin T- and N-terminal pro-B-type natriuretic peptide: complementary role for risk stratification in acutely decompensated heart failure. Eur. J. Heart Fail. 2011 Jul;13(7):718–725. doi: 10.1093/eurjhf/hfr047. PMID: 21551163. [DOI] [PubMed] [Google Scholar]
- 18.Wiedemann HP, Wheeler AP, Bernard GR, Thompson BT, Hayden D, deBoisblanc B, et al. Comparison of two fluid-management strategies in acute lung injury. N. Engl. J. Med. 2006 Jun 15;354(24):2564–2575. doi: 10.1056/NEJMoa062200. PMID: 16714767. [DOI] [PubMed] [Google Scholar]
- 19.Januzzi JL, Jr, Camargo CA, Anwaruddin S, Baggish AL, Chen AA, Krauser DG, et al. The N-terminal Pro-BNP investigation of dyspnea in the emergency department (PRIDE) study. Am. J. Cardiol. 2005 Apr 15;95(8):948–954. doi: 10.1016/j.amjcard.2004.12.032. PMID: 15820160. [DOI] [PubMed] [Google Scholar]
- 20.The ARDS Definition Task Force. Acute Respiratory Distress Syndrome The Berlin Definition. JAMA: The Journal of the American Medical Association. 2012 May 21;307(23):2526–2533. doi: 10.1001/jama.2012.5669. [DOI] [PubMed] [Google Scholar]
- 21.Knaus WA, Wagner DP, Draper EA, Zimmerman JE, Bergner M, Bastos PG, et al. The APACHE III prognostic system. Risk prediction of hospital mortality for critically ill hospitalized adults. Chest. 1991 Dec;100(6):1619–1636. doi: 10.1378/chest.100.6.1619. PMID: 1959406. [DOI] [PubMed] [Google Scholar]
- 22.Mehta RL, Kellum JA, Shah SV, Molitoris BA, Ronco C, Warnock DG, et al. Acute Kidney Injury Network: report of an initiative to improve outcomes in acute kidney injury. Crit Care. 2007;11(2):R31. doi: 10.1186/cc5713. PMID: 17331245. [DOI] [PMC free article] [PubMed] [Google Scholar]
- 23.Dieplinger B, Januzzi JL, Jr, Steinmair M, Gabriel C, Poelz W, Haltmayer M, et al. Analytical and clinical evaluation of a novel high-sensitivity assay for measurement of soluble ST2 in human plasma--the Presage ST2 assay. Clin. Chim. Acta. 2009 Nov;409(1–2):33–40. doi: 10.1016/j.cca.2009.08.010. PMID: 19699192. [DOI] [PubMed] [Google Scholar]
- 24.Youden W. Index for rating diagnostic tests. Cancer. 1950 Jan;3(1):32–35. doi: 10.1002/1097-0142(1950)3:1<32::aid-cncr2820030106>3.0.co;2-3. PMID: 15405679. [DOI] [PubMed] [Google Scholar]
- 25.Liu KD, Thompson BT, Ancukiewicz M, Steingrub JS, Douglas IS, Matthay MA, et al. Acute kidney injury in patients with acute lung injury: impact of fluid accumulation on classification of acute kidney injury and associated outcomes. Crit. Care Med. 2011 Dec;39(12):2665–2671. doi: 10.1097/CCM.0b013e318228234b. PMID: 21785346. [DOI] [PMC free article] [PubMed] [Google Scholar]
- 26.Grams ME, Estrella MM, Coresh J, Brower RG, Liu KD. Fluid balance, diuretic use, and mortality in acute kidney injury. Clin J Am Soc Nephrol. 2011 May;6(5):966–973. doi: 10.2215/CJN.08781010. PMID: 21393482. [DOI] [PMC free article] [PubMed] [Google Scholar]
- 27.Vlaar APJ, Honselaar WB, Binnekade JM, Groeneveld AB, Spronk PE, Schultz MJ, et al. Diagnosing acute lung injury in the critically ill: a national survey among critical care physicians. Acta Anaesthesiol Scand. 2009 Nov;53(10):1293–1299. doi: 10.1111/j.1399-6576.2009.02102.x. PMID: 19719815. [DOI] [PubMed] [Google Scholar]
- 28.Schütte H, Lohmeyer J, Rosseau S, Ziegler S, Siebert C, Kielisch H, et al. Bronchoalveolar and systemic cytokine profiles in patients with ARDS, severe pneumonia and cardiogenic pulmonary oedema. Eur. Respir. J. 1996 Sep;9(9):1858–1867. doi: 10.1183/09031936.96.09091858. PMID: 8880103. [DOI] [PubMed] [Google Scholar]
- 29.Rehman SU, Mueller T, Januzzi JL., Jr Characteristics of the novel interleukin family biomarker ST2 in patients with acute heart failure. J. Am. Coll. Cardiol. 2008 Oct 28;52(18):1458–1465. doi: 10.1016/j.jacc.2008.07.042. PMID: 19017513. [DOI] [PubMed] [Google Scholar]
- 30.Ky B, French B, McCloskey K, Rame JE, McIntosh E, Shahi P, et al. High-sensitivity ST2 for prediction of adverse outcomes in chronic heart failure. Circ Heart Fail. 2011 Mar;4(2):180–187. doi: 10.1161/CIRCHEARTFAILURE.110.958223. PMID: 21178018. [DOI] [PMC free article] [PubMed] [Google Scholar]
- 31.Bajwa EK, Januzzi JL, Gong MN, Thompson BT, Christiani DC. Prognostic value of plasma N-terminal probrain natriuretic peptide levels in the acute respiratory distress syndrome. Crit. Care Med. 2008 Aug;36(8):2322–2327. doi: 10.1097/CCM.0b013e318181040d. PMID: 18596623. [DOI] [PMC free article] [PubMed] [Google Scholar]
- 32.Tajima S, Bando M, Ohno S, Sugiyama Y, Oshikawa K, Tominaga S, et al. ST2 gene induced by type 2 helper T cell (Th2) and proinflammatory cytokine stimuli may modulate lung injury and fibrosis. Exp. Lung Res. 2007 Mar;33(2):81–97. doi: 10.1080/01902140701198583. PMID: 17454104. [DOI] [PubMed] [Google Scholar]
- 33.Van Kimmenade RRJ, Januzzi JL., Jr Emerging biomarkers in heart failure. Clin. Chem. 2012 Jan;58(1):127–138. doi: 10.1373/clinchem.2011.165720. PMID: 22086968. [DOI] [PubMed] [Google Scholar]
- 34.Chadda K, Annane D, Hart N, Gajdos P, Raphaël JC, Lofaso F. Cardiac and respiratory effects of continuous positive airway pressure and noninvasive ventilation in acute cardiac pulmonary edema. Crit. Care Med. 2002 Nov;30(11):2457–2461. doi: 10.1097/00003246-200211000-00009. PMID: 12441754. [DOI] [PubMed] [Google Scholar]
Associated Data
This section collects any data citations, data availability statements, or supplementary materials included in this article.