

Abstract
Objectives
In multiple sclerosis (MS), accurate, in vivo characterization of dynamic inflammatory pathological changes occurring in newly forming lesions could have major implications for understanding disease pathogenesis and mechanisms of tissue destruction. Here, we investigated the potential of ultrahigh-field MRI (7T), particularly phase imaging combined with dynamic contrast enhancement, to provide new insights in acute MS lesions.
Methods
Sixteen active MS patients were studied at 7T. Noncontrast, high-resolution T2* magnitude and phase scans, T1 scans before/after gadolinium contrast injection, and dynamic contrast-enhanced (DCE) T1 scans were acquired. T2*/phase features and DCE pattern were determined for acute and chronic lesions. When possible, one-year follow-up 7T MRI was performed.
Results
Of 49 contrast-enhancing lesions, 44 could be analyzed. Centrifugal DCE lesions appeared isointense or hypointense on phase images, whereas centripetal DCE lesions showed thin, hypointense phase rims that clearly colocalized with the initial site of contrast enhancement. This pattern generally disappeared once enhancement resolved. On the other hand, in 43 chronic lesions also selected for the presence of hypointense phase rims, the findings were stable over time, and the rims were typically thicker and darker. These considerations suggest different underlying pathological processes in the two lesion types.
Interpretation
Ultrahigh-field MRI and, especially, phase contrast, are highly sensitive to tissue changes in acute MS lesions, which differ from the patterns seen in chronic lesions. In acute lesions, the hypointense phase rim reflects the expanding inflammatory edge and may directly correspond to inflammatory byproducts and sequelae of blood-brain barrier opening.
Keywords: inflammatory process, 7T phase imaging, multiple sclerosis
Introduction
Multiple sclerosis (MS) is a chronic inflammatory demyelinating and neurodegenera-tive disorder of the central nervous system (CNS). The primary cause remains unknown, but a dysregulation of the immune system directed against myelin antigens probably plays a crucial role in the pathogenesis. Historically, lesion onset has been attributed to activation of T lymphocytes in small perivascular cuffs and migration of blood-derived inflammatory cells through a compromised blood-brain barrier (BBB).1–5 Over hours to days, this process leads to direct or indirect damage to oligodendrocytes and axons by activated microglia, infiltrating macrophages, and related inflammatory mediators including cytokines and chemokines, as well as nitric oxide and other reactive oxygen species.1–6 Recent studies also suggest that oligodendrocyte loss3, 4, 6 starts at the earliest stages of lesion formation and, importantly, that cortical pathology might be related to meningeal inflammation7–9 rather than local infiltration of inflammatory cells through an open BBB.
The specific pathological features that characterize lesion development and evolution change over time, and these changes, clearly demonstrated in the limited pathological samples that exist,1, 2, 4, 5 have correlates on MRI. MRI can be repeated frequently, and new technology allows high spatial resolution imaging with a variety of contrast mechanisms, raising the possibility that imaging data – after careful comparison to existing pathological reports –can be used to construct models of mechanisms underlying lesion development and evolution, including both destructive and protective aspects of the inflammation. In our previous work, we demonstrated that dynamic contrast-enhanced (DCE)-MRI characterizes the spatio-temporal dynamics of contrast enhancement within lesions, reflecting BBB opening. We demonstrated that the locus of initial BBB opening can change from central to peripheral vessels, and that whereas the earliest lesions enhance centrifugally, larger and older lesions enhance centripetally.10, 11 These findings are consistent with the notion – supported by pathology2, 12 – that MS lesions grow radially from a central vein.
Recently, susceptibility MRI, examining both the T2*-weighted magnitude (denoted hereafter as “T2*”) and phase of the MRI signal,13 has been used to detect features that may be more closely linked to important aspects of the pathology. This type of imaging can be readily applied at fine spatial resolution on high magnetic field strength scanners. Myelin,14–17 iron,18–20 deoxyhemoglobin,21 and free radicals22 – all relevant in MS pathogenesis – influence susceptibility and can thereby determine image contrast. Previous studies have shown heterogeneous patterns of T2*/phase contrast in chronic MS lesions,18–20, 23, 24 which appear to be especially influenced by the topography of iron-laden macrophages and ferritin within lesions.25
Here, we investigated the potential of ultrahigh-field (7 tesla, T) MRI to elucidate the relationship between T2*/phase patterns and contrast-enhancement (denoted hereafter as “enhancement”) dynamics in acute lesions, with the goal of assessing how specific T2*/phase-DCE patterns are associated with the architecture of developing inflammatory lesions. We hypothesized that phase images would be especially sensitive to the inflammatory and tissue changes within lesions.
Patients and Methods
Patients
From April 2011 to February 2013, we consecutively recruited 16 MS patients under an institutional review board-approved natural history protocol. Based on the identification of enhancing lesions in scheduled examinations at 3T, patients were invited to undergo 7T MRI, where we confirmed and studied the enhancement of acute lesions. Thirteen had relapsing-remitting, two secondary-progressive, and one primary-progressive MS. At the time of MRI, all were steroid-free for at least 30 days. Experienced MS clinicians determined disability according to the Expanded Disability Status Scale (EDSS)26 and obtained clinical data. Median EDSS score was 2 (range 0–6), and mean disease duration was 7.8 years (range 0.6–20) [Supplementary Table 1]. When possible, 7T MRI and clinical follow-up were reassessed at approximately one year (mean 1.3, standard deviation [SD] 0.3).
MRI acquisition
The 7T MRI protocol was as follows:
High-resolution gradient-echo (GRE) providing T2* and phase contrasts (voxel size 0.2×0.2×1 mm3) covered the lesion of interest before contrast injection.
During injection of intravenous gadobutrol (Gad) [0.1 mmol/kg over 1 min], 10 repetitions of a 3D T1-weighted DCE sequence (32 sec per repetition) covered the lesion of interest. This sequence was further repeated at variable time points over 25 min after contrast administration.
Whole-brain 3D T1-weighted magnetization-prepared rapid gradient echo (T1-MPRAGE) was acquired before and at variable time points after contrast injection.
A 3T MRI scan using 3D multishot echo-planar imaging (EPI) to provide T2*/phase contrasts was available in 7 patients, having been acquired for other reasons one week before the 7T study. Additional MRI methods are detailed in Supplementary Methods. A comparison between 3T and 7T phase imaging is shown in Supplementary Figure 1.
MRI analysis
An experienced neuroradiologist (DSR) read all the scans, and a neurologist with experience in MS imaging (MA) analyzed the data. Phase postprocessing and coregistration among images were performed; see Supplementary Materials for details. We recorded the number and frequency of the following high-resolution morphological features of enhancing lesions: (1) presence of the lesion on T2*/phase; (2) detection of a hypointense rim on T2*/phase; (3) presence of perilesional edema on T2*; and (4) detection of a single central vein and/or multiple veins crossing the lesion on phase images. Additionally, after interpolation to 100 μm isotropic, we measured the diameter and thickness of the hypointense rim when it was detected on phase images. For each rim lesion, we calculated the mean and SD across four radial measures of rim thickness, carefully avoiding regions where peripheral veins crossed the lesion’s edge (Figure 1A).
Figure 1.
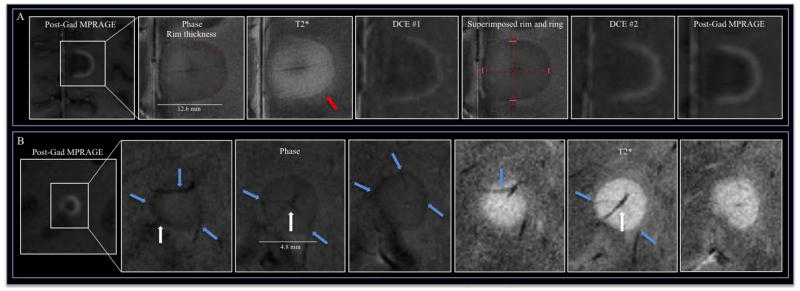
(A) 7T T2*/phase features and dynamic contrast enhancement (DCE) changes in a medial posterior frontal juxtacortical open-ring enhancing lesion in a 36-year-old woman with RRMS (EDSS 3, disease duration 3 years; patient #5). Over time, the leakage of contrast follows a centripetal pattern (DCE #1, DCE #2 and MPRAGE images acquired, respectively, approximately 1, 12, and 25 min after contrast injection). A hypointense rim is clearly visible on phase (the rim thickness is shown with red lines) and T2* images; perilesional edema, outside the rim, is evident only on T2* (red arrow). The fifth panel shows the superimposed phase rim (indicated by white lines) and initial locus of enhancement as detected on the DCE scans (delimited by red lines). (B) Relationship of small blood vessels to a centripetal lesion on phase and T2* images (three contiguous 1.0 mm slices) in a 48-year-old woman with SPMS (EDSS 5.5, disease duration 20 years, patient #7). The central vein (white arrow), which traverses the lesion and is best seen on the middle slice, drained into the cortex (not shown). Prominent peripheral veins (cyan arrows) pass through the lesion and are visualized on both phase and T2* images.
Finally, we determined the initial enhancement pattern (nodular, closed ring, or open ring) according to the appearance on the first DCE image in which the lesion was discerned. We then determined the dynamic enhancement pattern from 3D DCE images,10 or from registered sets of T1-MPRAGE images, as either centrifugal or centripetal. For ring-enhancing lesions, we also measured four radii from the lesion center to: (1) the inner and outer borders on the first DCE images with contrast enhancement; and (2) the hypointense phase rim. We evaluated the spatial colocalization of the phase rim with the lesion border on DCE by measuring the mean and SD of the distance between the rim and both inner and outer DCE borders (Figure 1A).
For chronic lesions, we selected all nonenhancing lesions in which a hypointense rim was detected on phase images. Similarly to acute MS lesions, we reported their main morphological features and quantified rim thickness.
Statistical analysis
The statistical analysis controlled for potential within-subject correlations and is described in detail in the Supplementary Materials.
Results
On post-contrast 7T T1-MPRAGE, we detected 49 enhancing lesions. Five were too small to characterize fully (diameters: 0.7, 1.2, 1.4, 1.4 and 1.0 mm) and were therefore excluded from further analysis. The mean number of enhancing lesions per patient was 3.1 (median: 2; range: 1–13).
Phase and dynamic enhancement in acute lesions
Across enhancing lesions, 13 had a centripetal DCE pattern (enhancement appeared first as a ring and progressively filled the lesion), 14 had a centrifugal pattern (enhancement expanded radially from the center), and 17 were not captured on the DCE acquisition. We detected a central vein in 86% of lesions, as well as prominent peripheral veins crossing the lesion in many cases (Figure 1B). Perilesional edema, visible on T2*, was more frequent in centripetal than in centrifugal lesions (62% and 18%, respectively; p=0.047).
Most acute lesions were visible on both phase (95%) and T2* (95%). There was a hypointense rim on phase (52% of all lesions: 94% of centripetal and 29% of centrifugal lesions; p=0.034 for comparison between centripetal and centrifugal) and, more rarely, on T2* (14% of all lesions: 31% of centripetal and 3% of centrifugal lesions; p=0.038) (Figure 2). The incidence of the rim was higher on phase than on T2* (p=0.045). The phase rim’s mean thickness was 314 μm (SD=131 μm) (see Table 1 for details).
Figure 2.

7T T2*/phase features and contrast enhancement dynamics in centripetal (A, B) and centrifugal (C) enhancing lesions. The hypointense phase rim is clearly visible in A (Supplementary Video 1) and B, but whereas it is clearly seen on T2* in A, it is virtually invisible on T2* in B. In (C), a centrifugal lesion (Supplementary Video 4) is subtly but homogeneously hypointense on phase. The area of phase hypointensity, delimited by cyan dashes, is smaller than the area of T2* hyperintensity (indicated by white dashes). In (E), stable phase and T2* features, including a thick rim, in a chronic lesion at baseline and 1.3 years later.
Table 1.
Morphological features and quantitative assessment of MS lesions at 7T.
| All acute (Gad-enhancing) lesions | Chronic (non- enhancing) lesions with phase rims | ||
|---|---|---|---|
| Centripetal DCE pattern | Centrifugal DCE pattern | ||
| # Lesions analyzed | 16 | 28 | 43 |
| Visible on phase | 16 (100%) | 26 (93%) | 43 (100%) |
| Visible on T2* | 16 (100%) | 26 (93%) | 42 (98%) |
| Hypointense rim on phase | 15 (94%) | 8 (29%) | 43 (100%) |
| Hypointense rim on T2* | 5 (31%) | 1 (3%) | 28 (65%) |
| Perilesional edema on T2* | 10 (62%) | 5 (18%) | 0 (0%) |
| Vasculature | |||
| Clear central vein | 12 (75%) | 26 (93%) | 30 (77%) |
| Conspicuous peripheral veins | 15 (94%) | 14 (50%) | 31 (79%) |
| crossing the lesion edge | |||
| Relationship with contrast enhancement | |||
| Final contrast enhancement pattern | 6 ring 6 open ring 4 nodular |
28 nodular | NA |
| Lesion measurements | |||
| Mean diameter of lesions (SD) [mm] | 7.9 (4.2) | 3.2 (1.3) | 5.4 (2.9) |
| Mean thickness of hypointense rim on phase images, if present (SD) [μm] | 342 (146) | 262 (80) | 428 (244) |
Abbreviations: NA=not applicable; SD=standard deviation.
In centripetal lesions, the phase rim clearly colocalized with the initial locus of BBB opening as judged by DCE (Figure 1A, 2A–B, Supplementary Videos 1 and 2). In particular, the phase rim was within the enhancing rim, a mean distance of 496 μm (SD=347 μm) from the inner border of the earliest DCE enhancement and 518 μm (SD=337 μm) from the outer border (p=0.89) (Figure 1A).
Different degrees of phase intensity were detectable within acute MS lesions, ranging from isointense to mildly hypointense relative to surrounding white matter (Figure 2C).
Table 1 presents the main qualitative morphological T2*/phase features of acute lesions as well as quantitative assessment of enhancing lesions classified according to their initial enhancement pattern.
Evolution of enhancing lesions
Four patients were rescanned at one year, allowing us to assess morphological changes in 9 of the 44 acute MS lesions we studied. The results, presented in Table 2 and illustrated in Figure 3, show clearly that T2*/phase patterns change drastically as acute lesions evolve.
Figure 3.

7T T2*/phase features at baseline and approximately one year later in 6 MS lesions, which are identified and detailed further in Table 2. Cyan arrows indicate the lesion of interest. At follow up, the appearance of a new lesion adjacent to the lesion of interest is shown with purple arrows (lesions #4, #5 and #6). Lesion #9 was not visible on baseline T2* and entirely disappeared at follow-up (cyan circles).
Comparison with chronic MS lesions with hypointense phase rims
From the same sample of MS patients, we detected 459 discrete supratentorial white matter (WM) nonenhancing (presumably chronic) lesions on T2* images (mean 29 lesions per patient, SD 19). We selected for detailed analysis the 43 nonenhancing lesions (mean 3 lesions per patient, SD 4) that had hypointense phase rims, representing 9% of all chronic lesions (Figure 2D). For chronic lesions, we recorded only the main qualitative and quantitative baseline data in Table 1, since no differences were detected between baseline and follow-up scans, and the stability of these lesions over time has already been described.27 In comparison to acute enhancing lesions with phase rims, chronic nonenhancing lesions showed thicker rims (p<0.001) and larger lesion diameters (p<0.001). Rim thickness was proportional to lesion diameter only in chronic lesions (β=43 μm/mm, p<0.0001). Of lesions with phase rims, chronic lesions were more likely to demonstrate a hypointense T2* rim (65% of chronic vs. 14% of acute, p=0.01) (Figure 2D).
Discussion
In this 7T MRI study, we analyzed the morphology and architecture of acute, Gad-enhancing lesions in MS by means of T2*/phase and DCE imaging. The extremely frequent detection of a thin hypointense rim on phase images in acute MS lesions (94% of centripetal lesions and 29% of centrifugal lesions) has not previously been reported, and the colocalization of this rim with the initial site of contrast enhancement suggests that it may be an endogenous marker of BBB opening. From a technical point of view, the high spatial resolution (nominal in-plane voxel size: 200×200 μm) enabled by acquisition at 7T, together with robust postprocessing of phase images, makes it possible to see more deeply into the structural architecture of MS lesion development in vivo than was previously possible. Considering that the acute phase rim is thin (~300 μm), and that at lower field strengths susceptibility effects are diminished and image resolution is rarely finer than 0.5 mm3, it is not surprising that this finding has not been consistently described.28
The near perfect colocalization between the phase rim and BBB opening in centripetal lesions suggests that, in newly forming lesions, this rim corresponds to the expanding inflammatory lesion edge. The substrate of phase rim hypointensity might be related to paramagnetic components in the mixture of soluble factors, serum proteins, antibodies,1, 2, 4 and reactive oxygen species (including nitric oxide intermediates and oxidized phospholipids),29 as well as the outward demyelination process.1, 2, 4 In the absence of histological data for direct comparison with MRI, it is impossible to say which factors most strongly influence the local magnetic susceptibility that determines the signal phase. An additional potential biological source of the phase shift is deoxyhemoglobin,21 which may arise from vasodilatation or venous stasis and lead to improved conspicuity of peripheral veins crossing the lesion edge (Figure 1B). However, as the rim forms a 3D surface, it is unlikely that it is primarily determined by vasodilatation, which would be expected to generate predominantly linear structures – and focal capillary dilatation at the lesion edge is possible, but seems unlikely.
Our pathological interpretation of the phase rim is supported, first, by the reported detection of a hypointense rim on T2 images in 30–45% of tumefactive MS lesions with ring-enhancement,30, 31 and, second, by comparison with reported susceptibility properties of the capsule of pyogenic brain abscesses22 and of the outer edge of glioblastomas.32 In these conditions, the phase rim also colocalized with peripheral enhancement, more strongly for abscesses than glioblastomas, where the rim is often irregular and incomplete. In abscesses, the phase rim is thought to derive from the production of paramagnetic free radicals22 by phagocytic macrophages located peripherally; in glioblastomas, it is more likely due to deposition of hemorrhagic byproducts at the edge of the necrotic cavity.32 From an MRI susceptibility perspective, the MS lesion edge appears to be more similar to an abscess capsule, suggesting that the phase rim in MS may denote the immunological response to lesion formation rather than active tissue destruction per se.
The finding that 29% of centrifugal lesions showed a thin hypointense phase rim, even though enhancement proceeded from the center of these lesions, appears at first to contradict our claim that the phase rim is a direct endogenous marker of BBB opening. Indeed, some of the biological processes that might cause such a rim, as described above, do not require or may precede BBB opening. However, we think it is more likely that centrifugal lesions with phase rims represent intermediate steps in the process of lesion evolution, a transitional point between earlier, smaller, purely centrifugal lesions and later, larger, centripetal lesions. Indeed, it is likely that the shift from centrally to peripherally focused inflammation, which involves closing of the central vein’s BBB and opening of the BBB in peripheral vessels, and which may comprise very different immune mechanisms, occurs over a short period of time. This makes it hard to discriminate this intermediate stage of lesion development with DCE imaging, even at 7T, a situation that is complicated further by the small size of these lesions (see, for example, Supplementary Video 3). These considerations suggest that a study of new lesion evolution with high frequency imaging (daily or every other day) would be highly informative.
Beyond the phase rim, we detected different degrees of phase contrast within acute MS lesions, ranging from isointense to mildly hypointense relative to surrounding WM. In larger lesions, we sometimes detected heterogeneous internal phase signal (Figure 2C). In centrifugal lesions, the different degrees of phase hypointensity may correspond to different stages of myelin breakdown and phagocytosis and to different concentrations of reactive oxygen species, both mediated by the presence of macrophages (located around the central vein).1, 2, 4 A recent study suggested, based on theory and simulations, that if both myelin and axons are damaged within the same voxel, the phase contrast signal might pseudonormalize, since myelin and neurofilaments have opposing magnetic susceptibilities.17
Unlike in chronic lesions,18–20, 23, 24, 27 we do not believe that iron is the principal source of phase contrast in the rim of acute lesions, since macrophages in earlier stages of lesion development are not reported to be iron-enriched, but rather myelin debris-enriched.3 Indeed, a recent study25 highlighted with immunohistochemical examination and in vitro assays the dichotomy between non-phagocytosing, pro-inflammatory, M1-polarized, iron-positive macrophages, which are mainly located at the edge of chronic active lesions, and the myelin-scavenging, anti-inflammatory, M2-polarized, iron-negative macrophages in actively demye-linating lesions. We therefore hypothesized that the morphological features of the phase rim in acute lesions would differ from those in chronic lesions. In support of this hypothesis, we found that the phase rim in our sample of chronic lesions was thicker than in acute lesions; that rim thickness was correlated with lesion diameter only in chronic lesions; and that the rim was more frequently present on T2* images in chronic lesions (65% of such lesions) than in acute lesions (14%). This final consideration suggests a stronger negative susceptibility shift in chronic lesions, compatible with the presence at the edge of iron-enriched macrophages or ferritin.18, 19, 24, 25 Although the role of these iron-enriched macrophages remains unclear, one possibility, based on the dichotomy described above,25 is that they constitute a barrier to remyelination.
Finally, and most importantly, the assessment of the evolution of acute MS lesions showed completely different phase patterns at one-year follow-up, whereas chronic lesions, as has been reported,27 remained stable. This is consistent with the idea that acute phase patterns are related to the inflammatory processes of lesion formation, which change substantially on this time scale, whereas the final patterns are related to differential aspects of lesion repair or ongoing, chronic inflammation. These results raise the possibility that imaging techniques could provide insight into the factors that determine the fate of individual acute lesions.
The primary limitation of this study is the relatively small sample size, which limits generalizability – although results were generally consistent across patients. Another limitation is that some of our findings might have been affected by the high sensitivity of phase imaging to white matter fiber orientation.33 Interestingly, three lesions that lacked phase rims (two nodular and one ring-like) were located in the corpus callosum, contiguous to the ventricular wall, which suggests a possible interference in phase rim detection due to highly ordered, anisotropic myelin sheaths in the corpus callosum. A third limitation is that despite high-resolution data acquisition for both DCE and T2*/phase, the smallest lesions (diameter <1.5 mm) remained difficult to analyze.
In conclusion, T2* imaging, especially with respect to signal phase, is highly sensitive to tissue changes in acute MS lesions, and the observed patterns differ from those seen in chronic lesions. Thin, hypointense phase rims in acute lesions reflect the expanding inflammatory edge, a finding that is clearly demonstrated in centripetally enhancing lesions, and may be an endogenous marker of BBB opening. Coupling phase and enhancement data provides insights into the in vivo development and evolution of MS lesions, allowing a more complete characterization of the stages of lesion development.
Supplementary Material
Table 2.
Main morphological and susceptibility changes in 9 MS lesions at baseline and after approximately one-year follow up (see also Figure 3).
| Patient* | Lesion& | Localization | Contrast enhancement | Time point | Lesion dimension (mm) | Susceptibility features | Phase rim thickness (μm) |
|---|---|---|---|---|---|---|---|
| #4 | #1 | R parietal WM | Ring; Centripetal | Baseline | 3.7 | Hypointense rim on phase and T2*; edema on T2* outside the rim | 303 |
| FU | 3.0 | Lesion hypointense on phase and T2*; no visible rim | NA | ||||
| #2 | R frontal periventricular WM | Nodular; Missed on DCE | Baseline | 3.3 | Patchy hypointense lesion on phase; hyperintense on T2* | NA | |
| FU | 4.4 | Strong hypointense rim on phase and T2* (suggesting iron deposition) | 1135 | ||||
| #3 | R periventricular WM | Open ring; Missed on DCE | Baseline | 12.4 | Hypointense rim on phase and T2* | 742 | |
| FU | 11.4 | Rim thicker and darker on both phase and T2* (suggesting iron deposition) | 1135 | ||||
| #5 | #4 | L posterior periventricular WM | Nodular; Missed on DCE | Baseline | 3.0 | Thin hypointense phase rim | 156 |
| FU | NA | No longer visible as a discrete lesion – completely consumed by a newly appearing confluent periventricular lesion | NA | ||||
| #5 | L medial posterior frontal JC | Open ring; Centripetal | Baseline | 11.8 | Hypointense rim on phase and T2*; edema on T2* outside the rim | 392 | |
| FU | 8.2 | Rim thicker and darker (suggesting iron deposition); overlapping with a new lesion | 1000 | ||||
| #7 | #6 | L parietal WM | Ring; Centripetal | Baseline | 11.0 | Hypointense rim on phase and T2*; edema on T2* outside the rim | 241 |
| FU | 6.1 | Hypointense lesions on phase; overlapping with a new lesion | NA | ||||
| #8 | #7 | R frontal WM | Nodular; Centrifugal | Baseline | 1.8 | Hypointense rim on phase; lesion not visible on T2* | 166 |
| FU | 1.7 | Lesion hypointense on phase; lesion not clearly visible on T2* | NA | ||||
| #8 | L frontal WM | Nodular; Centrifugal | Baseline | 1.9 | Lesion hypointense on phase, not visible on T2* | NA | |
| FU | 2.3 | Stable | NA | ||||
| #9 | R frontal WM | Nodular; Missed on DCE | Baseline | 2.1 | Hypointense phase rim; lesion not visible on T2* | 243 | |
| FU | NA | Lesion not visible on phase and T2* | NA |
Abbreviations: R=right; L=left; WM=white matter; FU=follow up; NA=not applicable; DCE=dynamic contrast-enhanced scan;
JC=juxtacortical.
Patient numbers correspond to those in Supplementary Table 1.
Lesion numbers correspond to those in Figure 3.
Acknowledgments
The Intramural Research Program of NINDS supported this study. We thank the patients, the NIH Functional Magnetic Resonance Imaging Facility, and the Neuroimmunology Branch clinical group for recruiting and evaluating the patients and for coordinating the scans. We also thank Govind Nair for assistance with 3T data acquisition and Tianxia Wu for the statistical analysis.
References
- 1.Barnett MH, Prineas JW. Relapsing and remitting multiple sclerosis: pathology of the newly forming lesion. Ann Neurol. 2004;55:458–468. doi: 10.1002/ana.20016. [DOI] [PubMed] [Google Scholar]
- 2.Henderson AP, Barnett MH, Parratt JD, Prineas JW. Multiple sclerosis: distribution of inflammatory cells in newly forming lesions. Ann Neurol. 2009;66:739–753. doi: 10.1002/ana.21800. [DOI] [PubMed] [Google Scholar]
- 3.Hu W, Lucchinetti CF. The pathological spectrum of CNS inflammatory demyelinating diseases. Seminars in immunopathology. 2009;31:439–453. doi: 10.1007/s00281-009-0178-z. [DOI] [PubMed] [Google Scholar]
- 4.Prineas JW, Parratt JD. Oligodendrocytes and the early multiple sclerosis lesion. Ann Neurol. 2012;72:18–31. doi: 10.1002/ana.23634. [DOI] [PubMed] [Google Scholar]
- 5.Popescu BF, Lucchinetti CF. Pathology of demyelinating diseases. Annual review of pathology. 2012;7:185–217. doi: 10.1146/annurev-pathol-011811-132443. [DOI] [PubMed] [Google Scholar]
- 6.Lucchinetti C, Bruck W, Parisi J, et al. Heterogeneity of multiple sclerosis lesions: implications for the pathogenesis of demyelination. Ann Neurol. 2000;47:707–717. doi: 10.1002/1531-8249(200006)47:6<707::aid-ana3>3.0.co;2-q. [DOI] [PubMed] [Google Scholar]
- 7.Lucchinetti CF, Popescu BF, Bunyan RF, et al. Inflammatory cortical demyelination in early multiple sclerosis. N Engl J Med. 2011;365:2188–2197. doi: 10.1056/NEJMoa1100648. [DOI] [PMC free article] [PubMed] [Google Scholar]
- 8.Popescu BF, Bunyan RF, Parisi JE, et al. A case of multiple sclerosis presenting with inflammatory cortical demyelination. Neurology. 2011;76:1705–1710. doi: 10.1212/WNL.0b013e31821a44f1. [DOI] [PMC free article] [PubMed] [Google Scholar]
- 9.Popescu BF, Lucchinetti CF. Meningeal and cortical grey matter pathology in multiple sclerosis. BMC neurology. 2012;12:11. doi: 10.1186/1471-2377-12-11. [DOI] [PMC free article] [PubMed] [Google Scholar]
- 10.Gaitan MI, Shea CD, Evangelou IE, et al. Evolution of the blood-brain barrier in newly forming multiple sclerosis lesions. Ann Neurol. 2011;70:22–29. doi: 10.1002/ana.22472. [DOI] [PMC free article] [PubMed] [Google Scholar]
- 11.Gaitán MI, Sati P, Inati S, Reich DS. Initial investigation of the blood-brain barrier in MS lesions at 7 tesla. Multiple Sclerosis. 2012 doi: 10.1177/1352458512471093. (Dec 17 Epub) [DOI] [PMC free article] [PubMed] [Google Scholar]
- 12.Katz D, Taubenberger JK, Cannella B, et al. Correlation between magnetic resonance imaging findings and lesion development in chronic, active multiple sclerosis. Ann Neurol. 1993;34:661–669. doi: 10.1002/ana.410340507. [DOI] [PubMed] [Google Scholar]
- 13.Chavhan GB, Babyn PS, Thomas B, et al. Principles, techniques, and applications of T2*-based MR imaging and its special applications. Radiographics: a review publication of the Radiological Society of North America, Inc. 2009;29:1433–1449. doi: 10.1148/rg.295095034. [DOI] [PMC free article] [PubMed] [Google Scholar]
- 14.He X, Yablonskiy DA. Biophysical mechanisms of phase contrast in gradient echo MRI. Proceedings of the National Academy of Sciences of the United States of America. 2009;106:13558–13563. doi: 10.1073/pnas.0904899106. [DOI] [PMC free article] [PubMed] [Google Scholar]
- 15.Liu C, Li W, Johnson GA, Wu B. High-field (9. 4 T) MRI of brain dysmyelination by quantitative mapping of magnetic susceptibility. Neuroimage. 2011;56:930–938. doi: 10.1016/j.neuroimage.2011.02.024. [DOI] [PMC free article] [PubMed] [Google Scholar]
- 16.Li W, Wu B, Avram AV, Liu C. Magnetic susceptibility anisotropy of human brain in vivo and its molecular underpinnings. Neuroimage. 2012;59:2088–2097. doi: 10.1016/j.neuroimage.2011.10.038. [DOI] [PMC free article] [PubMed] [Google Scholar]
- 17.Yablonskiy DA, Luo J, Sukstanskii AL, et al. Biophysical mechanisms of MRI signal frequency contrast in multiple sclerosis. Proceedings of the National Academy of Sciences of the United States of America. 2012;109:14212–14217. doi: 10.1073/pnas.1206037109. [DOI] [PMC free article] [PubMed] [Google Scholar]
- 18.Bagnato F, Hametner S, Yao B, et al. Tracking iron in multiple sclerosis: a combined imaging and histopathological study at 7 Tesla. Brain. 2011;134:3602–3615. doi: 10.1093/brain/awr278. [DOI] [PMC free article] [PubMed] [Google Scholar]
- 19.Yao B, Bagnato F, Matsuura E, et al. Chronic multiple sclerosis lesions: characterization with high-field-strength MR imaging. Radiology. 2012;262:206–215. doi: 10.1148/radiol.11110601. [DOI] [PMC free article] [PubMed] [Google Scholar]
- 20.Hagemeier J, Heininen-Brown M, Poloni GU, et al. Iron deposition in multiple sclerosis lesions measured by susceptibility-weighted imaging filtered phase: a case control study. J Magn Reson Imaging. 2012;36:73–83. doi: 10.1002/jmri.23603. [DOI] [PubMed] [Google Scholar]
- 21.Yablonskiy DA. Quantitation of intrinsic magnetic susceptibility-related effects in a tissue matrix. Phantom study Magn Reson Med. 1998;39:417–428. doi: 10.1002/mrm.1910390312. [DOI] [PubMed] [Google Scholar]
- 22.Lai PH, Chang HC, Chuang TC, et al. Susceptibility-weighted imaging in patients with pyogenic brain abscesses at 1. 5T: characteristics of the abscess capsule. AJNR Am J Neuroradiol. 2012;33:910–914. doi: 10.3174/ajnr.A2866. [DOI] [PMC free article] [PubMed] [Google Scholar]
- 23.Hammond KE, Metcalf M, Carvajal L, et al. Quantitative in vivo magnetic resonance imaging of multiple sclerosis at 7 Tesla with sensitivity to iron. Ann Neurol. 2008;64:707–713. doi: 10.1002/ana.21582. [DOI] [PubMed] [Google Scholar]
- 24.Pitt D, Boster A, Pei W, et al. Imaging cortical lesions in multiple sclerosis with ultra- high-field magnetic resonance imaging. Arch Neurol. 2010;67:812–818. doi: 10.1001/archneurol.2010.148. [DOI] [PubMed] [Google Scholar]
- 25.Mehta V, Pei W, Yang G, et al. Iron is a sensitive biomarker for inflammation in multiple sclerosis lesions. PloS ONE. 2013;8(3):e57573. doi: 10.1371/journal.pone.0057573. [DOI] [PMC free article] [PubMed] [Google Scholar]
- 26.Kurtzke JF. Rating neurologic impairment in multiple sclerosis: an expanded disability status scale (EDSS) Neurology. 1983;33:1444–1452. doi: 10.1212/wnl.33.11.1444. [DOI] [PubMed] [Google Scholar]
- 27.Bian W, Harter K, Hammond-Rosenbluth KE, et al. A serial in vivo 7T magnetic resonance phase imaging study of white matter lesions in multiple sclerosis. Mult Scler. 2012 doi: 10.1177/1352458512447870. [DOI] [PubMed] [Google Scholar]
- 28.Suzuki M, Kudo K, Sasaki M, et al. Detection of active plaques in multiple sclerosis using susceptibility-weighted imaging: comparison with gadolinium-enhanced MR imaging. Magnetic resonance in medical sciences: MRMS: an official journal of Japan Society of Magnetic Resonance in Medicine. 2011;10:185–192. doi: 10.2463/mrms.10.185. [DOI] [PubMed] [Google Scholar]
- 29.Haider L, Fischer MT, Frischer JM, et al. Oxidative damage in multiple sclerosis lesions. Brain. 2011;134:1914–1924. doi: 10.1093/brain/awr128. [DOI] [PMC free article] [PubMed] [Google Scholar]
- 30.Lucchinetti CF, Gavrilova RH, Metz I, et al. Clinical and radiographic spectrum of pathologically confirmed tumefactive multiple sclerosis. Brain. 2008;131:1759–1775. doi: 10.1093/brain/awn098. [DOI] [PMC free article] [PubMed] [Google Scholar]
- 31.Llufriu S, Pujol T, Blanco Y, et al. T2 hypointense rims and ring-enhancing lesions in MS. Mult Scler. 2010;16:1317–1325. doi: 10.1177/1352458510377905. [DOI] [PubMed] [Google Scholar]
- 32.Toh CH, Wei KC, Chang CN, et al. Differentiation of pyogenic brain abscesses from necrotic glioblastomas with use of susceptibility-weighted imaging. AJNR Am J Neuroradiol. 2012;33:1534–1538. doi: 10.3174/ajnr.A2986. [DOI] [PMC free article] [PubMed] [Google Scholar]
- 33.Sati P, Silva AC, van Gelderen P, et al. In vivo quantification of T2 anisotropy in white matter fibers in marmoset monkeys. Neuroimage. 2012;59:979–985. doi: 10.1016/j.neuroimage.2011.08.064. [DOI] [PMC free article] [PubMed] [Google Scholar]
Associated Data
This section collects any data citations, data availability statements, or supplementary materials included in this article.