Abstract
Background
Growing evidence shows that dietary factors can dramatically alter the gut microbiome in ways that contribute to metabolic disturbance and progression of obesity. In this regard, mesenteric adipose tissue has been implicated in mediating these processes through the elaboration of pro-inflammatory adipokines. In this study, we examined the relationship of these events by determining the effects of dietary fat content and source on gut microbiota, as well as the effects on adipokine profiles of mesenteric and peripheral adipocytes.
Methods
Adult male C57Bl/6 mice were fed milk fat-, lard-(SFA sources), or safflower oil (PUFA)- based high fat diets for four weeks. Body mass and food consumption were measured. Stool 16S rRNA was isolated and analyzed via T-RFLP as well as variable V3-4 sequence tags via next gen sequencing. Mesenteric and gonadal adipose samples were analyzed for both lipogenic and inflammatory mediators via qRT-PCR.
Results
High-fat feedings caused more weight gain with concomitant increases in caloric consumption relative to low-fat diets. Additionally, each of the high fat diets induced dramatic and specific 16S rRNA phylogenic profiles that were associated with different inflammatory and lipogenic mediator profile of mesenteric and gonadal fat depots.
Conclusions
Our findings support the notion that dietary fat composition can both reshape the gut microbiota as well as alter host adipose tissue inflammatory/lipogenic profiles. They also demonstrate the interdependency of dietary fat source, commensal gut microbiota, and inflammatory profile of mesenteric fat that can collectively impact the host metabolic state.
Background
Modern environmental factors have contributed significantly to the marked prevalence of obesity in our society today.1 Inexpensive readily available high-calorie foods have implicated diet as a key component in the development of obesity. Previous diet-induced animal models of obesity are associated with a strong presence of pro-inflammatory markers which may disrupt the balance of metabolic homeostasis;2-4 these and other data lend strong support to the notion that marked weight gain arises from chronic, low-grade systemic inflammation.
Major progress has been made in identifying specific nutritional components that can alter the inflammatory state of the host. Earlier studies have shown that feeding rats a lard- or soybean oil-based high-fat diet led to the development of obesity characterized by adipose tissue inflammation.5 Furthermore, lard- and olive oil-fed mice both exhibit increased levels of plasma insulin, leptin, and resistin signifying an elevated inflammatory state.6 Two additional elements that play a key role in diet-induced inflammation are the intake of omega-6 (n-6) and omega-3 (n-3) fatty acids. Although both fatty acids are essential to human health, their relative consumed amounts can considerably influence the host inflammatory state considerably. N-6 polyunsaturated fatty acids (PUFAs) have been shown to influence NF-kB activity, a transcription factor that plays a pivotal role in regulating the expression of inflammatory markers such as the interleukins, TNF-a, and MCP-1.7 Conversely, studies have shown that consumption of a diet rich in n-3 fatty acids, such as those found in fish, may confer potential health benefits.8, 9 Coinciding with the increase in chronic inflammatory diseases, the ratio of omega-6 to omega-3 fatty acid consumption has steadily risen.10 Previous studies have shown an association between a high omega-6 to omega-3 consumption ratio and elevated risk for inflammatory disease.11 Due to the excess production of arachidonic acid, a pro-inflammatory byproduct of omega-6 fatty acid metabolism, dietary guidelines suggest that the ratio of omega-6 to omega-3 fatty acid consumption should be 4:1 or less. However, the typical ratio consumed in Westernized populations is closer to 15:1 or greater, 11 lending further credence to the idea that dietary fatty acid balance is a critical component of proper nutritional health.
Much attention has focused on how the intestinal microbiota can affect host metabolism. Several studies have demonstrated that body shape can have a dramatic impact on gut microbial architecture12 which in turn can influence host metabolic function.13, 14 Dietary components can also considerably alter gut microbial architecture. Mice fed a high-fat diet rich in saturated fatty acids (SFA) tend to possess a high ratio of Firmicutes to Bacteroidetes, the two predominant phyla present in the gut.15 Other studies have shown that consumption of a high-fiber diet leads to significant shifts in the gut microbiome.16 Ultimately, these microbial alterations can dramatically impact the outcome of host inflammation. For instance, Cani et al. have reported that treatment of mice with antibiotics reduced metabolic endotoxemia and inflammation.2 Others have altered gut microbiota using a diet-induced obese rat model and have demonstrated a link between obesity, altered gut bacteria, and inflammation.17
It is well established that consumption of an obesogenic, high-fat diet can contribute to adipose tissue-mediated inflammation. However, the role of specific dietary fats in modulating these inflammatory signals has not been well characterized. Moreover, given the substantial influence of gut microbes on host metabolism, it is of great interest to determine how dietary manipulation of intestinal microbiota can affect inflammatory progression in specific tissues involved in the development of obesity, including mesenteric and gonadal adipose tissues.
Materials and Methods
Animals
All animals used in this study were of the C57Bl/6 strain, bred and housed under standard 12:12 light/dark conditions at the University of Chicago. Adult male mice at 7-10 weeks of age were fed isocaloric high-fat diets, where the dietary fat consisted of either milk-fat (TD.97222), lard (TD.110718), or safflower oil (PUFA, TD.97223). A subset of mice were fed a defined low-fat chow control diet based on the AIN-93M formulation (TD.00102). All diets were manufactured by Harlan-Teklad (Madison, WI) and provided ad libitum. The macronutrient distribution of the experimental diets is listed in Table 1. Animal body weights and food consumption were monitored periodically throughout the study. After four to five weeks of experimental diet feeding, mice were sacrificed via CO2 asphyxiation and the abdominal cavity immediately opened. Gonadal and mesenteric adipose tissues were quickly excised, minced, and stored in TRIzol for further RNA isolation and inflammatory analyses. Cecal contents and distal stool samples were collected and snap frozen at −80°C for intestinal microbiota analysis. All animal protocols and experiments were approved by the Institutional Animal Care and Use Committee (IACUC) at the University of Chicago.
Table 1.
Nutrient composition of low- and high-fat diets fed to male C57Bl/6 mice.
| Table 1. Study Diets |
Low-fat (AIN-93M) |
SFA (Milk-Fat) |
SFA (Lard Fat) |
PUFA (Safflower oil) |
|---|---|---|---|---|
|
Fat (% kcal)* Fat Composition (% total fat) - SFA - MUFA - PUFA Protein (% kcal) Carbohydrate (% kcal) Micronutrients/Fiber |
10
15 24 61 19 66 Identical |
37.5
58.5 26.5 15 16 47 Identical |
37.5
39 50 11 16 47 Identical |
37.5
9 17 74 16 47 Identical |
SFA: Saturated Fatty Acid; MUFA: Mono-unsaturated Fatty Acid; PUFA: Poly-unsaturated Fatty Acid.
RNA extraction, cDNA synthesis, and quantitative real-time PCR
Total RNA was isolated from gonadal and mesenteric adipose tissue depots using the RNeasy Lipid Tissue Mini Kit (Qiagen Inc., Valencia, CA, USA) according to manufacturer’s instructions. Mucosal scrapings were homogenized in TRIzol reagent (Ambion) and mixed with chloroform. After centrifugation (10,000 rpm for 15 min), the top aqueous phase was mixed with 100% isopropanol to precipitate RNA. Samples were centrifuged (10,000 rpm for 10 min) and pellets were washed (75% ethanol), dried, and reconstituted in nuclease-free water. RNA purity was validated through UV-Vis spectrophotometry using the Nanodrop Lite (Thermo Scientific, Wilmington, DE, USA). 1μg of total RNA was reverse-transcribed to complementary DNA (cDNA) using the Transcriptor First Strand cDNA Synthesis Kit (Roche, Indianapolis, IN, USA) according to manufacturer’s instructions. The relative quantitation of gene expression was performed using the LightCycler 480 Real-Time PCR System (Roche). Primers used were: MCP-1 (F: ccactcacctgctgctactcat, R: tggtgatcctcttgtagctctcc), CD192 (F: atccacggcatactatcaacatc, R: caaggctcaccatcatcgtag), Resistin (F: tcgtgggacattcgtgaaga, R: gcgggctgctgtccag), LPL (F: gggagtttggctccagagttt, R: tgtgtcttcaggggtccttag), GAPDH (F: ggcaaattcaacggcacagt, R: agatggtgatgggcttccc). Gene expression data are presented as 2− ΔCt (housekeeping gene – target gene).
Immunohistochemistry (IHC) / Histology
Whole gonadal adipose depots were excised and fixed in 4% formalin/PBS overnight. Five-micron sections were cut and mounted on charged glass slides, deparaffinized, and processed for either H&E or immunohistochemical analysis. The mean adipocyte area was calculated using the ImageJ software (National Institute of Health, Bathesda, MD, USA). For immunofluorescent macrophage staining, slides were hydrated and steamed in 10mM sodium citrate. Slides were then washed, blocked twice for endogenous peroxidase and proteins, and incubated overnight with Mac2 primary antibody (CL8942AP, Cedarlane Labs, Ontario, Canada) according to manufacturer’s instructions. An Alexa Fluor conjugated secondary antibody was applied and slides were counterstained with DAPI and visualized with a Leica DM2500 microscope (Leica Microsystems, Wetzlar, Germany) through a 20X lens objective using Image Pro-Plus software (Media Cybernetics, Silver Springs, MD, USA) for image capture. Fluorescent intensity was then quantified using ImageJ software.
DNA isolation
Mouse colonic and fecal samples were homogenized in 1 ml extraction buffer [50mM Tris (pH 7.4), 100mM EDTA (pH 8.0), 400mM NaCl, 0.5% SDS] containing 20uL proteinase K (20mg/ml). A slurry of 500uL of 0.1-mm-diameter zirconia/silica beads (BioSpec Products, Bartlesville, OK, USA) were added to the extraction tubes. Tubes were placed in a Mini-Beadbeater-8 cell disrupter (BioSpec Products) for 5 minutes to lyse bacterial cells. After overnight incubation at 55°C, extraction with phenol:chloroform:isoamyl alcohol, and precipitation with ethanol were performed. Isolated DNA was dissolved in nuclease-free water and stored at −80°C.
Polymerase Chain Reaction
Polymerase chain reaction was performed as follows: 5μL of 10x Ex Taq buffer containing 20mM MgCl2 (Takara, Tokyo, Japan), 4μL of 2.5mM dNTP Mixture (Takara), 1μL each of forward (27F, 5′-AGA GTT TGA TCC TGG CTC AG-3′) and reverse (1492R, GGT TAC CTT GTT ACG ACT-3′) primer (10mM each), 0.25μL of Taq polymerase (Takara), 36.75μL nuclease-free water, and 2μL of DNA template. The PCR conditions were: 94°C for 5 min followed by 30 cycles of amplification consisting of denaturation at 94°C for 30 sec, annealing at 58°C for 1 min, and extension at 72°C for 1.5 min.
DNA Repurification and Sequence Analysis
The resulting PCR product was then repurified using 3M sodium acetate (pH 5) and restriction digested with MspI enzyme. Samples were then dialyzed on a HAWP membrane filter (Millipore, Billerica, MA, USA) to remove excess salts and submitted to the Cancer Research Center DNA Sequencing Facility at the University of Chicago for sequence analysis. Principal Component Analysis (PCA) plots were then generated using these fluorescently labeled 5′-terminal restriction fragments through the T-REX website.18
16S rRNA-based Illumina Library Preparation and Data Analysis
PCR primers used were specific for the 515-806 bp region of the 16S rRNA encoding gene (338F: 5′-GTGCCAGCMGCCGCGGTAA-3′ and 806R: 5′-GGACTACHVGGGTWTCTAAT-3′) and contained Illumina 3′ adapter sequences as well as a 12-bp barcode. This barcode-based primer approach allowed sequencing of multiple samples in a single sequencing run without the need for physical partitioning. Sequencing was performed by an Illumia MiSeq DNA sequencer at Argonne National Laboratory. Sequences were then trimmed and classified with the QIIME toolkit. Using the QIIME wrappers, OTUs were picked at 97% sequence identity using cdhit and a representative sequence was then chosen for each OTU by selecting the most abundant sequence in that OTU. These representative sequences were aligned using PyNAST and taxonomy was assigned to them using the RDP Classifier. The PyNAST-aligned sequences were also used to build a phylogenetic tree with FastTree and unweighted UniFrac distances then computed between all samples for additional ecological analyses, including principal coordinates analysis (PCoA). Data will be available to the public via the MG-RAST system (http://metagenomics.anl.gov/).19
Results
Body weight, food consumption, and adiposity
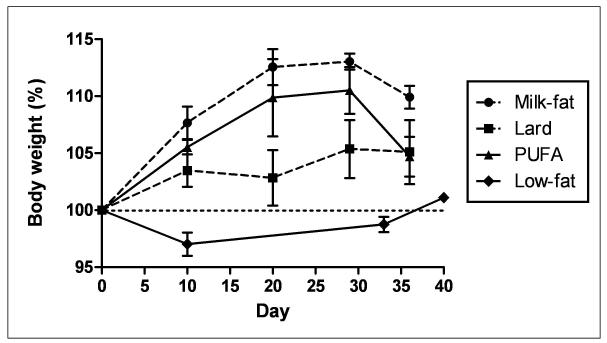
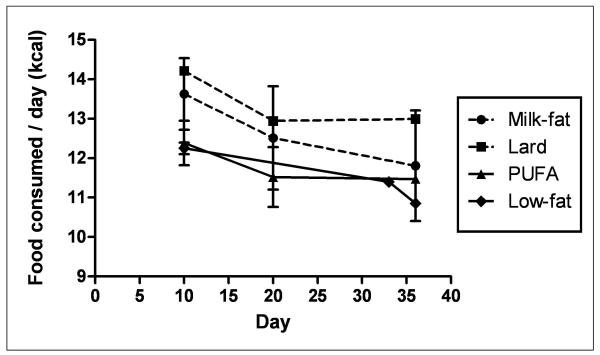
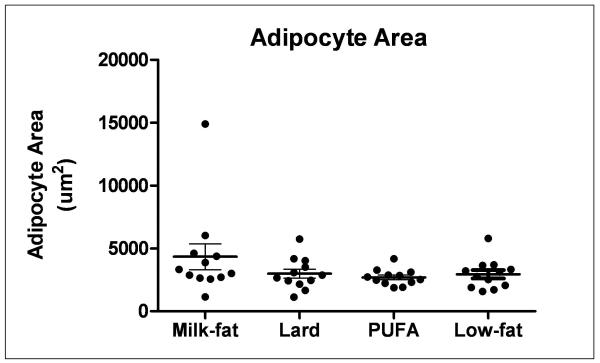
Animals fed a high-fat diet exhibited a greater, though not statistically significant, percentage of body weight gain relative to low-fat diet controls throughout the feeding period (Figure 1A). A similar trend in caloric intake was observed in both milk-fat and lard-diet groups (Figure 1B). Mice provided with polyunsaturated fatty-acid (PUFA) diet consumed calories in a pattern similar to low-fat fed mice, yet demonstrated a trend of weight gain throughout the study comparable to the other two high-fat diet groups (milk-fat and lard). Despite these findings, histological examination of gonadal fat did not show a significant difference in adipose tissue morphology between all diet groups, though milk-fat fed mice possessed slightly enlarged cells; these differences, however, were not statistically significant (Figure 2).
Figure 1.
Body weight and food consumption data. Values are means ± SEM (n = 3-4 per diet). Mice were fed either a high-fat (Milk-fat, Lard, or PUFA) or low-fat diet for four weeks. HF: High-fat. LF: Low-fat. PUFA: Polyunsaturated Fatty Acid, in the form of safflower oil.
Figure 2.
Histological H&E stain of gonadal adipose tissue from mice fed high- or low-fat diet. Gonadal depots were excised, fixed in 4% formalin/PBS, and paraffin embedded. 5-micron sections were processed and are representative of n=3-4 per diet. Adipocyte areas were calculated using ImageJ software (described in Methods) quantifying 12 representative adipose cells in each section per diet group. No statistically significant difference was observed between mean adipocyte areas between each diet group (P>0.05).
Analysis of Adipose Tissue Inflammation
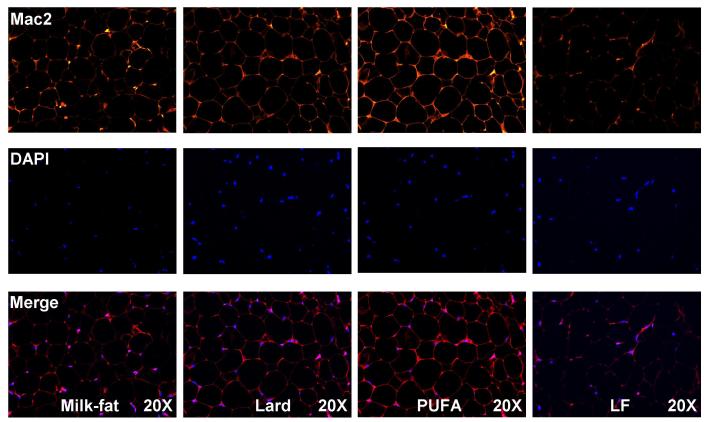
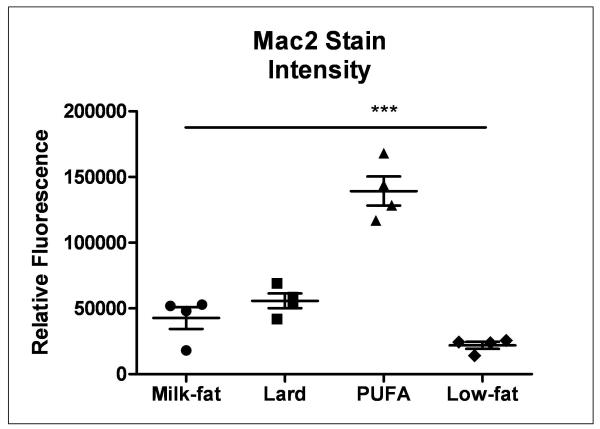
Gonadal adipose tissues were stained with Mac2 antibody to determine the extent of macrophage infiltration as a marker of adipose tissue inflammation. High-fat fed mice exhibited elevated levels of Mac2 relative to controls, irrespective of diet (Figure 3). However, the extent of inflammation differed significantly depending on the type of high-fat diet consumed. Mice consuming the PUFA diet exhibited dramatically higher levels of macrophage infiltration relative to milk-fat- and lard-fed mice, while no significant differences in macrophage staining between the latter two diets were observed.
Figure 3.
Immunofluorescent stain of macrophage infiltration in gonadal adipose tissue. 5-micron sections were stained with immunofluorescent Mac2 antibody. Sections shown are representative of images taken from 3-4 biological replicates per group. Fluorescent intensity was quantified using ImageJ as described earlier. ***P < 0.001 vs. all dietary treatment groups.
Gene Expression in Mesenteric vs. Gonadal depots
Gene expression levels of MCP-1 and CD192, two markers of adipose tissue inflammation, were significantly elevated in the mesenteric fat of lard- and PUFA-fed mice as measured by qRT-PCR (Table 2). Increased gene expression of these markers was also observed in gonadal fat but only in mice fed the PUFA diet, suggesting a pro-inflammatory response to consumption of a primarily safflower oil-based diet.
Table 2.
Inflammatory gene expression via quantitative real-time PCR in mesenteric and gonadal adipose tissue. Data are expressed as mean±SEM (n=3-4 per diet group). Differing alphabetic characters denote statistical significance as indicated.
| Inflammatory Gene Expression (relative to B-actin) |
Tissue type |
Milk-fat | Lard | PUFA | Low-fat Control |
P-value |
|---|---|---|---|---|---|---|
| MCP-1 | Mesenteric adipose |
5.11E-03 a | 9.80E-03 b | 1.12E-02 b | 3.07E-03 a | P < 0.01 |
| ± SEM | 5.37E-04 | 1.10E-03 | 7.73E-04 | 7.24E-05 | ||
| Gonadal adipose |
6.20E-03 a | 7.52E-03 a | 1.61E-02 b | 7.25E-03 a |
P <
0.001 |
|
| ± SEM | 4.45E-04 | 8.88E-04 | 1.52E-03 | 2.63E-04 | ||
|
| ||||||
| CD192 | Mesenteric adipose |
5.38E-04 a | 5.22E-04 a | 6.53E-04 a | 2.77E-04 b | P < 0.01 |
| ± SEM | 5.03E-05 | 3.76E-05 | 2.08E-05 | 1.95E-05 | ||
| Gonadal adipose |
7.12E-04 a | 5.00E-04 a | 1.29E-03 b | 5.45E-04 a |
P <
0.001 |
|
| ± SEM | 3.50E-05 | 4.96E-05 | 1.13E-04 | 2.14E-05 | ||
|
| ||||||
| Resistin | Mesenteric adipose |
2.80E+00 a | 1.79E+00 a | 4.36E+00 b | 1.01E+00 c | P < 0.05 |
| ± SEM | 3.04E-01 | 3.79E-01 | 4.58E-01 | 7.74E-02 | ||
| Gonadal adipose |
6.70E+00 a | 6.28E+00 a | 4.84E+00 a | 3.19E+00 b |
P <
0.001 |
|
| ± SEM | 4.33E-01 | 8.91E-01 | 3.41E-01 | 9.97E-02 | ||
|
| ||||||
| LPL | Mesenteric adipose |
2.25E+00 a | 1.30E+00 a | 3.28E+00 b | 9.71E-01 a | P < 0.01 |
| ± SEM | 2.45E-01 | 1.27E-01 | 4.06E-01 | 4.78E-02 | ||
| Gonadal adipose |
5.81E+00 a | 5.42E+00 a | 3.42E+00 b | 3.27E+00 b |
P <
0.01 |
|
| ± SEM | 4.84E-01 | 8.42E-01 | 3.02E-01 | 7.50E-02 | ||
Expression levels of resistin were significantly higher in both adipose depots of mice in all high-fat diet groups. Consistent with the observed increase in MCP-1 and CD192, PUFA-fed mice showed elevated expression of resistin in mesenteric fat. Consistent with the pro-inflammatory properties of high-fat diet consumption, resistin gene expression in gonadal adipose tissue was much higher in all high-fat diet groups. While the gene expression of lipoprotein lipase (LPL) was higher in mesenteric fat of PUFA-fed mice, similar changes were not observed in gonadal adipose tissue. Instead, gonadal expression levels of LPL in the PUFA diet group were similar to low-fat controls while milk-fat and lard-fed mice showed higher expression, signifying an increase in fat storage in the latter two groups.
T-RFLP and 16S rRNA Gene Data Analysis
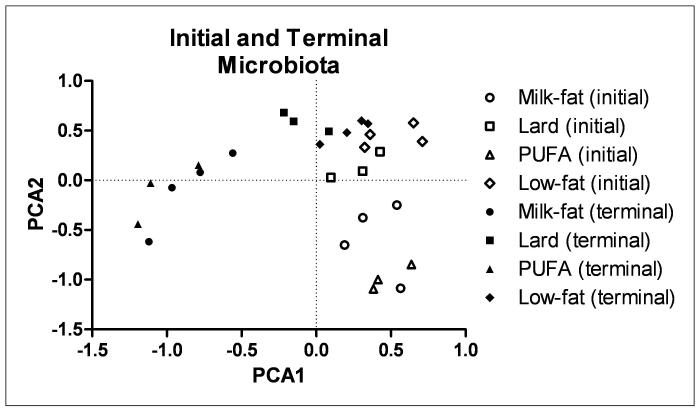
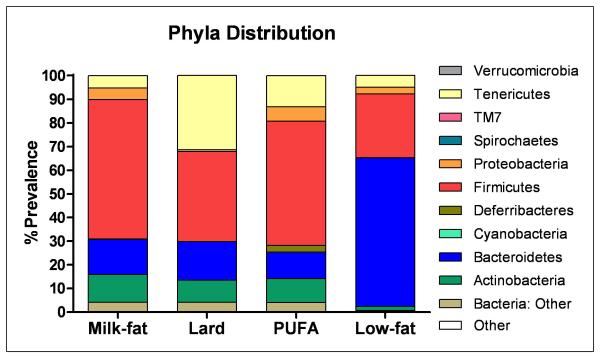
T-RFLP analysis of bacterial DNA was used to determine the extent to which diet affected gut microbial diversity. We observed a clear distinction between bacterial DNA from initial to terminal fecal samples in each diet group. Bacterial sequences of lard- and low-fat-fed mice clustered closer together while milk-fat and PUFA groups clustered closely to each other (Figure 4). However, each dietary treatment still resulted in a distinct cluster independent of the other diets. Figure 5 summarizes the relative distribution of phyla in each of the diet groups. While similar levels of Bacteroidetes were present in each diet treatment, both milk-fat and PUFA groups had lower levels of Tenericutes with a concomitant increase in Proteobacteria.
Figure 4.
Principle Component Analysis (PCA) plot of T-RFLP sets based on fecal microbiota before (initial, open shapes) and after (terminal, closed shapes) high- or low-fat diet.
Figure 5.
Effects of diet on the gut microbial architecture. Relative abundances of different phyla in each respective diet group are shown.
Discussion
Consumption of a high-fat diet can lead to significant weight gain resulting in obesity, diabetes, and metabolic syndrome. Several studies have suggested that metabolic disturbance and obesity arise from a chronic, low-grade inflammatory state that is subclinical. In this study, we investigated how specific dietary fat composition affected the intestinal microbiota and adipose tissue inflammation. Our results showed that consuming a high-fat diet containing milk-fat, lard, or safflower oil (PUFA) can result in striking differences in inflammatory/lipogenic gene expression in mesenteric and gonadal adipose tissue. Moreover, we observed shifts in the assemblage of gut microbiota based on dietary fat source, suggesting that dietary fat elicits a substantial and differential effect on the host-microbe relationship.
Body weight and food consumption
Previous studies have shown that high-fat feeding leads to weight gain.2, 20, 21 We fed C57Bl/6 mice a high-fat diet consisting of either milk-fat, lard, or PUFA (in the form of safflower oil). As expected, those mice fed high-fat diet gained more weight than low-fat fed control mice. However, no significant differences in body weight gain were observed between each of the high-fat fed groups. Our findings are in line with earlier studies suggesting that overall caloric consumption wields greater influence on body weight relative to the diet itself.22
Analysis of adipose tissue morphology and inflammation
Inflammation is a key contributor to metabolic dysfunction4, 23 and one of the primary progenitors of inflammation in the body is adipose tissue.24 Histological examination of adipose tissue did not reveal substantial morphological differences in depot size amongst diet treatments. This is consistent with our earlier observations that both body weight and caloric consumption were comparable between groups. However, a more granular analysis revealed dramatic differences in macrophage infiltration, a key characteristic of adipose tissue inflammation. All high-fat diet groups exhibited greater levels of macrophages relative to low-fat fed mice. Previous studies have shown that omega-6 fatty acids tend to have deleterious, pro-inflammatory effects.25, 26 Furthermore, consumption of safflower oil alone can lead to increased levels of inflammation.27, 28 The PUFA-fed mice exhibited the highest level of Mac2 staining compared to all other groups, overshadowing both the milk-fat and lard groups despite no significant difference in body weight gain between them. This suggests that consumption of a high-fat safflower oil-based diet may be more conducive toward the development of localized adipose inflammation when compared to milk-fat and lard diets with minimal impact on body weight.
Quantitative real-time PCR was used to characterize specific markers of inflammation in mesenteric and gonadal adipose tissue. MCP-1 and CD192 are chemokines associated with obesity and various inflammatory conditions.29, 30 Heterogeneity in inflammatory properties of various adipose tissue depots has suggested that mesenteric fat may be more pro-inflammatory relative to other depots.24, 31 Consistent with our earlier observations, mice fed PUFA diet exhibited significantly higher expression levels of both MCP-1 and CD192 in both adipose depots, signifying greater levels of inflammation in animals fed PUFA diet. These mice also possessed significantly elevated leptin gene expression (data not shown). Increased levels of leptin may contribute to macrophage accumulation through the stimulation of macrophage transport to adipose tissue.32 Surprisingly, both milk-fat and lard diets did not lead to robust increases in macrophage marker expression. Earlier studies have used milk-fat and lard as primary sources of fat to induce metabolic dysfunction.33, 34 One major difference however, is that our studies have utilized these dietary fats at a relatively lower percentage of fat calories. This may have contributed to the somewhat abated inflammatory phenotype observed in our experimental model.
Resistin is an adipocyte-secreted factor that can induce the expression of pro-inflammatory cytokines and is associated with obesity-related inflammation as well as cardiovascular disease.35-37 We observed an up-regulation of resistin in both mesenteric and gonadal adipose depots amongst all high-fat diet groups. PUFA-fed mice again exhibited significantly higher expression levels relative to animals fed the other diets. However, both milk-fat and lard diet-fed mice demonstrated elevated resistin expression as well when compared to their low-fat-fed counterparts. This suggests that though consumption of milk-fat and lard for four weeks does not induce outright, extensive macrophage infiltration, underlying symptoms of inflammation still persist, possibly setting the stage for increased severity of inflammation during long-term, chronic exposure to diets high in SFA.
In addition, our results also showed that liproprotein lipase (LPL) gene expression was significantly different between diet groups. In gonadal adipose, higher levels of LPL expression were observed among both the milk-fat and lard fed mice while this was not seen in PUFA-fed mice. In contrast, the PUFA-fed mice exhibited greater LPL gene expression in mesenteric fat relative to all other groups. These observations are consistent with previous work showing that lipid storage in gonadal adipose tissue may prevent inflammatory dysfunction by protecting against ectopic lipid accumulation.38 Conversely, a higher level of mesenteric fat is an independent risk factor for cardiovascular disease and inflammation.39 Thus, the increased expression of LPL in the gonadal depot of milk-fat and lard fed mice may only be a consequence of an increase in dietary fat consumption. Moreover, higher LPL activity in the mesenteric depot of PUFA-fed mice may be a prelude to the propagation of systemic inflammation.
The consumption of PUFAs has classically been thought to promote healthy, anti-inflammatory benefits. Indeed, studies have reported that replacing SFAs with unsaturated fatty acids may confer anti-inflammatory effects. 40, 41 However, we report here that consumption of a high-fat, omega-6-based diet instead produces a localized, tissue-specific pro-inflammatory effect greater than that seen with both milk-fat and lard-based diets, demonstrating that not all dietary fats are created equal. In addition, dietary moderation is also an important principle to consider, as high consumption of omega-6 fatty acids have been shown to increase the production of pro-inflammatory molecules,25 while in moderation, balanced levels may actually promote health. 42
T-RFLP and 16S rRNA gene bacterial analysis
Despite similar caloric intake, consumption of high-fat diets led to a substantial, yet differential shift in gut microbiota signifying that dietary components wield considerable influence on microbial architecture. After diet treatment, bacterial sequences from both PUFA- and milk-fat-fed mice clustered closely together whereas those from the lard-fed group were more similar to low-fat controls. Similarly, 16S rRNA analysis of the gut microbiota revealed a stark contrast between the microbiota from milk-fat/PUFA, lard or low-fat-fed mice. Our lab has previously reported similar ratios of bacteria phyla between milk-fat and PUFA-fed mice despite the differences in their fatty acid content. However, comprehensive Sanger-based sequencing analysis revealed distinct bacterial species that were either present or absent in stool from mice in each diet group.19 Among the three high-fat diet groups we observed a decrease in Tenericutes in both the milk-fat and PUFA-fed mice. Tenericutes have been shown to be reduced under conditions of inflammation,43, 44 consistent with our observations. However, the decrease in this bacteria phyla observed in the milk-fat group may suggest an inflammatory condition which may be independent of adipose tissue.
Intriguingly, both milk-fat and PUFA-fed groups exhibited higher levels of the phyla Proteobacteria. We have previously reported a specific species of proteobacteria as having a pivotal role in the development of intestinal inflammation.19 However, one limitation of 16S Illumina-based sequencing is the lack of depth in identifying specific bacterial species, suggesting that further bacterial analysis using a more comprehensive method such as Sanger sequencing is warranted.
Conclusion
In summary, we have shown that changes in dietary fat content can affect both host adipose tissue inflammation and the composition of the gut microbiota. Earlier studies have reported a link between high dietary intake of omega-6 fatty acids and inflammation.11, 45 In addition, research has shown that commensal gut microbiota are highly susceptible to changes induced by high-fat dietary factors,19, 46 suggesting that diet-mediated changes in gut microbiota could be playing a role in inflammatory propagation.17, 47 We observed mild inflammation in mice that consumed a milk-fat or lard-based diet while consumption of a safflower oil-based diet led to overt inflammation in mesenteric and gonadal fat. Moreover, shifts in gut bacteria were observed despite no significant difference in body weight and caloric consumption among mice fed each high-fat diet group. While these findings suggest an unconventional role for PUFA consumption in the development of inflammation, one of the limitations of the present study was the small number of animals in each treatment arm, limiting conclusions about efficacy. Despite this potential limitation, we found statistically significant differences in various inflammatory parameters between diet groups.
Altogether, these results suggest a correlation between dietary fat source-induced gut microbiota and localized, adipose tissuee-induced inflammation. The anti-inflammatory properties of consuming omega-3 fatty acids on both adipose tissue inflammation and gut bacteria may be a possible avenue to further characterize this link. Further studies in both gnotobiotic as well as conventionalized mice will also help identify a mechanism by which diet-induced changes to the gut microbiota ultimately influences localized inflammation.
Acknowledgements
This work was supported by the National Institute of Health (NIH): T32DK07074 (to EH), R37DK4772 (to EC), R01DK097268 (to EC), F31AT006073 (to SD), the University of Chicago Digestive Diseases Research Core Center P30DK42086 (to EC), and the Gastro-Intestinal Research Foundation (GIRF). The authors would also like to thank Dr. Jack Gilbert from Argonne National Laboratories for 16S rRNA gene sequencing, as well as Dr. Mark Musch, Zi-Ning Choo, and Kevin Li for technical support and assistance with data analysis.
References
- 1.Thivel D, Tremblay M, Chaput J-P. Modern Sedentary Behaviors Favor Energy Consumption in Children and Adolescents. Current Obesity Reports. :1–8. [Google Scholar]
- 2.Cani PD, Bibiloni R, Knauf C, et al. Changes in Gut Microbiota Control Metabolic Endotoxemia-Induced Inflammation in High-Fat Diet Induced Obesity and Diabetes in Mice. Diabetes. 2008 Jun;57(6):1470–1481. doi: 10.2337/db07-1403. 2008. [DOI] [PubMed] [Google Scholar]
- 3.Chalkiadaki A, Guarente L. High-Fat Diet Triggers Inflammation-Induced Cleavage of SIRT1 in Adipose Tissue To Promote Metabolic Dysfunction. Cell metabolism. 2012 Aug 08;16(2):180–188. doi: 10.1016/j.cmet.2012.07.003. [DOI] [PMC free article] [PubMed] [Google Scholar]
- 4.Scarpellini E, Tack J. Obesity and Metabolic Syndrome: An Inflammatory Condition. Digestive Diseases. 2012;30(2):148–153. doi: 10.1159/000336664. [DOI] [PubMed] [Google Scholar]
- 5.Wang X, Cheng M, Zhao M, et al. Differential effects of high-fat-diet rich in lard oil or soybean oil on osteopontin expression and inflammation of adipose tissue in diet-induced obese rats. Eur J Nutr. 2012 Jul 31; doi: 10.1007/s00394-012-0428-z. [DOI] [PubMed] [Google Scholar]
- 6.Catta-Preta M, Martins MA, Cunha Brunini TM, Mendes-Ribeiro AC, Mandarim-de-Lacerda CA, Aguila MB. Modulation of cytokines, resistin, and distribution of adipose tissue in C57BL/6 mice by different high-fat diets. Nutrition. 2012;28(2):212–219. doi: 10.1016/j.nut.2011.05.011. [DOI] [PubMed] [Google Scholar]
- 7.Wall R, Ross RP, Fitzgerald GF, Stanton C. Fatty acids from fish: the anti-inflammatory potential of long-chain omega-3 fatty acids. Nutr Rev. 2010 May;68(5):280–289. doi: 10.1111/j.1753-4887.2010.00287.x. [DOI] [PubMed] [Google Scholar]
- 8.Djousse L, Gaziano JM, Buring JE, Lee IM. Dietary omega-3 fatty acids and fish consumption and risk of type 2 diabetes. The American Journal of Clinical Nutrition. 2011 Jan 1;93(1):143–150. doi: 10.3945/ajcn.110.005603. 2010. [DOI] [PMC free article] [PubMed] [Google Scholar]
- 9.Jarreau TK, Lee JH, Lavie CJ, Ventura HO. Should We Start Prescribing Omega-3 Polyunsaturated Fatty Acids in Chronic Heart Failure? Current Heart Failure Reports. 2012;9(1):8–13. doi: 10.1007/s11897-011-0073-5. [DOI] [PubMed] [Google Scholar]
- 10.Patterson E, Wall R, Fitzgerald GF, Ross RP, Stanton C. Health Implications of High Dietary Omega-6 Polyunsaturated Fatty Acids. Journal of Nutrition and Metabolism. 2012;2012:16. doi: 10.1155/2012/539426. [DOI] [PMC free article] [PubMed] [Google Scholar]
- 11.Simopoulos AP. The importance of the ratio of omega-6/omega-3 essential fatty acids. Biomedicine & Pharmacotherapy. 2002;56(8):365–379. doi: 10.1016/s0753-3322(02)00253-6. [DOI] [PubMed] [Google Scholar]
- 12.Ley RE, Backhed F, Turnbaugh P, Lozupone CA, Knight RD, Gordon JI. Obesity alters gut microbial ecology. Proceedings of the National Academy of Sciences of the United States of America. 2005 Aug 2;102(31):11070–11075. doi: 10.1073/pnas.0504978102. 2005. [DOI] [PMC free article] [PubMed] [Google Scholar]
- 13.Backhed F, Ding H, Wang T, et al. The gut microbiota as an environmental factor that regulates fat storage. Proceedings of the National Academy of Sciences of the United States of America. 2004 Nov 2;101(44):15718–15723. doi: 10.1073/pnas.0407076101. 2004. [DOI] [PMC free article] [PubMed] [Google Scholar]
- 14.Turnbaugh PJ, Ley RE, Mahowald MA, Magrini V, Mardis ER, Gordon JI. An obesity-associated gut microbiome with increased capacity for energy harvest. Nature. 2006;444(7122):1027–1031. doi: 10.1038/nature05414. [DOI] [PubMed] [Google Scholar]
- 15.Liu T, Hougen H, Vollmer AC, Hiebert SM. Gut bacteria profiles of Mus musculus at the phylum and family levels are influenced by saturation of dietary fatty acids. Anaerobe. 2012;18(3):331–337. doi: 10.1016/j.anaerobe.2012.02.004. [DOI] [PubMed] [Google Scholar]
- 16.Hooda S, Boler BMV, Serao MCR, et al. 454 Pyrosequencing Reveals a Shift in Fecal Microbiota of Healthy Adult Men Consuming Polydextrose or Soluble Corn Fiber. The Journal of nutrition. 2012;142(7):1259–1265. doi: 10.3945/jn.112.158766. [DOI] [PubMed] [Google Scholar]
- 17.de La Serre CB, Ellis CL, Lee J, Hartman AL, Rutledge JC, Raybould HE. Propensity to high-fat diet-induced obesity in rats is associated with changes in the gut microbiota and gut inflammation. American Journal of Physiology - Gastrointestinal and Liver Physiology. 2010 Aug 1;299(2):G440–G448. doi: 10.1152/ajpgi.00098.2010. 2010. [DOI] [PMC free article] [PubMed] [Google Scholar]
- 18.Culman S, Bukowski R, Gauch H, Cadillo-Quiroz H, Buckley D. T-REX: software for the processing and analysis of T-RFLP data. BMC Bioinformatics. 2009;10(1):171. doi: 10.1186/1471-2105-10-171. [DOI] [PMC free article] [PubMed] [Google Scholar]
- 19.Devkota S, Wang Y, Musch MW, et al. Dietary-fat-induced taurocholic acid promotes pathobiont expansion and colitis in Il10-/-mice. Nature. 2012;487(7405):104–108. doi: 10.1038/nature11225. [DOI] [PMC free article] [PubMed] [Google Scholar]
- 20.Storlien LH, James DE, Burleigh KM, Chisholm DJ, Kraegen EW. Fat feeding causes widespread in vivo insulin resistance, decreased energy expenditure, and obesity in rats. American Journal of Physiology - Endocrinology And Metabolism. 1986 Nov 1;251(5):E576–E583. doi: 10.1152/ajpendo.1986.251.5.E576. 1986. [DOI] [PubMed] [Google Scholar]
- 21.Milagro FI, Campión J, Martínez JA. Weight Gain Induced by High-Fat Feeding Involves Increased Liver Oxidative Stress. Obesity. 2006;14(7):1118–1123. doi: 10.1038/oby.2006.128. [DOI] [PubMed] [Google Scholar]
- 22.Warwick ZS, Schiffman SS. Role of dietary fat in calorie intake and weight gain. Neuroscience & Biobehavioral Reviews. 1992;16(4):585–596. doi: 10.1016/s0149-7634(05)80198-8. [DOI] [PubMed] [Google Scholar]
- 23.Steinberg GR. Inflammation in obesity is the common link between defects in fatty acid metabolism and insulin resistance. Cell Cycle. 2007 Apr 15;6(8):888–894. doi: 10.4161/cc.6.8.4135. [DOI] [PubMed] [Google Scholar]
- 24.Tran TT, Yamamoto Y, Gesta S, Kahn CR. Beneficial Effects of Subcutaneous Fat Transplantation on Metabolism. Cell Metabolism. 2008;7(5):410–420. doi: 10.1016/j.cmet.2008.04.004. [DOI] [PMC free article] [PubMed] [Google Scholar]
- 25.Harris WS, Mozaffarian D, Rimm E, et al. Omega-6 Fatty Acids and Risk for Cardiovascular Disease: A Science Advisory From the American Heart Association Nutrition Subcommittee of the Council on Nutrition, Physical Activity, and Metabolism; Council on Cardiovascular Nursing; and Council on Epidemiology and Prevention. Circulation. 2009 Feb 17;119(6):902–907. doi: 10.1161/CIRCULATIONAHA.108.191627. 2009. [DOI] [PubMed] [Google Scholar]
- 26.Machado RM, Nakandakare ER, Quintao ECR, et al. Omega-6 polyunsaturated fatty acids prevent atherosclerosis development in LDLr-KO mice, in spite of displaying a pro-inflammatory profile similar to trans fatty acids. Atherosclerosis. 2013;224(1):66–74. doi: 10.1016/j.atherosclerosis.2012.06.059. [DOI] [PubMed] [Google Scholar]
- 27.Tate G, Mandell BF, Laposata M, et al. Suppression of acute and chronic inflammation by dietary gamma linolenic acid. The Journal of rheumatology. 1989;16(6):729–734. [PubMed] [Google Scholar]
- 28.Weiss LA, Chambers CD, Gonzalez V, Hagey LR, Jones KL. The omega-6 fatty acid linoleic acid is associated with risk of gastroschisis: A novel dietary risk factor. American Journal of Medical Genetics Part A. 2012;158A(4):803–807. doi: 10.1002/ajmg.a.35204. [DOI] [PubMed] [Google Scholar]
- 29.Yamaguchi A, Nozawa K, Fujishiro M, et al. CC motif chemokine ligand 13 is associated with rheumatoid arthritis pathogenesis. Modern Rheumatology. 2012:1–8. doi: 10.1007/s10165-012-0752-4. [DOI] [PubMed] [Google Scholar]
- 30.Cancello R, Henegar C, Viguerie N, et al. Reduction of macrophage infiltration and chemoattractant gene expression changes in white adipose tissue of morbidly obese subjects after surgery-induced weight loss. Diabetes. 2005 Aug;54(8):2277–2286. doi: 10.2337/diabetes.54.8.2277. [DOI] [PubMed] [Google Scholar]
- 31.Vohl MC, Sladek R, Robitaille J, et al. A survey of genes differentially expressed in subcutaneous and visceral adipose tissue in men. Obes Res. 2004 Aug;12(8):1217–1222. doi: 10.1038/oby.2004.153. [DOI] [PubMed] [Google Scholar]
- 32.Sierra-Honigmann MR, Nath AK, Murakami C, et al. Biological action of leptin as an angiogenic factor. Science. 1998 Sep 11;281(5383):1683–1686. doi: 10.1126/science.281.5383.1683. [DOI] [PubMed] [Google Scholar]
- 33.Gregoire FM, Zhang Q, Smith SJ, et al. Diet-induced obesity and hepatic gene expression alterations in C57BL/6J and ICAM-1-deficient mice. Am J Physiol Endocrinol Metab. 2002 Mar;282(3):E703–713. doi: 10.1152/ajpendo.00072.2001. [DOI] [PubMed] [Google Scholar]
- 34.Briaud I, Kelpe CL, Johnson LM, Tran PO, Poitout V. Differential effects of hyperlipidemia on insulin secretion in islets of langerhans from hyperglycemic versus normoglycemic rats. Diabetes. 2002 Mar;51(3):662–668. doi: 10.2337/diabetes.51.3.662. [DOI] [PubMed] [Google Scholar]
- 35.Filkova M, Haluzik M, Gay S, Senolt L. The role of resistin as a regulator of inflammation: Implications for various human pathologies. Clin Immunol. 2009 Nov;133(2):157–170. doi: 10.1016/j.clim.2009.07.013. [DOI] [PubMed] [Google Scholar]
- 36.Bokarewa M, Nagaev I, Dahlberg L, Smith U, Tarkowski A. Resistin, an adipokine with potent proinflammatory properties. J Immunol. 2005 May 1;174(9):5789–5795. doi: 10.4049/jimmunol.174.9.5789. [DOI] [PubMed] [Google Scholar]
- 37.Kaser S, Kaser A, Sandhofer A, Ebenbichler CF, Tilg H, Patsch JR. Resistin messenger-RNA expression is increased by proinflammatory cytokines in vitro. Biochem Biophys Res Commun. 2003 Sep 19;309(2):286–290. doi: 10.1016/j.bbrc.2003.07.003. [DOI] [PubMed] [Google Scholar]
- 38.Kiefer FW, Neschen S, Pfau B, et al. Osteopontin deficiency protects against obesity-induced hepatic steatosis and attenuates glucose production in mice. Diabetologia. 2011;54(8):2132–2142. doi: 10.1007/s00125-011-2170-0. [DOI] [PMC free article] [PubMed] [Google Scholar]
- 39.Gustafson B. Adipose tissue, inflammation and atherosclerosis. J Atheroscler Thromb. 2010;17(4):332–341. doi: 10.5551/jat.3939. [DOI] [PubMed] [Google Scholar]
- 40.Holland WL, Bikman BT, Wang LP, et al. Lipid-induced insulin resistance mediated by the proinflammatory receptor TLR4 requires saturated fatty acid-induced ceramide biosynthesis in mice. J Clin Invest. 2011 May;121(5):1858–1870. doi: 10.1172/JCI43378. [DOI] [PMC free article] [PubMed] [Google Scholar]
- 41.Lee JY, Sohn KH, Rhee SH, Hwang D. Saturated Fatty Acids, but Not Unsaturated Fatty Acids, Induce the Expression of Cyclooxygenase-2 Mediated through Toll-like Receptor 4. Journal of Biological Chemistry. 2001 May 18;276(20):16683–16689. doi: 10.1074/jbc.M011695200. 2001. [DOI] [PubMed] [Google Scholar]
- 42.Harris W. Omega-6 and omega-3 fatty acids: partners in prevention. Current Opinion in Clinical Nutrition & Metabolic Care. 2009;13(2):125. doi: 10.1097/MCO.0b013e3283357242. [DOI] [PubMed] [Google Scholar]
- 43.Nagalingam NA, Kao JY, Young VB. Microbial ecology of the murine gut associated with the development of dextran sodium sulfate-induced colitis. Inflammatory Bowel Diseases. 2010;17(4):917–926. doi: 10.1002/ibd.21462. [DOI] [PMC free article] [PubMed] [Google Scholar]
- 44.Hajishengallis G, Darveau RP, Curtis MA. The keystone-pathogen hypothesis. Nat Rev Micro. 2012;10(10):717–725. doi: 10.1038/nrmicro2873. [DOI] [PMC free article] [PubMed] [Google Scholar]
- 45.Calder PC, Ahluwalia N, Brouns F, et al. Dietary factors and low-grade inflammation in relation to overweight and obesity. Br J Nutr. 2011;106(Suppl 3):S5–78. doi: 10.1017/S0007114511005460. [DOI] [PubMed] [Google Scholar]
- 46.Turnbaugh PJ, Ridaura VK, Faith JJ, Rey FE, Knight R, Gordon JI. The Effect of Diet on the Human Gut Microbiome: A Metagenomic Analysis in Humanized Gnotobiotic Mice. Science Translational Medicine. 2009 Nov 11;1(6):6ra14. doi: 10.1126/scitranslmed.3000322. 2009. [DOI] [PMC free article] [PubMed] [Google Scholar]
- 47.Cani PD, Amar J, Iglesias MA, et al. Metabolic Endotoxemia Initiates Obesity and Insulin Resistance. Diabetes. 2007 Jul;56(7):1761–1772. doi: 10.2337/db06-1491. 2007. [DOI] [PubMed] [Google Scholar]


