

Abstract
Nuclear receptor peroxisome proliferator-activated receptor gamma (PPARγ) is an essential transcription factor for adipocyte differentiation. In mesenchymal stem cells, PPARγ has been assumed to play a negative role in osteoblastic differentiation, by working in an adipogenesis dependent manner, due to the reciprocal relationship between osteoblast and adipocyte differentiation. However, the direct role of PPARγ in osteoblast function is not fully understood, due in part to inadequate model systems. Here, we describe an adenoviral-mediated PPARγ knock-out system in which suppression of PPARγ in mesenchymal stem cells enhanced osteoblast differentiation and inhibited adipogenesis in vitro. Consistent with this in vitro observation, lipoatrophic A-ZIP/F1 mice, which do not form adipocytes, displayed a phenotype in which both cortical and trabecular bone was significantly increased compared to wild type mice. We next developed an inducible osteoblast-targeted PPARγ knock-out (Osx Cre/flox- PPARγ) mouse to determine the direct role of PPARγ in bone formation. Data from both in vitro cultures of mesenchymal stem cells and in vivo μCT analysis of bones suggests that suppression of PPARγ activity in osteoblasts significantly increased osteoblast differentiation and trabecular number. Endogenous PPARγ in mesenchymal stem cells and osteoblasts strongly inhibited Akt/mTOR/p70S6k activity and led to decreased osteoblastic differentiation. Therefore, we conclude that PPARγ modulates osteoblast differentiation and bone formation through both direct and indirect mechanisms. The direct mode, as shown here, involves PPARγ regulation of the mTOR pathway, while the indirect pathway is dependent on the regulation of adipogenesis.
Keywords: FAT, BONE, mTOR, PPARγ, RUNX2, OSTEOBLAST
Introduction
Nuclear receptor peroxisome proliferator-activated receptor gamma (PPARγ) is an essential transcription factor for adipocyte differentiation. Evidence for this requirement is derived from observations that embryonic stem cells (ESC) from mice lacking PPARγ are unable to differentiate into fat tissue [1] and that over-expression of PPARγ in fibroblasts initiates adipogenesis [2]. Expression of PPARγ is activated by naturally occurring fatty acids, peroxisome proliferators, and the thiazolidinedione (TZD) class of antidiabetic agents [3]. The TZDs, which function to lower blood glucose, have been widely used for the treatment of type 2 diabetes mellitus. Unfortunately, a significant side effect of this therapy is the potential for bone loss and subsequent skeletal fractures in diabetic patients [4]. This clinical consequence may be due to an imbalance between osteogenesis and adipogenesis when PPARγ is overactivated in response to TZD [4]. However, the specific role of PPARγ in osteogenesis is not fully understood.
A direct role for PPARγ in bone formation has been difficult to determine because of the reciprocal regulation relationship that is hypothesized to exist between osteoblast and adipocyte differentiation of mesenchymal progenitor cells. For example, age-related osteoporosis is most often accompanied by an increase in bone marrow adipose tissue and it is believed that fat increases when osteoblasts are decreasd because progenitors form adipocytes instead of osteoblasts [5]. In contrast, PPARγ-deficient ES cells fail to differentiate into adipocytes, but instead spontaneously differentiate into osteoblasts [1]. In transgenic animal models, PPARγ-insufficient mice exhibit high bone mass with increased osteogenesis and decreased adipogenesis [6]. Adipocytes also directly modulate osteoblast function through paracrine effects of secretory adipocytokines, such as adiponectin and leptin [7–10]. Taken together, these data suggest that PPARγ regulates bone formation in an indirect manner, a reciprocal effect of its primary modulation of adipogenesis and/or through adipocytokines. However, functional PPARγ is also expressed in mouse and human osteoblasts [11–13], which suggests that PPARγ may play a direct role in regulating osteogenesis. One recent study indicates that osteoblast-targeted over-expression of PPARγ significantly reduces bone mass in mice [14]. However, it has also been reported that over-expression of PPARγ induces trans-differentiation of osteoblasts to adipocytes [15]. The PPARγ over-expression mouse model is therefore not sufficient to completely understand the physiologic role of PPARγ in osteogenesis. Moreover, recent evidence indicates that suppression of adipogenesis by inhibition of PPARγ is not able to increase osteogenesis either in vitro or in vivo [16, 17]. Therefore, it is essential to determine the extent to which PPARγ has a direct role in osteoblast function and bone formation.
Because the molecular mechanisms by which PPARγ could regulate osteoblasts are not fully understood we sought to determine how PPARγ might interact with a key metabolic signaling pathway in bone. Mammalian target of rapamycin (mTOR) is the catalytic subunit of two distinct signaling complexes, mTOR complex 1 and 2 (mTORC1 and mTORC2) [18]. mTORC1 activates ribosomal S6 kinase (S6K) and inactivates eukaryotic initiation factor 4E binding protein 1 (4EBP1) and thus stimulates protein synthesis, cell growth, cell proliferation, and progression through the cell cycle. Promotion of cell survival and cytoskeletal reorganization is also enhanced when mTORC2 activates Akt and PKCα [19–21]. Recent work also supports an important role of mTOR in the regulation of cell differentiation [22–25].
It is well known that the global protein translation level in stem cells is lower than differentiated cells, whereas the activation of protein translation in these stem cells can initiate differentiation [22–25]. We, and others, recently demonstrated that mTOR signaling plays an essential role in osteoblast differentiation in vitro [26–30]. It is notable that rapamycin, an inhibitor of mTOR, inhibits osteogenesis both in vitro and in vivo [31]. Moreover, mTOR also plays an important role in PPARγ-mediated adipogenesis [32, 33]. These data suggest a potential for crosstalk between the mTOR and PPARγ pathways, both of which are important for osteogenesis. In this study, we used in vitro models and developed a new osteoblast-specific PPARγ knock-out mouse to study the physiologic role of endogenous PPARγ in bone formation and found that the mTOR pathway was directly involved in PPARγ-mediated modulation of osteogenesis and conclude that PPARγ modulates bone formation through both direct and indirect mechanisms.
Materials and Methods
Cell culture
Bone marrow mesenchymal stem cells (BMSCs) were harvested and cultured as described previously [34, 35] with modifications. Briefly, femora and tibiae were dissected free of surrounding soft tissues. The aspirates were flushed with α-Modified Eagle's Medium (α-MEM; Invitrogen, Carlsbad, CA), and filtered through a 40-μm cell strainer. The marrow content of 4–6 bones was plated into a T75 culture flask in BMSC growth medium comprised of α-MEM containing 10% fetal bovine serum (FBS), 100U/ml penicillin, 100 mg/ml streptomycin sulfate (Gibco, Grand Island, NY). Nonadherent cells were removed and adherent BMSCs were cultured and expanded for further experiments. Primary cells prior to passage 4 were used in the experiments. It is generally believed that BMSCs are the common progenitors for osteoblasts and adipocytes. As a primary cell type, BMSCs may more likely reflect the nature of cells of the bone marrow, in addition to their potential for clinical use when compared to cells lines. However, BMSCs are a heterogeneous population. Therefore, the well-defined bone marrow stromal cell line, ST2 [36], which has osteoblast/adipocyte bipotential, is an ideal cell type for mechanistic studies on the reciprocal relationship between osteoblast and adipocyte differentiation. Similarly, the pre-osteoblast cell line MC3T3-E1 is an appropriate cell type to study molecular mechanisms when the cells have been committed to osteoblasts. ST2 and MC3T3-E1 cells were cultured in High Glucose Dulbecco's Modified Eagle Medium (HG-DMEM) containing 10% FBS, 100U/ml penicillin, 100 mg/ml streptomycin sulfate (Gibco,Grand Island, NY) and α-MEM containing 10% FBS, 100U/ml penicillin, 100 mg/ml streptomycin sulfate, respectively.
PPARγ was activated by 5 μg/ml Troglitazone (Trog, Cayman Chemical, Ann Arbor, MI), and the vehicle, dimethyl sulfoxide(DMSO, Sigma) treated group was included as the control. BMSCs from PPARγ flox/flox mice were transfected with adenovirus as described previously [9] with minor modifications. The cells were plated at a density of 20,000 cells/cm2 in T75 flasks. After 4 hours, virus was added at a multiplicity of infection (MOI) of 1000 in 4 ml α-MEM with 0.5% FBS. The virus-containing medium was removed and complete fresh medium was added after 4-hour cell transduction. Adenovirus-expressing cre recombinase (Ad-Cre) was harvested on February 19, 2009, and viral titer was 2.40E11 plaque forming unit (PFU) per milliliter. Adenovirus CMVpLpA.dlE3 #1 (Ad-Blank) was harvested on February 18, 2001, and viral titer was 1.30E11 PFU per milliliter.
Gene expression analysis
PCR analysis to detect knockout of PPARγ by Ad-Cre was performed as previously described [37] with modifications. Genomic DNA in the transfected BMSCs was harvested using the DNeasy Blood & Tissue Kit (Qiagen, Germantow, MD). The primers for genotyping included one forward primer 2F: CTC CAA TGT TCT CAA ACT TAC and two reverse primers 1R: GAT GAG TCA TGT AAG TTG ACC and H5: GTA TTC TAT GGC TTC CAG TGC. Primer pair 2F/1R was designed to amplify the intact PPARγ gene and the amplified length was 285bp. Primer pair 2F/H5 was used to detect the deleted gene and the amplified length was 450bp. Thermal cycling conditions were as follows: 95°C, 5 min, 40 cycles at (95°C, 30 sec, 55°C, 30 sec, 72°C, 45 sec), 72°C, 5 min and 4°C. A 2% agarose-TAE gel electrophoresis followed by ethidium bromide staining was used to detect bands.
For the osteogenic and adipogenic gene expressions of the Ad-Cre BMSCs, the total RNA was isolated using the RNeasy®Micro Kit (Qiagen, Germantow, MD). RNA concentration was determined at 260 nm and an equivalent amount of RNA sample (2 μg) was processed to generate cDNA using the High Capacity cDNA Reverse Transcript kit (Applied Biosystems, Forster City, CA). Quantitative PCR was performed by the SYBR Green PCR method using the ABI PRISM 7500 sequence detection system (Applied Biosystems, Carlsbad, CA, USA). The house keeping gene Glyceraldehyde 3-phosphate dehydrogenase (GAPDH) was used for normalization, GAPDH_F: TGA AGC AGG CAT CTG AGG G; GAPDH_R: CGA AGG TGG AAG AGT GGG AG. Primers for Osteocalcin (OCN) and fatty acid binding protein 4 (FABP4) were: OCN_F: CAA GCA GGG TTA AGC TCA CA; OCN_R: GGT AGT GAA CAG ACT CCG GC [9]; FABP4_F:AAT GTG TGA TGC CTT TGT GG; FABP4_R: CAC TTT CCT TGT GGC AAA GC. Gene expressions in ST2 and MC3T3-E1 cells were performed with Taqman gene expression assays (Applied Biosystems, Forster City, CA). The genes analyzed were: GAPDH (Mm99999915), Runx2 (Mm00501584), OCN (Mm-03413826) and PPARγ (Mm01184322) (Applied Biosystems, Forster City, CA).
in vitro mineralization assays
The mineralization assay used for primary BMSCs was described previously [9]. Briefly, cells were plated in 12-well or 24-well plates at 20,000 cells/cm2. Plated cells were allowed to grow to confluence in growth medium. After reaching confluence, cells were cultured in osteogenic medium (BMSC Growth Medium + 100 nM dexamethasone, 10 mM β-glycerophosphate, and 50 μM ascorbic acid 2-phosphate (all from Sigma)) for up to 14 days. The same protocol was used for ST2 and MC3T3-E1 cells except the osteogenic medium did not contain dexamethasone. Subsequently, cells were fixed with cold 70% ethanol for 1 hour, rinsed with water, stained for 10 minutes in 40 mM Alizarin red S (pH 4.2), and washed extensively with water. After imaging, the dye was eluted with 10% w/v hexadecylpyridinium chloride monohydrate (Wako, Chemical, Osaka, Japan) in 10 mM sodium phosphate pH 7.0 and concentration was determined by absorbance measurement at 562 nm. The results were normalized to total genomic DNA content.
in vitro adipogenic differentiation assays
The adipogenic differentiation assay was performed as described previously [9]. Briefly cells were plated at 40,000 cells per square centimeter and grown to confluence in HGDMEM growth medium (HG-DMEM containing 10% FBS, 100U/ml penicillin, 100 mg/ml streptomycin sulfate). Cells were induced with adipogenic medium (HG-DMEM Growth Medium + 50 μM Isobutylmethylxanthine (Sigma), 1 μM dexamethasone (Sigma), 167 nM insulin (Sigma), and 5 μg/ml Troglitazone (Cayman Chemical, Ann Arbor, MI)) for 2 days. Adipogenic maintenance medium (HG-DMEM Growth Medium + 167 nM insulin) was then added for another 2 days. This process of induction medium followed by maintenance media was repeated three times. Cells were then fixed in zinc buffered formalin (Z-fix, Anatech LTD, Battle Creek, MI) for half hour and stained with Oil Red O solution (Sigma). Dye was eluted in 100% isopropanol and quantified at 500 nm. The results were normalized to total genomic DNA.
Genetically modified mice
Animal experiments were approved by the institutional animal care and use committee. PPARγ floxed mice [19] were crossed with tetracycline regulatable osterix-Cre mice [38] purchased from Jackson Laboratories (B6.Cg-Tg(Sp7-tTA,tetO-EGFP/cre)1Amc/J; Stock Number: 006361). Mice were maintained on Doxycycline feed (Harlan Item #: TD.01306; Rodent Diet (2018, 625 Doxycycline) throughout the entire process of crossing the two lines to achieve homozygozity of the floxed PPARγ allele. Mice that were Osx-Cre positive/PPARγ f/f (experimental) or that were Osx-Cre negative/PPARγ f/f or (control) were removed from the Doxycycline feed at weaning (~3weeks) and harvested at six-months of age. For the in vitro experiments, BMSCs from the experimental and control mice were isolated, cultured and differentiated using the same methods as aforementioned. To further investigate the role of adipogenesis in bone formation in an in vivo context, we tested our hypothesis in A-ZIP/F1 fatless mice that do not form adipocytes due to the expression of a dominant-negative form of C/EBP under the FABP4 promoter [39]. AZip-F1 mice were provided by Dr. Chuck Vinson and harvested as indicated for evaluation of bone geometric parameters using microCT.
μCT 3D reconstruction and bone morphometry
Femurs were fixed for 2 days with Z-fix (Anatech LTD, Battle Creek, MI), then moved to 70% ethanol, and scanned at a voxel size of 18 μm using a μCT scanner (GE Healthcare Pre-Clinical Imaging, London, ON). Micro View software (GE Healthcare Pre-Clinical Imaging) was used to generate a three-dimensional reconstruction from the set of scans. Assessment of bone microstructure was carried out according to the guidelines developed by Bouxsein et al [40]. The region selected for cortical bone parameters was defined to be the central portion between the proximal and distal ends of the femur. Trabecular bone parameters were measured by analyzing the metaphyseal region adjacent to growth plate. User-defined contours were drawn every 5 images and interpolated for all images in between. The thresholds for cortical and trabecular bone were set to 2000 and 1200, respectively.
Western Blot Analysis
Primary BMSCs transfected with Ad-Cre/Ad-Blank after 3 days were harvested for Western Blot analysis. ST2 and MC3T3-E1 cells were treated with 50 μM bisphenol A diglycidyl ether (BADGE, Sigma) for 24 hours and harvested as well for Western Blot analysis as previously described [26]. Briefly, whole cell lysates were separated on 10% SDS-polyacrylamide gel and transferred to PVDF membrane. The membranes were incubated with 5% milk for 1 hour and incubated with primary antibodies overnight at 4 °C. Primary antibodies used were as follows: polyclonal anti-phospho-AKT (1:500; Cell Signaling, Danvers, MA), polyclonal anti-AKT (1:1,000; Cell Signaling), polyclonal anti-phospho-p70S6K (1:500; Cell Signaling), polyclonal anti-p70S6K (1:1,000; Cell Signaling), polyclonal anti-PPARγ (1:1,000; Santa Cruz Biotechnology, Santa Cruz, CA), polyclonal anti-RUNX2 (1:1,000; Santa Cruz), and polyclonal anti-Osteocalcin (1:1,000; Millipore). Blots were incubated with peroxidase-coupled secondary antibodies (Promega, Madison, WI) for 1 hour, and protein expression was detected with SuperSignal West Pico Chemiluminescent Substrate (Thermo Scientific, Rockford, IL). Membranes were reprobed with polyclonal anti-β-actin antibody (1:1,000; Cell Signaling) to control for equal loading.
Statistical Analysis and Image Editing
To determine statistical significance of observed differences between the study groups, a two-tailed homoscedastic t-test was applied. A value of p<0.05 was considered to be statistically significant while 0.05<p<0.10 was considered to represent a non-significant, but clear trend in cell or tissue response. Values are reported as the mean ± standard deviation (SD). Brightness and contrast were adjusted equally across all images for improved visibility.
Results
Knock-out of PPARγ in BMSCs increases osteogenesis and inhibits adipogenesis
Primary BMSCs were isolated from PPARγ flox/flox mice to study the effects of PPARγ gene knock-out on adipogenesis and osteogenesis. PCR-based genotyping assays demonstrated robust LoxP recombination indicating loss of PPARγ at the gene level (450bp band) in BMSCs after Ad-Cre delivery, while no band was detected in the control group (Ad-Blank) (Fig. 1A). It was noted that residual intact PPARγ (285 bp band) remained in the deleted group. Consistent with the essential role of PPARγ in adipogenesis, the adipogenic differentiation of BMSCs was largely inhibited by in vitro PPARγ gene knock-out. When PPARγ expression was abrogated, Oil Red O staining and FABP4 gene expression was diminished (Fig. 1B). In contrast, PPARγ knock-out led to significantly increased mineralization and OCN gene expression in BMSCs (Fig. 1C). This in vitro adenoviral-mediated PPARγ knock-out system therefore demonstrated that suppression of PPARγ enhanced osteogenesis and reduced adipogenesis.
Fig.1. Knock-out of PPARγ in BMSCs increases osteogenesis and inhibits adipogenesis.


(A) PCR-based genotyping. The deleted bands (450bp) were detected only in the AdCRE group (CRE) while the intact bands (285bp) were detected in both control (CON) and CRE groups. (B) PPARγ is essential for adipogenesis for BMSCs. Oil Red O staining and FABP4 gene expression was diminished when PPARγ expression was abrogated by Ad-Cre (n=3). (C) PPARγ knock-out increases osteogenesis. PPARγ knockout led to significantly increased mineralization and OCN gene expression in BMSCs (n=3). Data are expressed as means ± SD. Scale bar=50μm.
Osteogenesis is modulated by PPARγ-mediated adipogenesis in vitro and in vivo
After a 2 week culture period in osteogenic medium, ST2 cells were strongly positive for Alizarin red S staining (Fig. 2A). This finding is in contrast to the effects observed when PPARγ was activated. Mineralization of ST2 cells was inhibited when PPARγ was activated by troglitazone, a PPARγ ligand that supports PPAR activation. Accordingly, troglitazone-treated ST2 cells switched to an adipogenic phenotype with Oil red O positive lipid droplets accumulating in cultured cells (Fig. 2A), suggestings that osteogenesis was negatively modulated by PPARγ-induced adipogenesis.
Fig.2. Osteogenesis is modulated by PPARγ-mediated adipogenesis in vitro and in vivo.
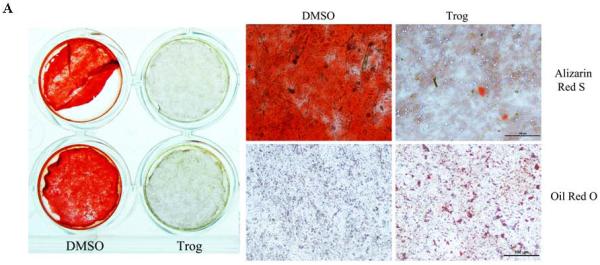
(A) Osteogenic differentiation of ST2 cells is inhibited by PPARγ activation. After 2 week-culture in osteogenic medium, ST2 cells were strongly positive for alizarin red S staining. Mineralization of ST2 cells was inhibited when PPARγ was activated by troglitazone. Accordingly, troglitazone-treated ST2 cells switched to an adipogenic phenotype with Oil red O positive lipid droplets in cultured cells (n=4). Scale bar=100μm. (B) Cortical bone formation is increased in A-ZIP/F1 fatless mice. Micro-CT data, including mean cortical thickness, bone mineral content (BMC) and bone mineral density (BMD), demonstrated a clear trend (0.05<p<0.10) that cortical bone was increased in A-ZIP/F1 (n=5) relative to wild type (n=6) mice. The marrow area in A-ZIP/F1 bones was significantly lower than in wild type mice. (C) Trabecular bone formation is increased in A-ZIP/F1 fatless mice. The bone μCT values, including bone surface/bone volume (BS/BV) and trabecular spacing (Tb.Sp.), were significantly decreased, while trabecular number (Tb.N) was significantly increased in A-ZIP/F1 mice. The bone/tissue volume (BV/TV) ratio also indicated a higher trend (0.05<p<0.10) in A-ZIP/F1 mice (n=5) compared to wild type mice (n=6). Data are expressed as means ±SD.
Micro-CT data from A-ZIP/F1 mouse long bones demonstrated a clear trend (0.05<p<0.10) in which cortical bone was increased in A-ZIP/F1 relative to wild type mice. These parameters included mean cortical thickness, bone mineral content (BMC) and bone mineral density (BMD). In line with this trend, the marrow area in A-ZIP/F1 bones was significantly lower than in wild type mice (Fig. 2B). Compared to cortical bone, the effects of adipogenic deficiency were more profound for trabecular bone formation in A-ZIP/F1 mice. The bone μCT values, including bone surface/bone volume (BS/BV) and trabecular spacing (Tb.Sp.), were significantly decreased, while trabecular number (Tb.N) was significantly increased in A-ZIP/F1 mice. The bone/tissue volume (BV/TV) ratio also indicated a higher trend (0.05<p<0.10) in A-ZIP/F1 mice (Fig. 2C). Therefore, both our in vitro and in vivo data indicated that PPARγ-mediated adipogenesis negatively regulated bone formation.
Osteoblast-targeted PPARγ suppression increased osteogenesis in vitro
Based on the opposing effects on mineralization when PPARγ was either knocked-out or activated, we hypothesized that the inhibitory effects of PPAR activation on bone formation were due, in part, to its pro-adipogeneic function. Therefore, to determine if PPARγ had a direct role in osteogenesis that was independent on adipogenesis, BMSCs from osteoblast-targeted PPARγ knock-out mice were isolated and their capacity for osteogenic differentiation was examined. Compared to the BMSCs from WT mice, BMSCs from osteoblast-targeted PPARγ knock-out mice demonstrated much higher mineralization after 2 weeks in culture in osteogenic differentiation medium (Fig. 3A). The finding that mineralization was enhanced when PPARγ was blocked was corroborated in pre-osteoblastic MC3T3-E1 cells when they were treated by BADGE, an effective antagonist of PPARγ (Fig. 3B). The effects of PPARγ inhibition on osteoblast-related gene expression in ST2 and MC3T3-E1 were tested after 24h BADGE treatment. Osteocalcin gene expression was enhanced by BADGE, while no significant difference was noticed for Runx2 expression in either cell type. Interestingly, expression of PPARγ was also increased by BADGE treatment (Fig. 3C). Taken together, these data suggest that PPARγ in osteoblasts or preosteoblastic cells is able to modulate osteogenic differentiation through a direct manner in vitro.
Fig.3. Osteoblast-targeted PPARγ suppression increased osteogenesis in vitro.

(A) Osteoblast-targeted PPARγ knock-out increases mineralization. Compared to the BMSCs from WT mice, BMSCs from osteoblast-targeted PPARγ knock-out mice demonstrated much higher mineralization after 2 week-culture in osteogenic differentiation medium (n=3). Scale bar=100μm. (B) Mineralization is increased by PPARγ antagonist. The mineralization in MC3T3-E1 cells was enhanced when PPARγ was blocked by BADGE (n=3). (C, D) Gene expression in BADGE-treated ST2 and MC3T3-E1 cells. The effects of PPARγ inhibition on osteoblast-related gene expression in ST2 and MC3T3-E1 were tested after 24h BADGE treatment. Osteocalcin (OCN) gene expression was enhanced by BADGE, while no significant difference was noticed for Runx2 expression in either cell type. Expression of PPARγ was also slightly increased by BADGE treatment (n=3). Data are expressed as means ± SD.
Osteoblast-Targeted PPARγ knock-out increases trabecular number in adult mice
To directly assess bone mass when PPARγ is not expressed in osteoblasts, an inducible osteoblast-targeted PPARγ knock-out mouse model was developed. Femurs from control and experimental groups were harvested and analyzed at six-months of age. Quantitative data from μCT analyses demonstrated that PPARγ deletion in osteoblasts had little effect on cortical bone as they demonstrated similar mean thickness and marrow area (Fig.4 A and B). In contrast, the structure of trabecular bone was significantly altered by deletion of PPARγ in osteoblasts (Fig. 4A and C). Among the trabecular analyses, trabecular number (Tb.N.) was significantly increased and trabecular spacing (Tb.Sp) was significantly decreased in PPARγ KO mice. The bone volume fraction (BV/TV) also indicated a clear trend towards increasing BV/TV (0.05<p<0.10) in KO mice, (Fig.4 A and C). Therefore, conditional deletion of PPARγ in osteoblasts significantly increased trabecular number while it had limited effects on cortical bone. These in vivo data also suggest that PPARγ plays a direct role in osteoblastogenesis in addition to its primary role in adipogenesis.
Fig.4. Osteoblast-Targeted PPARγ knock-out increases trabecular number in adult mice.


(A) 3D reconstructed μCT images of cortical, trabecular bone and the region of interest (ROI) for cortical and trabecular bone analyses in Control (n=6) and PPARγ KO group (n=5). Scale bar (left panel=250μm; Scale bar (right panel) =1mm. (B) μCT analysis of cortical bone. PPARγ deletion in osteoblasts had little effect on cortical bone as they demonstrated similar mean thickness and marrow area. (C) μCT analysis of trabecular bone. The structure of trabecular bone was significantly altered by deletion of PPARγ in osteoblasts. Trabecular number (Tb.N.) was significantly increased and trabecular spacing (Tb.Sp) was significantly decreased in PPARγ KO mice. The bone volume fraction (BV/TV) also indicated a clear trend of increasing BV/TV (0.05<p<0.10) in KO mice. Data are expressed as means ± SD.
Suppression of endogenous PPARγ increases mTOR signaling and osteogenesis
The in vitro deletion of PPARγ in BMSCs dramatically elevated phosphorylation of p70S6K (p-p70S6K), which is the primary down-stream effector of mTOR signaling (Fig. 5A). Consistent with the increase in p-p70S6K, phosphorylation of AKT (p-AKT), which is one of the up-steam activators for mTOR signaling, was also enhanced when Ad-Cre was used to knock down PPARγ (Fig. 5A). In complementary studies, the level of pp70S6K was significantly increased in MC3T3-E1 and ST2 cells after 24-hour treatment with BADGE. It was noted that the basal level of p-p70S6K in ST2 cells was much lower than in 3T3-E1 cells. The levels of p-AKT were also increased in both cell types after BADGE-induced PPARγ suppression. In addition, treatment with BADGE resulted in elevated levels of Runx2 and/or OCN in ST2 and MC3T3-E1 cells (Fig. 5B). Consistent with the data supporting the hypothesis that PPARγ influences osteoblast differentiation by inhibiting mTOR signaling, mineralization of MC3T3-E1 cells exposed to BADGE was severely inhibited by rapamycin treatment (Fig. 5C), suggesting that rapamycin can rescue the loss of PPARγ activity. These data indicate that endogenous PPARγ in osteoblasts inhibited the activity of mTOR signaling, which is essential for osteogenesis. Consistent with the in vitro data, the levels of phosphorylation of p70S6K (p-p70S6K, red staining) in osteoblasts and osteocytes were clearly increased in the PPARγ KO mice (Sup Fig.1). Therefore, our data strongly suggest that the negative effects of PPARγ on osteogenesis are partially mediated through inhibition of mTOR signaling.
Fig.5. Suppression of endogenous PPARγ increases mTOR signaling and osteogenesis.

(A) Deletion of PPARγ in BMSCs dramatically increases mTOR signaling. Deletion of PPARγ in BMSCs dramatically elevated the phosphorylation of p70S6K (p-p70S6K) and phosphorylation of AKT (p-AKT). (B) Suppression of endogenous PPARγ by BADGE dramatically increases mTOR signaling in MC3T3-E1 and ST2 cells. The levels of p-AKT and p-p70S6K were increased in both cell types after BADGE-induced PPARγ suppression. BADGE-treatment resulted in the elevated levels of Runx2 and/or OCN in ST2 and MC3T3-E1 cells. (C) Rapamycin inhibits mineralization in osteoblasts. The BADGE-enhanced mineralization in MC3T3-E1 cells was severely inhibited by rapamycin-treatment (n=3). Data are expressed as means ± SD.
Discussion
In the current study, PPARγ was specifically deleted in vitro and in osteoblasts in adult mice. Collectively, the data indicated that PPARγ negatively regulates osteoblast differentiation and bone formation. Additionally, it was determined that PPARγ inhibits mTOR signaling since either disruption of PPARγ expression or treatment with the PPARγ inhibitor BADGE increases mTOR signaling, and increases osteoblast differentiation.
In addition to adipogenesis, PPARγ regulates a variety of physiologic processes including lipid metabolism, insulin sensitivity, inflammation, angiogenesis and osteoclastogenesis [3, 41–43]. Among these PPARγ-mediated physiologic processes adipogenesis, inflammation, angiogenesis and osteoclastogenesis are known to be involved in bone homeostasis [3, 41, 44–46]. However, due to overlapping signaling in these complex biologic functions, it is difficult to distinguish the direct role and mechanism of action for PPARγ in osteogenesis [6, 47, 48]. Most of the available evidence suggests that the negative effects of PPARγ on bone formation are through an adipogenesis-dependent mechanism. This conclusion may be explained by the reciprocal relationship between osteoblasts and adipocytes, which are both derived from mesenchymal stem cells [49]. Furthermore, TZD treatment is known to stimulate the secretion of adiponectin and tumor necrosis factor alpha (TNF-α) from fat tissue and thereby induce bone loss [50, 51]. However, the notion of a reciprocal relationship between adipogenesis and osteogenesis in the marrow is challenged by emerging data that suggest that the inhibition of adipogenesis is not always accompanied by increased osteogenesis [16, 17]. For example, systemic treatment with BADGE, a PPARγ antagonist, effectively blocks type I diabetes-induced hyperlipidemia and bone marrow adiposity. However, BADGE treatment is not able to block type I diabetes-induced bone loss [16]. In line with this in vivo finding, BADGE and GW9662, two antagonists of PPARγ, as well as lentivirus-mediated knockdown of PPARγ, inhibit adipocyte differentiation from MSC without significantly affecting osteogenesis [17].
Because of conflicting evidence linking adipogenesis and osteogenesis, we sought to directly study the contribution of PPARγ in osteogenic differentiation, we isolated BMSCs from PPARγ flox/flox mice and administered Ad-Cre to knock-out PPARγ in vitro. Prior to cell harvest and addition of Ad-Cre, the flox/flox mice have the same phenotype as wild type mice. Use of this system eliminates the potential for systemic regulation of precursor cells that may otherwise be present in traditional phenotypically altered PPARγ knockout animals. Moreover, compared to the chemical antagonists (BADGE and GW9662), the Ad-Cre assay has minimal side effects because it is designed to specifically target the PPARγ gene. The in vitro data support the finding that PPARγ is essential for adipogenesis and that osteogenic differentiation is enhanced when endogenous PPARγ is deleted in BMSCs.
To further determine the effects of adipogenesis on bone formation, we used the AZIP/F1 mouse model. Adipogenesis in these mice is largely blocked due to the expression of a dominant-negative form of C/EBP under the adipocyte fatty-acid-binding protein 4 (FABP4) promoter, while the expression of PPARγ was not affected [39]. The μCT data demonstrated that both cortical and trabecular bone were significantly increased in these adipoatrophic mice. In contrast, when adipogenesis was induced by PPARγ activation, osteogenesis was blocked in ST2 cells. It has also been reported that inhibition of adipogenesis in whole animals has profound effects in addition to regulation of osteogenesis. For example, in lipoatrophic A-ZIP/F1 `fatless' mice, and in mice treated with BADGE, marrow engraftment after irradiation is accelerated relative to wild-type or untreated mice [52]. This finding suggests that suppression of adipogenesis may not only enhance osteogenesis but may increase hematopoiesis as well.
In addition to the indirect adipogenesis-mediated effects of PPARγ on osteogenesis, several lines of study from in vitro systems also suggest that PPARγ may have a direct effect on osteoblast differentiation. It has been reported by several groups that functional PPARγ is expressed in osteoblasts [11–13]. Moreover, the pro-adipogenic and anti-osteoblastic PPARγ activities can be separately activated by different ligands [53]. Further studies indicate that PPARγ pro-adipogenic activity involves binding to Peroxisome Proliferator Activated Receptor-Response Element (PPRE) in gene regulatory regions while its anti-osteoblastic activity is PPRE-independent [54]. To study the role of PPARγ in osteoblast function, we specifically deleted PPARγ in osteoblasts by using the Cre/loxP system. BMSCs from the PPARγ KO (Osx Cre/flox- PPARγ) mice demonstrated a higher mineralization capacity compared to the cells from WT mice. Consistent with the in vitro results, the μCT analyses revealed that several trabecular bone parameters were significantly increased in PPARγ KO mice compared to the WT mice. Our findings are supported by a recent report that in vivo over-expression of PPARγ specifically in osteoblasts under the control of a 2.3-kb procollagen type 1 promoter negatively regulates bone mass in male mice [14]. It is noted that the overexpression model may result in more unexpected changes to the mice compared to our conditional KO model. Indeed, they disclose that the osteoclastogenesis is significantly inhibited in mice overexpressing PPARγ [14]. However, it is known that PPARγ is a pro-osteoclastogeneic regulator in vitro and in vivo [45]. Moreover, over-expression of PPARγ in osteoblasts unexpectedly increases the adipogenesis of BMSCs in vitro although no significant difference in vivo was reported [14]. These drawbacks from the over-expression strategy are mitigated in the tetracycline (tet)-inducible Cre/loxP system (Tet-Off) used in our experiments. Tetracycline has been widely used in bone histomorphometry to label new bone formation [55] and to regulate the Cre recombinase gene in knock-out mice [56]. Doxycycline, a member of the tetracycline family, was used in our control group to maintain normal PPARγ functions by inhibiting the expression of Cre recombinase. However, it has been reported that tetracyclines are able to increase bone formation by both increasing osteoblast activity and inhibiting osteoclast function [57]. Therefore, the difference in bone formation due to PPARγ knock-out may be masked by doxycycline treatment, which is one of the possible reasons that BVF (p=0.07) did not achieve statistical significance in the KO group relative to the control group, because our control group was provided doxycycline to repress Cre activity.
Our data indicate that PPARγ is able to regulate osteoblast differentiation and bone formation through both indirect and direct mechanisms. The indirect pathway is related to reciprocal differentiation as has been previously discussed. The direct regulation of osteogenesis, however, is not completely defined. Our recent work indicates that mTOR is directly involved in odontoblast and osteoblast differentiation [26, 27]. The contribution of mTOR to bone formation is further confirmed by a recent study in which significantly less bone formation and a lower trabecular bone mass was observed in rapamycin-treated C57BL/6 mice compared to the vehicle-treated controls [31]. It is intriguing that in the current study we demonstrated that the Akt/mTOR/p70S6K pathway was activated after knock-out of PPARγ in BMSCs, or by a PPARγ antagonist in osteoblasts. Accordingly, osteoblastic markers were increased by the suppression of PPARγ activity. Moreover, osteoblastic differentiation following the suppression of PPARγ was blocked by rapamycin. Our data are consistent with the previous finding that rapamycin inhibits osteoblast differentiation, while over-expression of p70S6K significantly increases levels of Runx2 protein and Runx2 activity [29]. These results clearly indicate that the mTOR pathway is essential for osteoblast differentiation and that it is largely inhibited by endogenous PPARγ in osteoblasts.
In summary, our data demonstrate that PPARγ modulates bone formation through bimodal mechanisms (Fig. 6). The indirect pathway is dependent on adipogenesis, which includes not only the role of PPARγ in the commitment of stem cells, but also the potential for negative regulation by adjacent mature adipocytes. The direct mechanism is independent of adipogenesis. The direct suppression of PPARγ in osteoblasts significantly increases osteoblast differentiation and trabecular bone formation which is demonstrated in the Osx-PPARγ knock-out mouse model. We further demonstrate that endogenous PPARγ in osteoblasts strongly inhibits mTOR activity, thus inhibiting osteoblastic differentiation.
Fig.6. PPARγ modulates bone formation through direct and indirect mechanisms.

The indirect pathway is dependent on adipogenesis, which includes not only the role of PPARγ in the allocation of stem cells, but also the potential negative regulation derived from adipocytes. The direct mechanism is independent on adipogenesis. The endogenous PPARγ in osteoblasts strongly inhibits the mTOR activity, thus inhibiting Runx2/Osteocalcin mediated osteoblastic differentiation.
Supplementary Material
Supplementary Fig.1. Deletion of PPARγ in osteoblast increases mTOR signaling in vivo. The mTOR signaling in vivo was detected by staining the p-p70S6K. More positive stained (red) osteoblasts and oseocytes were observed in the KO mice compared with the control group (WT), while the hematopoietic tissues (bone marrow) were equally positively stained. The black arrows in the high power filed (right panel) indicated the osteoblasts lined on the new bone surface. Scale bar = 50μm (in low power filed, left panel). Scale bar = 25 μm (in high power filed, right panel).
Acknowledgement
This study was supported by NIH grants RO1-AR-054714 (KDH) and RO1-DK-082481(PHK). The authors also thank Dr. Erica L. Scheller for helpful discussions and comments on the manuscript and Derek Dopkin and Jason Combs for outstanding technical assistance.
Footnotes
Author contributions: H.S.: conception and design, collection and/or assembly of data, data analysis and interpretation, manuscript writing, and final approval of manuscript; J.K.K.: collection and/or assembly of data, data analysis and interpretation, manuscript writing and final approval of manuscript; R.M.M. and P.L.M.: provision of study material, collection and/or assembly of data, data analysis and interpretation, and final approval of manuscript; K.D.H.: conception and design, financial support, data analysis and interpretation, and final approval of manuscript; P.H.K.: conception and design, financial support, data analysis and interpretation, manuscript writing and final approval of manuscript.
Disclosure of potential conflicts of interest The authors state no potential conflicts of interest.
Reference
- 1.Rosen ED, et al. PPARγ Is Required for the Differentiation of Adipose Tissue In Vivo and In Vitro. Molecular Cell. 1999;4(4):611–617. doi: 10.1016/s1097-2765(00)80211-7. [DOI] [PubMed] [Google Scholar]
- 2.Tontonoz P, Hu E, Spiegelman BM. Stimulation of adipogenesis in fibroblasts by PPARγ2, a lipid-activated transcription factor. Cell. 1994;79(7):1147–1156. doi: 10.1016/0092-8674(94)90006-x. [DOI] [PubMed] [Google Scholar]
- 3.Tontonoz P, Spiegelman BM. Fat and Beyond: The Diverse Biology of PPARγ. Annual Review of Biochemistry. 2008;77(1):289–312. doi: 10.1146/annurev.biochem.77.061307.091829. [DOI] [PubMed] [Google Scholar]
- 4.Betteridge DJ. Thiazolidinediones and fracture risk in patients with Type 2 diabetes. Diabetic Medicine. 2011;28(7):759–771. doi: 10.1111/j.1464-5491.2010.03187.x. [DOI] [PubMed] [Google Scholar]
- 5.MEUNIER P, et al. Osteoporosis and the Replacement of Cell Populations of the Marrow by Adipose Tissue: A Quantitative Study of 84 Iliac Bone Biopsies. Clinical Orthopaedics and Related Research. 1971;80:147–154. doi: 10.1097/00003086-197110000-00021. [DOI] [PubMed] [Google Scholar]
- 6.Akune T, et al. PPAR γ insufficiency enhances osteogenesis through osteoblast formation from bone marrow progenitors. The Journal of Clinical Investigation. 2004;113(6):846–855. doi: 10.1172/JCI19900. [DOI] [PMC free article] [PubMed] [Google Scholar]
- 7.Liu L-F, et al. Adipocytes decrease Runx2 expression in osteoblastic cells: Roles of PPARγ and adiponectin. Journal of Cellular Physiology. 2010;225(3):837–845. doi: 10.1002/jcp.22291. [DOI] [PubMed] [Google Scholar]
- 8.Shinoda Y, et al. Regulation of bone formation by adiponectin through autocrine/paracrine and endocrine pathways. Journal of Cellular Biochemistry. 2006;99(1):196–208. doi: 10.1002/jcb.20890. [DOI] [PubMed] [Google Scholar]
- 9.Scheller EL, et al. Leptin Functions Peripherally to Regulate Differentiation of Mesenchymal Progenitor Cells. STEM CELLS. 2010;28(6):1071–1080. doi: 10.1002/stem.432. [DOI] [PMC free article] [PubMed] [Google Scholar]
- 10.Ducy P, et al. Leptin Inhibits Bone Formation through a Hypothalamic Relay: A Central Control of Bone Mass. Cell. 2000;100(2):197–207. doi: 10.1016/s0092-8674(00)81558-5. [DOI] [PubMed] [Google Scholar]
- 11.Mbalaviele G, et al. Activation of Peroxisome Proliferator-activated Receptor-γ Pathway Inhibits Osteoclast Differentiation. Journal of Biological Chemistry. 2000;275(19):14388–14393. doi: 10.1074/jbc.275.19.14388. [DOI] [PubMed] [Google Scholar]
- 12.Maurin AC, Chavassieux PM, Meunier PJ. Expression of PPARγ and β/δ in Human Primary Osteoblastic Cells: Influence of Polyunsaturated Fatty Acids. Calcified Tissue International. 2005;76(5):385–392. doi: 10.1007/s00223-004-0108-y. [DOI] [PubMed] [Google Scholar]
- 13.Jackson SM, Demer LL. Peroxisome proliferator-activated receptor activators modulate the osteoblastic maturation of MC3T3-E1 preosteoblasts. FEBS Letters. 2000;471(1):119–124. doi: 10.1016/s0014-5793(00)01372-7. [DOI] [PubMed] [Google Scholar]
- 14.Cho SW, et al. Osteoblast-targeted overexpression of PPARγ inhibited bone mass gain in male mice and accelerated ovariectomy-induced bone loss in female mice. Journal of Bone and Mineral Research. 2011;26(8):1939–1952. doi: 10.1002/jbmr.366. [DOI] [PubMed] [Google Scholar]
- 15.Kim SW, et al. Ectopic overexpression of adipogenic transcription factors induces transdifferentiation of MC3T3-E1 osteoblasts. Biochemical and Biophysical Research Communications. 2005;327(3):811–819. doi: 10.1016/j.bbrc.2004.12.076. [DOI] [PubMed] [Google Scholar]
- 16.Botolin S, McCabe LR. Inhibition of PPARγ prevents type I diabetic bone marrow adiposity but not bone loss. Journal of Cellular Physiology. 2006;209(3):967–976. doi: 10.1002/jcp.20804. [DOI] [PubMed] [Google Scholar]
- 17.Yu W-H, et al. PPARγ suppression inhibits adipogenesis but does not promote osteogenesis of human mesenchymal stem cells. The International Journal of Biochemistry & Cell Biology. 2011;44(2):377–384. doi: 10.1016/j.biocel.2011.11.013. [DOI] [PubMed] [Google Scholar]
- 18.Zoncu R, Efeyan A, Sabatini DM. mTOR: from growth signal integration to cancer, diabetes and ageing. Nat Rev Mol Cell Biol. 2011;12(1):21–35. doi: 10.1038/nrm3025. [DOI] [PMC free article] [PubMed] [Google Scholar]
- 19.Akiyama TE, et al. Conditional Disruption of the Peroxisome Proliferator-Activated Receptor gamma Gene in Mice Results in Lowered Expression of ABCA1, ABCG1, and apoE in Macrophages and Reduced Cholesterol Efflux. Molecular and Cellular Biology. 2002;22(8):2607–2619. doi: 10.1128/MCB.22.8.2607-2619.2002. [DOI] [PMC free article] [PubMed] [Google Scholar]
- 20.Nojima H, et al. The Mammalian Target of Rapamycin (mTOR) Partner, Raptor, Binds the mTOR Substrates p70 S6 Kinase and 4E-BP1 through Their TOR Signaling (TOS) Motif. Journal of Biological Chemistry. 2003;278(18):15461–15464. doi: 10.1074/jbc.C200665200. [DOI] [PubMed] [Google Scholar]
- 21.Jacinto E, et al. Mammalian TOR complex 2 controls the actin cytoskeleton and is rapamycin insensitive. Nat Cell Biol. 2004;6(11):1122–1128. doi: 10.1038/ncb1183. [DOI] [PubMed] [Google Scholar]
- 22.Sampath P, et al. A Hierarchical Network Controls Protein Translation during Murine Embryonic Stem Cell Self-Renewal and Differentiation. Cell Stem Cell. 2008;2(5):448–460. doi: 10.1016/j.stem.2008.03.013. [DOI] [PubMed] [Google Scholar]
- 23.Dunlop EA, et al. Mammalian target of rapamycin complex 1-mediated phosphorylation of eukaryotic initiation factor 4E-binding protein 1 requires multiple protein-protein interactions for substrate recognition. Cellular Signalling. 2009;21(7):1073–1084. doi: 10.1016/j.cellsig.2009.02.024. [DOI] [PubMed] [Google Scholar]
- 24.Easley C.A.t., et al. mTOR-mediated activation of p70 S6K induces differentiation of pluripotent human embryonic stem cells. Cell Reprogram. 2010;12(3):263–73. doi: 10.1089/cell.2010.0011. [DOI] [PMC free article] [PubMed] [Google Scholar]
- 25.Turnquist HR, et al. mTOR and GSK-3 shape the CD4+ T-cell stimulatory and differentiation capacity of myeloid DCs after exposure to LPS. Blood. 2010;115(23):4758–69. doi: 10.1182/blood-2009-10-251488. [DOI] [PMC free article] [PubMed] [Google Scholar]
- 26.Kim J, et al. Erythropoietin mediated bone formation is regulated by mTOR signaling. Journal of Cellular Biochemistry. 2012;113(1):220–228. doi: 10.1002/jcb.23347. [DOI] [PMC free article] [PubMed] [Google Scholar]
- 27.Kim J-K, et al. mTor Plays an Important Role in Odontoblast Differentiation. Journal of Endodontics. 2011;37(8):1081–1085. doi: 10.1016/j.joen.2011.03.034. [DOI] [PubMed] [Google Scholar]
- 28.Tang C-H, et al. Ultrasound Induces Hypoxia-inducible Factor-1 Activation and Inducible Nitric-oxide Synthase Expression through the Integrin/Integrin-linked Kinase/Akt/Mammalian Target of Rapamycin Pathway in Osteoblasts. Journal of Biological Chemistry. 2007;282(35):25406–25415. doi: 10.1074/jbc.M701001200. [DOI] [PubMed] [Google Scholar]
- 29.Singha UK, et al. Rapamycin inhibits osteoblast proliferation and differentiation in MC3T3-E1 cells and primary mouse bone marrow stromal cells. Journal of Cellular Biochemistry. 2008;103(2):434–446. doi: 10.1002/jcb.21411. [DOI] [PubMed] [Google Scholar]
- 30.Tseng W-P, et al. Hypoxia induces BMP-2 expression via ILK, Akt, mTOR, and HIF-1 pathways in osteoblasts. Journal of Cellular Physiology. 2010;223(3):810–818. doi: 10.1002/jcp.22104. [DOI] [PubMed] [Google Scholar]
- 31.Xian L, et al. Matrix IGF-1 maintains bone mass by activation of mTOR in mesenchymal stem cells. Nat Med. 2012;18(7):1095–1101. doi: 10.1038/nm.2793. [DOI] [PMC free article] [PubMed] [Google Scholar]
- 32.Laplante M, Sabatini DM. An Emerging Role of mTOR in Lipid Biosynthesis. Current Biology. 2009;19(22):R1046–R1052. doi: 10.1016/j.cub.2009.09.058. [DOI] [PMC free article] [PubMed] [Google Scholar]
- 33.Kim JE, Chen J. Regulation of Peroxisome Proliferator–Activated Receptor-γ Activity by Mammalian Target of Rapamycin and Amino Acids in Adipogenesis. Diabetes. 2004;53(11):2748–2756. doi: 10.2337/diabetes.53.11.2748. [DOI] [PubMed] [Google Scholar]
- 34.Krebsbach PH, et al. Bone Formation in Vivo: Comparison of Osteogenesis By Transplanted Mouse and Human Marrow Stromal Fibroblasts. Transplantation. 1997;63(8):1059–1069. doi: 10.1097/00007890-199704270-00003. [DOI] [PubMed] [Google Scholar]
- 35.Sun H, et al. Regulation of Osteoblast Differentiation by Slit2 in Osteoblastic Cells. Cells Tissues Organs. 2009;190(2):69–80. doi: 10.1159/000178020. [DOI] [PubMed] [Google Scholar]
- 36.Bennett CN, et al. Regulation of osteoblastogenesis and bone mass by Wnt10b. Proceedings of the National Academy of Sciences of the United States of America. 2005;102(9):3324–3329. doi: 10.1073/pnas.0408742102. [DOI] [PMC free article] [PubMed] [Google Scholar]
- 37.Nicol CJ, et al. PPARγ influences susceptibility to DMBA-induced mammary, ovarian and skin carcinogenesis. Carcinogenesis. 2004;25(9):1747–1755. doi: 10.1093/carcin/bgh160. [DOI] [PubMed] [Google Scholar]
- 38.Rodda SJ, McMahon AP. Distinct roles for Hedgehog and canonical Wnt signaling in specification, differentiation and maintenance of osteoblast progenitors. Development. 2006;133(16):3231–3244. doi: 10.1242/dev.02480. [DOI] [PubMed] [Google Scholar]
- 39.Moitra J, et al. Life without white fat: a transgenic mouse. Genes Dev. 1998;12(20):3168–81. doi: 10.1101/gad.12.20.3168. [DOI] [PMC free article] [PubMed] [Google Scholar]
- 40.Bouxsein ML, et al. Guidelines for assessment of bone microstructure in rodents using micro–computed tomography. Journal of Bone and Mineral Research. 2010;25(7):1468–1486. doi: 10.1002/jbmr.141. [DOI] [PubMed] [Google Scholar]
- 41.Wan YH. PPAR gamma in bone homeostasis. Trends in Endocrinology and Metabolism. 2010;21(12):722–728. doi: 10.1016/j.tem.2010.08.006. [DOI] [PubMed] [Google Scholar]
- 42.Lecka-Czernik B. PPAR[gamma], an essential regulator of bone mass: Metabolic and molecular cues. IBMS BoneKEy. 2010;7(5):171–181. [Google Scholar]
- 43.Magri CJ, et al. Peroxisome proliferator-activated receptor-γ and the endothelium: implications in cardiovascular disease. Expert Review of Cardiovascular Therapy. 2011;9(10):1279–1294. doi: 10.1586/erc.11.140. [DOI] [PubMed] [Google Scholar]
- 44.Devlin MJ, Kawai M, Rosen CJ. Fat targets for skeletal health. Nature Reviews Rheumatology. 2009;5(7):365. doi: 10.1038/nrrheum.2009.102. [DOI] [PMC free article] [PubMed] [Google Scholar]
- 45.Wan Y, Chong L-W, Evans RM. PPAR-[gamma] regulates osteoclastogenesis in mice. Nat Med. 2007;13(12):1496–1503. doi: 10.1038/nm1672. [DOI] [PubMed] [Google Scholar]
- 46.Gerber H-P, Ferrara N. Angiogenesis and Bone Growth. Trends in Cardiovascular Medicine. 2000;10(5):223–228. doi: 10.1016/s1050-1738(00)00074-8. [DOI] [PubMed] [Google Scholar]
- 47.Rzonca SO, et al. Bone Is a Target for the Antidiabetic Compound Rosiglitazone. Endocrinology. 2004;145(1):401–406. doi: 10.1210/en.2003-0746. [DOI] [PMC free article] [PubMed] [Google Scholar]
- 48.Ali AA, et al. Rosiglitazone Causes Bone Loss in Mice by Suppressing Osteoblast Differentiation and Bone Formation. Endocrinology. 2005;146(3):1226–1235. doi: 10.1210/en.2004-0735. [DOI] [PubMed] [Google Scholar]
- 49.Pittenger MF, et al. Multilineage Potential of Adult Human Mesenchymal Stem Cells. Science. 1999;284(5411):143–147. doi: 10.1126/science.284.5411.143. [DOI] [PubMed] [Google Scholar]
- 50.Halade GV, et al. Obesity-mediated inflammatory microenvironment stimulates osteoclastogenesis and bone loss in mice. Experimental Gerontology. 2011;46(1):43–52. doi: 10.1016/j.exger.2010.09.014. [DOI] [PMC free article] [PubMed] [Google Scholar]
- 51.Luo X-H, et al. Adiponectin Stimulates RANKL and Inhibits OPG Expression in Human Osteoblasts Through the MAPK Signaling Pathway. Journal of Bone and Mineral Research. 2006;21(10):1648–1656. doi: 10.1359/jbmr.060707. [DOI] [PubMed] [Google Scholar]
- 52.Naveiras O, et al. Bone-marrow adipocytes as negative regulators of the haematopoietic microenvironment. Nature. 2009;460(7252):259–263. doi: 10.1038/nature08099. [DOI] [PMC free article] [PubMed] [Google Scholar]
- 53.Lecka-Czernik B, et al. Divergent Effects of Selective Peroxisome Proliferator-Activated Receptor-γ2 Ligands on Adipocyte Versus Osteoblast Differentiation. Endocrinology. 2002;143(6):2376–2384. doi: 10.1210/endo.143.6.8834. [DOI] [PubMed] [Google Scholar]
- 54.Shockley KR, et al. PPARγ2 nuclear receptor controls multiple regulatory pathways of osteoblast differentiation from marrow mesenchymal stem cells. Journal of Cellular Biochemistry. 2009;106(2):232–246. doi: 10.1002/jcb.21994. [DOI] [PMC free article] [PubMed] [Google Scholar]
- 55.Frost HM. Tetracycline-Based Histological Analysis of Bone Remodeling. Calcified Tissue Research. 1969;3(3):211. doi: 10.1007/BF02058664. [DOI] [PubMed] [Google Scholar]
- 56.Branda CS, Dymecki SM. Talking about a revolution: The impact of site-specific recombinases on genetic analyses in mice. Developmental Cell. 2004;6(1):7–28. doi: 10.1016/s1534-5807(03)00399-x. [DOI] [PubMed] [Google Scholar]
- 57.Payne JB, Golub LM. Using tetracyclines to treat osteoporotic/osteopenic bone loss: From the basic science laboratory to the clinic. Pharmacological Research. 2011;63(2):121–129. doi: 10.1016/j.phrs.2010.10.006. [DOI] [PMC free article] [PubMed] [Google Scholar]
Associated Data
This section collects any data citations, data availability statements, or supplementary materials included in this article.
Supplementary Materials
Supplementary Fig.1. Deletion of PPARγ in osteoblast increases mTOR signaling in vivo. The mTOR signaling in vivo was detected by staining the p-p70S6K. More positive stained (red) osteoblasts and oseocytes were observed in the KO mice compared with the control group (WT), while the hematopoietic tissues (bone marrow) were equally positively stained. The black arrows in the high power filed (right panel) indicated the osteoblasts lined on the new bone surface. Scale bar = 50μm (in low power filed, left panel). Scale bar = 25 μm (in high power filed, right panel).