

Abstract
Objective
A recent study of ill individuals with anorexia nervosa (AN) reported microstructural alterations in white matter integrity including lower fractional anisotropy and higher mean diffusivity. The present study was designed to determine whether such alterations exist in longterm recovered AN individuals and to examine potential associations with underlying AN traits.
Method
Twelve adult women recovered from restricting-type AN and 10 control women were studied using diffusion tensor imaging.
Results
Overall, there was no significant fractional anisotropy alteration in recovered AN, in contrast to a prior study reporting lower fractional anisotropy in ill AN. Further, recovered AN showed lower mean diffusivity in frontal, parietal and cingulum white matter relative to control women, contrary to elevated mean diffusivity previously reported in ill AN. Lower longitudinal diffusivity in recovered AN was associated with higher harm avoidance. However, more severe illness history was associated with worse white matter integrity after recovery in the same direction as reported in prior work.
Discussion
Our findings suggest that fractional anisotropy in recovered AN is not different from controls, however, a novel pattern of lower mean diffusivity was evidenced in recovered AN, and this alteration was associated with harm avoidance. Notably, severity of illness history may have long-term consequences, emphasizing the importance of aggressive treatment.
Keywords: eating disorders, anorexia nervosa, white matter, diffusion tensor imaging, harm avoidance, anxiety
Anorexia nervosa (AN) is a disorder of unknown etiology characterized by restricted eating, a relentless pursuit of thinness, and obsessive fears of becoming fat. The onset of AN tends to occur in early adolescence,1 during a critical period of physical and cognitive development. AN is associated with behavioral symptoms such as increased harm avoidance and anxiety which may reflect pre-existing traits that increase risk for developing AN, and these heightened symptoms tend to persist even after recovery.2
When malnourished and emaciated, ill individuals with AN have altered brain and peripheral organ function that is arguably more severe than in any other psychiatric disorder.2 The profound malnutrition that occurs, invariably during the critical developmental phase of adolescence, is known to have permanent effects, for example, disturbance of optimizing bone growth results in reduced bone mass that persists after recovery from AN.3 It also is well known that malnourished adolescent and adult AN have reduced global and regional gray matter and often white matter (WM) in the brain.4-7 Years of malnutrition may produce permanent or longterm alterations as WM continues to develop even into early adulthood8; 9, and AN individuals may be particularly susceptible because they avoid fats which may exaggerate lipid abnormalities. In addition, regression to pre-pubertal status is common with severe malnutrition10 and may confer added vulnerability as WM development is tightly coupled with pubertal stages.8 Little is known about the etiology of these brain changes, or their impact on symptoms or disease course.
Recent technology offers the opportunity to explore microstructural changes in WM by using diffusion tensor imaging (DTI). DTI measures tissue integrity by quantifying translational motion of water molecules and computes the diffusion rates along three principle axes. It therefore is especially sensitive to subtle changes in WM integrity where the fastest diffusion tends to be along highly directional myelinated tracts. One common measure of WM integrity is fractional anisotropy (FA), a scalar value of the degree of anisotropic/directional diffusion within the voxel; higher FA is thought to reflect better WM integrity as a result of greater axonal coherence, density or myelination.11; 12 Another is mean diffusivity (MD), which computes the average diffusion over all directions within the voxel; MD often correlates negatively with FA and is sensitive to myelin changes as well as variations in intra/extra cellular spaces.13
Using DTI, Kazlouski et al.11 was the first to report microstructural WM alterations in ill adult AN (both restricting and binge/purge AN subtypes). Compared to controls, ill AN showed lower FA and higher MD in fimbria-fornix, fronto-occipital and cingulum WM tracts, as well as higher MD in other frontal, parietal, occipital and temporal areas. Their findings are consistent with an animal model of dysmyelination,14 suggesting possible WM integrity deficits due to disrupted myelination in ill AN as a result of malnutrition. This study also found associations between worse WM deficits (lower FA and higher MD) and higher harm avoidance and trait anxiety, indicating that these heightened symptoms may be related to WM alterations in AN. Recently, Frieling et al.15 reported lower FA, particularly in the posterior thalamic radiation, and allude to alterations in MD within a combined group of ill and recovered AN individuals relative to controls; however, the combination of ill and recovered individuals may confound the effects of malnutrition, permanent damage, and underlying traits.
Teasing apart cause and consequence is a major methodological conundrum in studying AN. While observed disturbances in the ill state are likely heavily influenced by malnutrition, it is also possible that some may represent traits contributing to the development of this disorder.2 The choices to determine cause and effect in AN are limited. Premorbid studies are challenging because of the relative rarity of AN and the young age of onset, while longitudinal studies require long-term follow-up as recovery often takes many years and relapse rates are high. One strategy is to study AN after recovery using a cross-sectional design. Disturbances that are no longer evident after recovery are likely related to temporary effects of malnutrition. If alterations persist, they may represent long-term effects of malnutrition or, possibly, underlying trait factors. Further exploration of the relationship between alterations and illness severity as well as premorbid trait variables may help delineate trait factors from possible confounding effects of scars caused by chronic malnutrition.
The purpose of this study was to determine whether deficits in WM microstructure are present in women after long term recovery from restricting-type AN by comparing them to healthy control women. Findings from morphometric studies generally support the recovery of WM macrostructure (volume and density), hinting at the possibility of improved myelination with weight restoration. Cross-sectional comparisons have found no WM volume differences in recovered AN relative to healthy controls, even when only examining the restricting-AN subtype.4; 6; 7; 16 Longitudinal studies generally support within-participant normalization in WM volume following AN recovery, although findings are not consistent.4-6 Roberto et al.6, the largest longitudinal study (32 AN), found associations between increases in WM volume and increases in body mass index (BMI), strengthening evidence for WM recovery with weight restoration. Importantly, the degree of recovery and the AN subtype may influence the extent of normalization.
The present study used DTI to compare diffusivity measures along major WM fiber tracts between women recovered from restricting-type anorexia (REC AN) and control women (CW). We proposed that while overall diffusivity measures would be similar in REC AN and controls, given better nutrition and evidence for macrostructural WM recovery in REC AN, subtle alterations in tracts underlying an exaggerated dorsal cognitive control circuit 2 may remain evident in REC AN, reflecting trait-associated effects. Furthermore, to better understand WM integrity in relation to symptoms and course, we explored associations between WM diffusivity and severity of illness as indexed by lowest lifetime BMI and duration of illness. We expected that lower BMI and longer duration of illness would be associated with poorer levels of WM integrity (lower FA and higher MD) in REC AN, indicating either incomplete recovery of nutritive status or sustained permanent damage. In addition, we sought to replicate the Kazlouski et al.11 finding that worse WM deficits (lower FA and higher MD) were associated with harm avoidance behavior in AN.
Methods
Participants and clinical assessments
Twelve women who previously met criteria for restricting-type AN (defined by the 4th Edition of the Diagnostic and Statistical Manual of Mental disorders, DSM-IV) were recruited nationally through advertisements, and ten healthy comparison women (CW) were recruited through local advertisements (Table 1). All research was reviewed and approved by the UCSD Institutional Review Board. Participants underwent three levels of screening: (a) a brief telephone screen; (b) an extended interview to assess psychiatric history, lifetime weight, binge eating and methods of weight loss/control, menstrual cycle history, and eating patterns; (c) a comprehensive assessment using structured and semi-structured psychiatric interviews. To be considered “recovered” (REC AN), for the past twelve months, individuals had to (a) have not restricted food intake, exercised compulsively, or engaged in any other eating disorder behaviors; (b) have maintained a stable weight (+/- 3.0 kg) between 90% and 120% average body weight (c) have regular menstrual cycles. Exclusionary criteria for REC AN included: history of binging behavior; alcohol/drug abuse or dependence; use of any psychoactive medications such as antidepressants within three months prior to the study; or current diagnosis of an Axis I disorder. The comparison CW were carefully selected to have no history of an eating disorder and or any psychiatric, neurological, or severe medical illness.
Table 1.
Demographic and clinical variables. Values indicate mean (std. deviation), range, and median [interquartile range] for each variable as appropriate. Statistical comparisons were performed using Mann-Whitney U test.
| Control (CW) n=10* | REC AN n=12 | p | |
|---|---|---|---|
|
| |||
| Age | 26.7 (5.4) range 21-41 | 28.7 (7.9) range 19-40 | 0.50 |
| BMI | 22.0 (1.1) range 21-24 | 21.2 (1.5) range 19-24 | 0.18 |
| Trait anxiety* | 23.8 (3.5) range 20-29* 22 [20.5, 27.5] | 27.9 (8.3) range 21-48 24.5 [22.0, 33.5] | 0.18 |
| Harm avoidance* | 4.5 (3.5) range 0-10* 4.0 [1.3, 7.8] | 10.3 (5.9) range 2-23 9.5 [5.5, 14.0] | 0.02 |
| Age of onset | 15.5 (3.1) range 12-21 14.5 [13, 18.75] | ||
| Duration of illness (months) | 68 (62.5) range 12-240 48 [32, 176] | ||
| Low BMI | 15.0 (1.7) range 11-17 15.5 [14.4, 16.2] | ||
Note: for Trait Anxiety, Control n =9 and for Harm avoidance, Control n=8.
Clinicians with expertise in eating disorders administered psychiatric interviews. Either the Structured Clinical Interview for DSM-IV Axis I Disorders (SCID)17 or the MINI-International Neuropsychiatric Interview Plus (MINI) was used for co-morbid Axis I diagnoses18; our group transitioned from the SCID to the commonly used and more efficient MINI which has been carefully validated against the SCID.18 For all participants, a modified version of the Module H from the SCID was used to determine and characterize eating disorder diagnoses. This modified version maintained the integrity of the SCID Module H while including additional questions to more carefully characterize the eating disorder characteristics, such as more detailed weight history.
Additional behavioral assessments included: State-Trait Anxiety Inventory (STAI-Y) for trait anxiety;19 Temperament and Character Inventory (TCI) for harm avoidance;20 Frost Multidimensional Perfectionism Scale for perfectionism.21 All REC AN individuals completed these assessments; two CW participants were unable to complete the harm avoidance measure; and one CW participant was unable to complete the trait anxiety inventory.
Image acquisition
Imaging data were collected on a 3.0 Tesla Discovery MR750 scanner (GE Medical Systems) with an 8-channel phase-array head coil. DTI data was collected using a single-shot echo-planar imaging (EPI) sequence at 2.5 mm3 isotropic voxel resolution. Fifty-five diffusion sensitizing gradients (b value 1000 s/mm2) were applied,22 and five non-diffusion-weighted images (b=0) were collected. Other imaging parameters: TR=8500 ms, TE=83 ms, FOV=240 mm, acquisition matrix=96*96, slice thickness=2.5 mm, 60 AC-PC aligned oblique slices, double spin-echo acquisition to reduce eddy current effects. Parallel imaging using array spatial sensitivity encoding technique (ASSET) was applied with an acceleration factor of two.
Image processing and analysis
DTI images were processed using tools from the Diffusion Toolbox (FDT) (University of Oxford Centre for Functional MRI of the Brain, http://www.fmrib.ox.ac.uk/). All raw and diffusion tensor maps were visually inspected for data quality and artifacts, and quality was similar between groups. One REC AN case, not included in this sample, was excluded due to slice specific technical artifacts. Datasets were corrected for eddy current distortions and simple head motion using the Diffusion Toolbox's eddy_correct tool to align the volumes, and diffusion tensors were fitted to each voxel. Voxelwise maps of four primary DTI measures were generated: fractional anisotropy (FA), mean diffusivity (MD), longitudinal diffusivity (LD, the largest eigenvalue, representing diffusion parallel to fiber tracts), and radial diffusivity (RD, the mean of the second and third eigenvalues, representing diffusion perpendicular to fiber tracts). FA and MD are calculated using the LD and RD components of diffusivity.
Voxelwise analysis of diffusion indices were carried out following FSL's Tract Based Spatial Statistics (TBSS) pipeline.23 Native FA maps were non-linearly registered to FSL's FMRIB58_FA template, averaged, and “skeletonized” to derive a WM skeleton representing the center of tracts common to all participants. A threshold of FA=0.2 was used to restrict the skeleton to WM and exclude areas with high individual variability. Each participant's transformed FA map was then individually projected onto this common skeleton by filling each skeleton voxel with the maximum FA value found along the perpendicular tract direction. This accounts for residual misalignments and ensures each participant's FA skeleton captures the individual brain's WM tract centers. The derived registration and projection vectors were then applied to the other diffusion indices to generate corresponding MD, LD and RD skeletons.
Statistical analyses
Whole brain voxelwise group comparisons
Voxelwise comparisons of FA and MD skeletons were carried out using a nonparametric permutation-based algorithm as in FSL's randomise.24 Differences between REC AN and CW were tested using GLM models with age and current BMI as covariates, with 5000 permutations. Significant clusters were identified using the recommended threshold-free cluster enhancement method,25 at a threshold of p<.05 fully corrected for multiple comparisons across space using family-wise error (FWE).
Post-hoc region of interest analyses
Significant clusters identified in the voxelwise analyses of FA and MD were used as regions of interest (ROIs) for post-hoc testing. Binary masks of significant clusters were generated from the voxel-wise maps using FSL's cluster. Each ROI mask was applied to the skeleton to extract diffusivity data (FA, MD, LD and RD) (using fslstats). All post-hoc statistics were performed with JMP version 9 (SAS Institute, Inc., Cary, North Carolina).
First, we examined the individual contributions of the longitudinal (LD) and radial (RD) components, using a GLM model with age and current BMI as covariates. Second, we explored whether diffusion measures within the REC AN group were significantly related to clinical history and illness severity variables, such as age of onset, lowest BMI and duration of illness; age and current BMI were included as regressors. Third, we used partial correlation analyses to examine whether diffusion measures were associated with current BMI, within each group separately, while controlling for age. Finally, we used partial correlation analyses to examine whether diffusion measures were associated with harm avoidance or trait anxiety scores, within each group separately, while controlling for age and current BMI. The CW group was smaller for this association analysis due to missing data as noted in Table 1.
Results
Demographics and clinical assessments
There were no significant differences between groups in age, BMI or trait anxiety scores (Table 1). However, REC AN scored significantly higher on harm avoidance. Lifetime psychiatric history for REC AN included past (but not current) diagnoses of major depressive disorder (n=7), alcohol abuse/dependence (n=3), and drug abuse or dependence (n=3).
Whole brain voxelwise group comparisons
REC AN showed significantly lower MD (p <0.05, corrected for FWE) in frontal, parietal and cingulum WM tracts (Figure 1). Six clusters were identified (Supplementary Table): 1) Large left frontal network cluster including superior frontal WM, corona radiata (superior and posterior), corpus callosum (body and bilateral splenium) and posterior limb of internal capsule (Left_Frontal). 2) Left superior longitudinal fasciculus (Left_SLF). 3) Left posterior cingulum, precuneus WM and superior parietal WM (Left_pCing_Parietal). 4) Left dorsal Cingulum (Left_dCing). 5) Right precuneus WM and posterior corona radiata (Right_Precuneus). 6) Right posterior cingulum and posterior corona radiata (Right_pCing). No significant differences in FA were found between REC AN and CW.
Figure 1.

White matter clusters showing significantly lower mean diffusivity in REC AN in comparison to healthy controls from whole brain TBSS analysis (red-yellow, p<0.05 FWE-corrected). Green color depicts common white matter skeleton across all participants. Suprathreshold clusters were enlarged for visualization purposes using tbss_fill (part of FSL).
Post-hoc ROI analyses
The six clusters that showed significantly lower MD in REC AN were used as ROIs for further post-hoc analyses. Mean FA, MD, LD and RD values for each cluster were extracted.
Longitudinal and radial components in MD differences
In all clusters, while covarying for age and BMI, we found significantly lower LD and/or RD in REC AN compared to CW (Table 2). LD showed stronger group effects (i.e., larger t value) compared to RD in Left_Frontal, Left_pCing_Parietal and Right_Precuneus clusters.
Table 2.
Post-hoc comparisons of longitudinal (LD) and radial (RD) diffusivity components in clusters showing a significant mean diffusivity (MD) difference between REC AN and CW in whole brain TBSS analysis; statistics for post-hoc MD comparisons are shown as reference.
| Left_Frontal | Left _SLF | Left _pCing_Parietal | Left _dCing | Right_Precuneus | Right _pCing | |||||||
|---|---|---|---|---|---|---|---|---|---|---|---|---|
| t | p | t | p | t | p | t | p | t | p | t | p | |
|
| ||||||||||||
| MD | -5.12 | < 0.00001 | -4.02 | 0.0008 | -4.58 | 0.0002 | -3.50 | 0.0026 | -3.86 | 0.0012 | -3.73 | 0.0015 |
| LD | -5.99 | < 0.00001 | -3.24 | 0.0046 | -4.62 | 0.0002 | -1.89 | 0.0753 | -4.69 | 0.0002 | -2.40 | 0.0274 |
| RD | -2.71 | 0.0142 | -3.19 | 0.0050 | -1.91 | 0.0717 | -2.24 | 0.0381 | -1.88 | 0.0766 | -2.26 | 0.0363 |
Relationships between clinical variables and WM diffusivity within REC AN group
Using multiple regression models, five clusters showed some associations with current BMI, lowest BMI or duration of illness (Table 3). In general, lower current BMI was associated with higher MD and RD. Lowest BMI, i.e., worse malnutrition, was independently associated with lower FA and higher MD and RD. Longer duration of illness was associated with lower FA and higher RD.
Table 3.
Significant associations between diffusivity measures and clinical variables in REC AN.
| Left_Frontal | Left_SLF | Left_pCing_Parietal | Left_dCing | Right_pCing | |||||||
|---|---|---|---|---|---|---|---|---|---|---|---|
| t | p | t | p | t | P | t | p | t | p | ||
|
| |||||||||||
| FA | Current BMI | ||||||||||
| Lowest BMI | 3.36 | 0.02 | |||||||||
| Duration of illness | -2.44 | 0.05 | |||||||||
|
| |||||||||||
| MD | Current BMI | -2.64 | 0.04 | -3.12 | 0.02 | ||||||
| Lowest BMI | -2.80 | 0.03 | -2.41 | 0.05 | -3.17 | 0.02 | |||||
| Duration of illness | |||||||||||
|
| |||||||||||
| RD | Current BMI | -3.31 | 0.02 | ||||||||
| Lowest BMI | -3.53 | 0.01 | -2.43 | 0.05 | |||||||
| Duration of illness | 2.70 | 0.04 | |||||||||
Associations between current BMI and WM diffusivity within REC AN and CW groups
In REC AN, significant relationships between current BMI and WM diffusivity were found in four clusters (Table 4). Higher current BMI was associated with higher FA and lower MD, LD and RD. In contrast, current BMI was not significantly associated with diffusivity measures in CW.
Table 4.
Significant associations between diffusivity measures and current BMI in REC AN.
| Left_Frontal | Left_pCing_Parietal | Left_dCing | Right_pCing | |||||
|---|---|---|---|---|---|---|---|---|
| r | p | r | p | r | p | r | p | |
|
| ||||||||
| FA | 0.61 | 0.05 | ||||||
| MD | -0.60 | 0.05 | -0.63 | 0.04 | -0.61 | 0.04 | ||
| LD | -0.62 | 0.04 | ||||||
| RD | -0.75 | 0.01 | ||||||
Association between harm avoidance or trait anxiety and WM diffusivity within REC AN and CW groups
In REC AN, higher harm avoidance was associated with lower LD in three clusters (Figure 2): Left_Frontal (r =-0.74, p =0.01), Left_SLF (r =-0.69, p =0.03) and Right_Precuneus (r =-0.74, p =0.01). Although specific associations with MD were not significant, LD reflects diffusion parallel to the fiber tracts and is the largest contributing component of MD; lower LD reduces the value of MD. In CW, no significant relationships between harm avoidance and WM diffusivity were found. However, due to the small sample size, and the more restricted range of values in the CW group, these null findings should be interpreted with caution. No significant associations with trait anxiety were found in either group.
Figure 2.
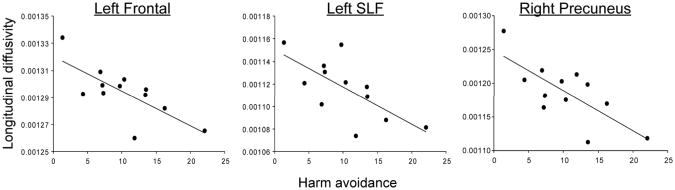
Associations between harm avoidance and longitudinal diffusivity in Left_Frontal (r= -0.74, p=0.01), Left_SLF (r=-0.69, p=0.03) and Right_Precuneus (r=-0.74, p=0.01) clusters in REC AN while controlling for the effects of age and current BMI.
Discussion
Our findings suggest that in individuals recovered from restricting-type AN, white matter integrity as measured by FA was not significantly different overall from controls, while mean diffusivity (MD) in fronto-parietal and cingulum WM was lower compared to controls. To the best of our knowledge, this is the first report of microstructural WM alterations in individuals recovered from restricting-type AN. The uncovered lower diffusivity in REC AN was related to harm avoidance. Moreover, preliminary evidence suggests that more severe illness history may be associated with residual worse WM integrity after recovery.
These findings are of interest in comparison to the Kazlouski et al. study reporting poor white matter integrity, reflected in lower FA and higher MD, for AN individuals in the ill state11. Instead, REC AN showed robust lower MD compared to controls in frontal, parietal and cingulum WM, as well as neighboring projection and callosal fiber tracts. Despite the opposing direction of the MD alteration, there is significant anatomical overlap between fiber tracts showing MD alterations in ill11 and REC AN. The Frieling et al.15 study of ill and REC AN also alludes to alterations in parietal diffusivity, although the direction of the effect is not reported. Localization of disturbances in frontal-parietal and cingulum WM suggests that these pathways, which are important for cognitive control,26 may be especially susceptible to core AN pathology. Indeed, other structural and functional studies of ill and REC AN have identified disturbances in these regions.2 The wider MD alterations reported in ill AN in fimbria-fornix, occipital and temporal lobes11 suggest that WM pathology may be more extensive during ill state due to the overwhelming effects of malnutrition.
Further examination revealed that the reported lower MD was impacted by changes in both longitudinal and radial components. Reductions in MD and radial diffusivity occur during normal development and WM maturation, which involves processes such as increased myelination, greater fiber packing and coherence.13 Although lower longitudinal diffusivity has been associated with acute axonal injury, primarily in animal models,27 other studies have found elevated longitudinal diffusivity in traumatic brain injury and neurodegeneration.14; 28 Therefore, taken together in the present study, lower longitudinal and radial diffusivity in REC AN may reflect reduced extra-axonal space due to greater packing and/or axonal caliber.
Although lower diffusivity in REC AN could reflect scarring related to malnutrition, neither lower BMI nor longer duration of illness (measures of malnutrition history) were associated with lower MD. In fact, similar to associations found in ill AN11, worse malnutrition (lowest lifetime BMI) remained associated with higher MD and radial diffusivity in several frontal-parietal and cingulum clusters. In addition, while FA was not significantly different for REC AN overall, worse malnutrition and longer duration of illness were associated with lower FA in the precuneus. These findings are in line with deficits reported in ill AN11 as well as an animal model of dysmyelination14, supporting the association between poor WM integrity (higher MD and lower FA) and the effects of malnutrition. Moreover, lower current BMI in REC AN was also related to worse WM integrity. Taken together, these associations suggest that malnutrition is not likely the basis for lower diffusivity in REC AN, but instead the association findings suggest potentially lasting effects of malnutrition on WM integrity and degree of recovery, with the need for aggressive treatment for weight restoration.
Another possible explanation of the lower diffusivity in REC AN, then, may be that it reflects a pre-existing trait in individuals at risk for AN. Although prospective studies are needed to definitively investigate this hypothesis, we explored the association between WM diffusivity and harm avoidance and trait anxiety, important behavioral symptoms in AN that persist even after recovery.2 During the ill state, harm avoidance and, to a lesser extent, trait anxiety, have been associated with worse WM deficits.11 In the current study of REC AN, higher harm avoidance was associated with lower longitudinal diffusivity, which contributes to lower MD, in several frontal and parietal clusters. Although the absolute direction of the associations differs from Kazlouski et al.11 (higher diffusivity reported during ill state relative to lower diffusivity in REC AN), higher harm avoidance was consistently associated with greater alterations relative to controls in both studies, suggesting a possible underlying trait associated with AN.
While a relationship between harm avoidance and lower diffusivity may seem puzzling in light of the association between illness severity and higher diffusivity, it is important to note that lower diffusivity in fronto-parietal areas associated with cognitive control has been linked to greater post-error slowing during response inhibition,29 which is postulated to reflect increased cognitive control and failure to disengage from a mistake.30 It is possible, then, that lower diffusivity in this sample may be associated with exaggeratedly enhanced cognitive control, and shed light on typical AN traits, such as an obsessive worry about consequences and fear of making mistakes2, and likely involve a distinct mechanism from the malnutrition burden driven association with illness severity. In support of this hypothesis, in REC AN only, harm avoidance was associated with the concern over mistakes subscale from the Frost Multidimensional Perfectionism Scale (r=0.72, p=0.009), which was in turn associated with lower longitudinal diffusivity in the same frontal-parietal clusters (Left_Frontal p=0.01, Left_SLF p=0.04, Right_Precuneus p=0.04). These findings complement a growing literature that supports an exaggerated fronto-parietal cognitive network in ill and recovered AN.31
The current study is limited by a small sample size and its cross-sectional nature. The samples were carefully recruited and screened for confounding conditions, and the REC AN individuals included only those with the restricting subtype to provide a precise comparison. While the small sample size requires that we interpret the lack of significant group differences in FA with caution, it is important to note that the reported effects of MD alterations were statistically robust. Furthermore, the significant MD effects were apparent in similar fiber tract areas relative to MD alterations reported in ill AN,11 and these areas emphasize the same pathways important for cognitive control 11; 26 that may be susceptible to core AN pathology. Our findings also reflect the use of a different methodological approach relative to prior studies, using a skeleton-based analysis with little spatial smoothing. Finally, there is the additional unknown impact of individual recovery trajectories. That is, not all individuals ill with AN will go on to recover successfully, and the REC AN cohort we studied may not reflect the entire population of individuals with AN. Future studies with larger sample sizes and longitudinal follow-up are needed to replicate and better understand these novel findings. Following AN individuals throughout their ill state and various points along their recovery trajectory would greatly strengthen our understanding of how active and historical illness impacts brain integrity and the trajectory of WM microstructural development. In addition, due to our deliberate focus on restricting-type anorexia in the present study, it will be important to explore whether similar relationships are present in women recovered from other subtypes of eating disorders.
In summary, the current study found that REC AN showed altered WM microstructure relative to controls in a pattern distinct from a prior report in ill AN11. The lower WM diffusivity observed in REC AN may be related to premorbid behavioral traits, in particular harm avoidance and heighted concern for mistakes, through a mechanism of exaggerated cognitive control. Although REC AN showed relatively more normal WM integrity overall, individual variability within the group presented evidence that more severe illness history was associated with worse WM integrity even at individuals' current state of recovery. This suggests that malnutrition during ill states may have long-term effects on WM health, emphasizing the importance of aggressive treatment for AN. Adequate treatment for AN is hindered by the lack of clinically available tools capable of assessing effects of malnutrition on brain function, and DTI may provide a measure to document physiological consequences of inadequate nourishment and weight restoration. Longitudinal studies are needed both to determine whether any deficits in WM integrity, such as those that remain associated with more severe illness history, are permanent or require a longer duration of recovery, as well as to more closely examine within subject associations between traits such as harm avoidance and brain structural integrity.
Supplementary Material
Acknowledgments
This work was supported by National Institute of Mental Health research grants (R01 MH042984 and R21 MH086017) and the Price Foundation.
Footnotes
Conflict of Interest: The authors report no conflict of interest.
References
- 1.American Psychiatric Association. Diagnostic and Statistical Manual of Mental Disorders. Washington D.C: American Psychiatric Association; 1994. [Google Scholar]
- 2.Kaye WH, Fudge JL, Paulus M. New insights into symptoms and neurocircuit function of anorexia nervosa. Nature reviews Neuroscience. 2009;10:573–584. doi: 10.1038/nrn2682. [DOI] [PubMed] [Google Scholar]
- 3.Mehler P, MacKenzie T. Treatment of osteopenia and osteoporosis in anorexia nervosa: a systematic review of the literature. Int J Eat Disord. 2009;42:195–201. doi: 10.1002/eat.20593. [DOI] [PubMed] [Google Scholar]
- 4.Castro-Fornieles J, Bargallo J, Lazaro N, Andres S, Falcon C, Plana M, et al. A cross-sectional and follow-up voxel-based morphometric MRI study in adolescent anorexia nervosa. J Psychiatr Res. 2009;43:331–340. doi: 10.1016/j.jpsychires.2008.03.013. [DOI] [PubMed] [Google Scholar]
- 5.Swayze VW, II, Andersen AE, Andreasen NC, Arndt S, Sato Y, Ziebell S. Brain tissue volume segmentation in patients with anorexia nervosa before and fter weight normalization. Int J Eat Disord. 2003;33:33–44. doi: 10.1002/eat.10111. [DOI] [PubMed] [Google Scholar]
- 6.Roberto C, Mayer L, Brickman A, Barnes A, Muraskin J, Yeung L, et al. Brain tissue volume changes following weight gain in adults with anorexia nervosa. Int J Eat Disord. 2011;44:406–411. doi: 10.1002/eat.20840. [DOI] [PMC free article] [PubMed] [Google Scholar]
- 7.Van den Eynde F, Suda M, Broadbent H, Guillaume S, Van den Eynde M, Steiger H, et al. Structural magnetic resonance imaging in eating disorders: a systematic review of voxel-based morphometry studies. Eur Eat Disord Rev. 2011;20:94–105. doi: 10.1002/erv.1163. [DOI] [PubMed] [Google Scholar]
- 8.Asato M, Terwilliger R, Woo J, Luna B. White matter development in adolescence: a DTI study. Cereb Cortex. 2010;20:2122–2131. doi: 10.1093/cercor/bhp282. [DOI] [PMC free article] [PubMed] [Google Scholar]
- 9.Lebel C, Walker L, Leemans A, Phillips L, Beaulieu C. Microstructural maturation of the human brain from childhood to adulthood. Neuroimage. 2008;40:1044–1055. doi: 10.1016/j.neuroimage.2007.12.053. [DOI] [PubMed] [Google Scholar]
- 10.Jayasinghe Y, Grover S, Zacharin M. Current concepts in bone and reproductive health in adolescents with anorexia nervosa. BJOG. 2008;115:304–315. doi: 10.1111/j.1471-0528.2007.01601.x. [DOI] [PubMed] [Google Scholar]
- 11.Kazlouski D, Rollin M, Tregellas J, Shott M, Jappe L, Hagman J, et al. Altered fimbria-fornix white matter integrity in anorexia nervosa predicts harm avoidance. Psy Res. 2011;192:109–116. doi: 10.1016/j.pscychresns.2010.12.006. [DOI] [PMC free article] [PubMed] [Google Scholar]
- 12.Le Bihan D. Looking into the functional architecture of the brain with diffusion MRI. Nat Rev Neurosci. 2003;4:469–480. doi: 10.1038/nrn1119. [DOI] [PubMed] [Google Scholar]
- 13.Beaulieu C. The basis of anisotropic water diffusion in the nervous system - a technical review. NMR Biomed. 2002;15:435–455. doi: 10.1002/nbm.782. [DOI] [PubMed] [Google Scholar]
- 14.Tyszka J, Readhead C, Bearer E, Pautler R, Jacobs R. Statistical diffusion tensor histology reveals regional dysmyelination effects in the shiverer mouse mutant. Neuroimage. 2006;29:1058–1065. doi: 10.1016/j.neuroimage.2005.08.037. [DOI] [PMC free article] [PubMed] [Google Scholar]
- 15.Frieling H, Fischer J, Wilhelm J, Engelhorn T, Bleich S, Hillemacher T, et al. Microstructural abnormalities of the posterior thalamic radiation and the mediodorsal thalamic nuclei in females with anorexia nervosa - A voxel based diffusion tensor imaging (DTI) study. Journal of psychiatric research. 2012;46:1237–1242. doi: 10.1016/j.jpsychires.2012.06.005. [DOI] [PubMed] [Google Scholar]
- 16.Joos A, Hartmann A, Glauche V, Perlov E, Unterbrink T, Saum B, et al. Grey matter deficit in long-term recovered anorexia nervosa patients. Eur Eat Disord Rev. 2011;19:59–63. doi: 10.1002/erv.1060. [DOI] [PubMed] [Google Scholar]
- 17.First M, Spitzer R, Gibbon M, Wiloliams J. Structured Clinical Interview for DSM-IV Axis I Disorders, research versin, patient edition. New York: Biometrics Research, New York State Psypchiatric Institute; 1997. [Google Scholar]
- 18.Sheehan DV, Lecrubier Y, Sheehan KH, Amorim P, Janavs J, Weiller E, et al. The Mini-International Neuropsychiatric Interview (M.I.N.I.): the development and validation of a structured diagnostic psychiatric interview for DSM-IV and ICD-10. The Journal of clinical psychiatry. 1998;59(20):22–33. quiz 34-57. [PubMed] [Google Scholar]
- 19.Spielberger CD, Gorsuch RL, Lushene RE. STAI Manual for the State Trait Anxiety Inventory. Palo Alto, CA: Consulting Psychologists Press; 1970. [Google Scholar]
- 20.Cloninger C, Przybeck T, Svrakic D, Wetzel R. The Temperament and Character Inventory (TCI): A guide to its development and use. 2, Chapter 4. St. Louis: 1994. [Google Scholar]
- 21.Frost RO, Marten P, Lahart C, Rosenblate R. The dimensions of perfectionism. Cognitive Therapy & Research. 1990;14:449–468. [Google Scholar]
- 22.Jones D, Horsfield M, Simmons A. Optimal strategies for measuring diffusion in anisotropic systems by magnetic resonance imaging. Magn Reson Med. 1999;42:515–525. [PubMed] [Google Scholar]
- 23.Smith S, Jenkinson M, Johansen-Berg H, Rueckert D, Nichols T, Mackay C, et al. Tract-based spatial statistics: voxelwise analysis of multi-subject diffusion data. Neuroimage. 2006;31:1487–1505. doi: 10.1016/j.neuroimage.2006.02.024. [DOI] [PubMed] [Google Scholar]
- 24.Nichols T, Holmes A. Nonparametric permutation tests for functional neuroimaging: a primer with examples. Hum Brain Mapp. 2002;15:1–25. doi: 10.1002/hbm.1058. [DOI] [PMC free article] [PubMed] [Google Scholar]
- 25.Smith S, Nichols T. Threshold-free cluster enhancement: addressing problems of smoothing, threshold dependence and localisation in cluster inference. Neuroimage. 2009;44:83–98. doi: 10.1016/j.neuroimage.2008.03.061. [DOI] [PubMed] [Google Scholar]
- 26.Bunge S, Wright S. Neurodevelopmental changes in working memory and cognitive control. Curr Opin Neurobiol. 2007;17:243–250. doi: 10.1016/j.conb.2007.02.005. [DOI] [PubMed] [Google Scholar]
- 27.Budde M, Xie M, Cross A, Song S. Axial diffusivity is the primary correlate of axonal injury in the experimental autoimmune encephalomyelitis spinal cord: a quantitative pixelwise analysis. J Neuroscience. 2009;29:2805–2813. doi: 10.1523/JNEUROSCI.4605-08.2009. [DOI] [PMC free article] [PubMed] [Google Scholar]
- 28.Kraus M, Susmaras T, Caughlin B, Walker C, Sweeney J, Little D. White matter integrity and cognition in chronic traumatic brain injury: a diffusion tensor imaging study. Brain. 2007;139:2508–2519. doi: 10.1093/brain/awm216. [DOI] [PubMed] [Google Scholar]
- 29.Fjell A, Westlye L, Amlien I, Walhovd K. A multi-modal investigation of behavioral adjustment: post-error slowing is associated with white matter characteristics. Neuroimage. 2012;61:195–205. doi: 10.1016/j.neuroimage.2012.03.007. [DOI] [PubMed] [Google Scholar]
- 30.Danielmeier C, Ullsperger M. Post-error adjustments. Front Psychol. 2011;2:233. doi: 10.3389/fpsyg.2011.00233. [DOI] [PMC free article] [PubMed] [Google Scholar]
- 31.Zastrow A, Kaiser S, Stippich C, Walthe S, Herzog W, Tchanturia K, et al. Neural correlates of impaired cognitive-behavioral flexibility in anorexia nervosa. Am J Psychiatry. 2009;166:608–616. doi: 10.1176/appi.ajp.2008.08050775. [DOI] [PubMed] [Google Scholar]
Associated Data
This section collects any data citations, data availability statements, or supplementary materials included in this article.