

Abstract
Alzheimer's disease (AD) and Lewy body diseases (LBD), e.g. Parkinson's disease (PD) dementia and dementia with Lewy bodies (DLB), are common causes of geriatric cognitive impairments. In addition, AD and LBD are often found in the same patients at autopsy; therefore, biomarkers that can detect the presence of both pathologies in living subjects are needed. In this investigation, we report the assessment of α-synuclein (α-syn) in cerebrospinal fluid (CSF) and its association with CSF total tau (t-tau), phosphorylated tau181 (p-tau181), and amyloid beta1-42 (Aβ1-42) in subjects of the Alzheimer's Disease Neuroimaging Initiative (ADNI; n=389), with longitudinal clinical assessments. A strong correlation was noted between α-syn and t-tau in controls, as well as in patients with AD and mild cognitive impairment (MCI). However, the correlation is not specific to subjects in the ADNI cohort, as it was also seen in PD patients and controls enrolled in the Parkinson's Progression Markers Initiative (PPMI; n=102). A bimodal distribution of CSF α-syn levels was observed in the ADNI cohort, with high levels of α-syn in the subjects with abnormally increased t-tau values. Although a correlation was also noted between α-syn and p-tau181, there was a mismatch (α-syn-p-tau181-Mis), i.e. higher p-tau181 levels accompanied by lower α-syn levels in a subset of ADNI patients. We hypothesize that this α-syn-p-tau181-Mis is a CSF signature of concomitant LBD pathology in AD patients. Hence, we suggest that inclusion of measures of CSF α-syn and calculation of α-syn-p-tau181-Mis improves the diagnostic sensitivity/specificity of classic CSF AD biomarkers and better predicts longitudinal cognitive changes.
Keywords: Alzheimer's disease, Parkinson's disease, dementia with Lewy body, Cerebrospinal fluid, Amyloid β, tau, α-synuclein
Introduction
Alzheimer's disease (AD) is the most common cause of aging related dementia. Clinically, it is characterized by a progressive cognitive decline that primarily affects memory and causes impairments in activities of daily living. Pathologically, AD is defined by the presence of amyloid-β (Aβ) plaques and neurofibrillary tangles in the brain [35], but the accuracy of the clinical diagnosis of AD verified at autopsy is ~90%, even in specialized centers [57,2]. Notably, diagnostic accuracy may be increased by analysis of key biomarkers in the cerebrospinal fluid (CSF) of AD patients, namely Aβ1-42, total tau (t-tau) and tau phosphorylated at residue 181 (p-tau181), as well as imaging studies [57]. Consequently, the most recent National Institute of Aging (NIA) research clinical diagnostic criteria for AD incorporate the use of these CSF biomarkers and positron emission tomography (PET) neuroimaging of Aβ [32], which show a good correlation with Aβ deposits in brain [58,24].
One of the major challenges in AD diagnosis is the common co-morbid presence of other neurodegenerative diseases such as Parkinson's disease (PD) [38,57,18], which cannot be accurately detected in living subjects with current CSF or imaging biomarkers. For example, clinical evidence of parkinsonism is often seen in AD patients and it is well established that up to 50% of familial and sporadic AD patients show evidence of Lewy bodies (LBs) upon autopsy [37,10,28]. Clinically, AD patients with concomitant LB pathology demonstrate accelerated cognitive decline [39,41]. In addition, AD pathology (i.e. amyloid plaques and neurofibrillary tangles) is frequently present in PD patients with dementia (PDD) [13,17] and in most dementia with Lewy body (DLB) cases [57].
Given the apparent overlapping pathology between AD and LBD, one would expect that the inclusion of LBD biomarkers markers with classic AD biomarkers will improve diagnostic assessment of cognitively impaired patients. To date, the most extensively tested CSF biomarker of LB pathology is α-synuclein (α-syn), the major building-block protein of LBs. In general, α-syn levels appear to be lower in PD and related LBD subjects compared to age-matched, healthy controls [12,51,33,19]. Although α-syn is best known for its involvement in PD's motor signs, several independent lines of evidence suggest that α-synmay also play a role in cognition. For example, α-syn positive cortical LBs are associated with dementia in PD [31,60,13]. In addition, increased brain levels of soluble α-syn have been found to correlate with cognitive impairment in AD [25]. The interest in α-syn in AD has been further developed by evidence suggesting that pathological α-syn might interact with Aβ and tau to promote their mutual aggregation, thereby amplifying neuronal damage [8,1,15,59] and accelerating cognitive decline [30,4]. The accumulation of α-syn alone has also been shown to significantly disrupt cognition in mice [4].
In the current investigation, we report the assessment of CSF α-syn and examine its association with CSF t-tau, p-tau181 and Aβ1-42 in the Alzheimer's Disease Neuroimaging Initiative (ADNI) cohort composed ofcontrol (CN), mild cognitive impairment (MCI), a prodromal phase of AD, and AD subjects, as well as in the Parkinson's Progression Markers Initiative (PPMI), composed of CN and PD subjects.
Methods
Subjects
Data used in the current study were downloaded on March 5th, 2013 from the ADNI database (adni.loni.ucla.edu). The ADNI has been described and extensively reviewed elsewhere ([65]; see also http://www.adni-info.org and supplementary methods). For the current study, 389 subjects (110 CN, 187 MCI, and 92 AD) in the ADNI-1 cohort [42] had α-syn measured in baseline CSF samples (Table 1). The same neuropsychological testing battery was applied to all ADNI subjects with visits scheduled every 12 months, except for the MCI subjects who had additional visits at 6 and 18 months after baseline assessment. The tests included in the neuropsychological battery are the Mini-Mental State Examination (MMSE), AD Assessment Scale-cognitive subscale (ADAS-Cog), clock drawing test, Rey Auditory Verbal Learning Test, Digit Span forward and backward, category fluency, trail making test, digit symbol substitution test, and Boston naming test. Although not performed at the baseline visit, the logical memory test was applied in subsequent visits. Further details are described in the ADNI procedures manual (http://adni.loni.ucla.edu/wp-content/uploads/2010/09/ADNIGeneralProceduresManual.pdf). We calculated z-scores for the short-term memory and executive domain based on stable CN subjects as detailed previously [58].
Table 1.
ADNI subjects included in the study
| CN (n=110) | MCI (n=187) | AD (n=92) | p-value | |
|---|---|---|---|---|
| Age at baseline (years)1 | 75.4 (5.2) | 74.0 (7.6) | 74.4 (7.7) | 0.24 |
| Gender (% male) | 50.9% | 66.8% | 56.2% | 0.02 |
| Education (years)1 | 15.7 (2.8) | 15.8 (3.0) | 15.0 (3.2) | 0.12 |
| MMSE1 | 29.1 (1.0) | 27.0 (1.8) | 23.6 (1.9) | <0.0001 |
| ADAS1 | 9.7 (4.2) | 18.6 (6.7) | 28.5 (8.5) | <0.0001 |
| Hemoglobin (Hgb) (ng/ml)2 | 42.4 (0.0–418.8) | 24.9 (0.0–477.7) | 87.5 (0.0–338.4) | 0.79 |
| Cases with Hgb above 200 ng/ml (% above 200 ng/ml) | 32.7% | 34.8% | 34.8% | 0.93 |
| α-Syn (ng/ml)2 | 0.46 (0.35–0.63) | 0.57 (0.41–0.77) | 0.63 (0.49–0.81) | 0.00004 |
| α-Syn (ng/ml)excluding subjects with high Hgb2 | 0.39 (0.34–0.39) | 0.50 (0.39–0.61) | 0.53 (0.41–0.69) | <0.0001 |
| CSF total proteins (mg/dL)2 | 43.5 (33.3–52.0) | 41 (34.5–54.0) | 43.5 (32.3–53.8) | 0.99 |
| α-Syn/total proteins ratio2 | 0.008 (0.008–0.016) | 0.013 (0.009–0.019) | 0.015 (0.010–0.021) | 0.0009 |
| α-Syn/total proteins ratio excluding subjects with high Hgb2 | 0.009 (0.007–0.012) | 0.011 (0.008–0.015) | 0.012 (0.010–0.031) | 0.0005 |
| Aβ1-42 (pg/ml)2 | 220.0 (159.0–253.0) | 146.0 (128.0–202.0) | 136.0 (120.8–160.5) | <0.0001 |
| T-tau (pg/ml)2 | 61.0 (48.0–86.0) | 87.0 (65.0–122.0) | 110.5 (81.0–153.0) | <0.0001 |
| P-tau181 (pg/ml)2 | 20.0 (16.0–29.0) | 31.5 (21.0–45.0) | 36.0 (29.0–49.0) | <0.0001 |
Mean (standard deviation)
Median (1st quartile–3rd quartile)
A second cohort included subjects from the PPMI cohort. Briefly, PPMI is designed to identify PD progression biomarkers and is conducted at 24 American, Australian, and European sites [55,29] (http://www.ppmi-info.org/study-design/). The study is approved by the Institutional Review Board of all participating sites and written informed consent was obtained from all participants. The data set used here was downloaded from the PPMI database on March 15th, 2013. Of note for the current study, only 39 CN and 63 PD subjects with CSF α-syn, t-tau, p-tau181 and Aβ1-42 levels available were included. Also, fourclinical PD subjects without evidence of dopamine transporter (DaT) deficit (SWEDD) on DaT scan were excluded from the analysis (Table 2).
Table 2.
PPMI subjects included in the study
| CN (n=39) | PD (n=63) | p-value | |
|---|---|---|---|
| Age at baseline1 (years) | 58.4 (13.1) | 61.8 (10.1) | 0.24 |
| Gender (% male) | 53.8 | 61.9 | 0.42 |
| Education (years)1 | 16.8 (2.4) | 16.4 (2.5) | 0.15 |
| Disease duration1 | - | 0.6 (0.8) | - |
| MDS-UPDRS III motor score1 | 1.6 (2.7) | 22.6 (7.6) | <0.0001 |
| MoCA1 | 28.4 (0.96) | 27.1 (2.1) | 0.001 |
| Hemoglobin (ng/ml)2 | 0.0 (0.0–83.1) | 22.4 (0.0–345.1) | 0.056 |
| Cases with Hg above 200 ng/ml (% above 200 ng/ml) | 15.4% | 28.6% | 0.20 |
| α-Syn (ng/ml)2 | 1.30 (0.95–1.64) | 0.95 (0.66–1.35) | 0.012 |
| Aβ1-42 (pg/ml)2 | 256.0 (226.5–270.5) | 228.7 (204.5–257.0) | 0.046 |
| T-tau(pg/ml)2 | 50.0 (38.0–68.5) | 40.0 (27.0–62.0) | 0.0026 |
| P-tau181 (pg/ml)2 | 22.0 (19.0–28.5) | 19.0 (15.0–25.5) | 0.0091 |
Mean (standard deviation)
Median (1st quartile–3rd quartile)
MoCA: Montreal Cognitive Assessment
CSF collection and biomarker measurement
For the ADNI cohort, baseline CSF samples were obtained in the morning after an overnight fast. Lumbar puncture was performed with a 20- or 24-gauge spinal needle as described previously [49] (see ADNI procedures manual (http://www.adni-info.org/and supplementary material). For the PPMI subjects, procedures followed the instructions detailed in the PPMI procedures manual (http://www.ppmi-info.org/, see supplementary material) as reviewed previously [19].
For both cohorts, Aβ1-42, t-tau and p-tau181 were measured using the xMAP Luminex platform (Luminex Corp, Austin, TX) with Innogenetics (INNO-BIA AlzBio3; Ghent, Belgium; for research use-only reagents) immunoassay kit-based reagents. The capture monoclonal antibodies used were 4D7A3 for Aβ1-42, AT120 for t-tau and AT270 for p-tau181. The analyte-specific detector antibodies were HT7 and 3D6. Innogenetics AlzBio3 intra-assay variability is < 4 %, inter-assay variability is < 10 % [40] and lower limit of quantification (LLOQ) is 30–40 pg/ml for t-tau, 20–50 pg/ml for Aβ1-42 and 8–10 pg/ml for p-tau181 [62]. Further details are described in Shaw et al [49,50]. For the α-syn assay in the ADNI cohort, Luminex MicroPlex Microspheres (Luminex Corp, Austin, TX) were chemically coated with rabbit anti-α-syn antibody, ASY-1 [27,7]. A biotinylated goat anti-human α-syn antibody (R&D systems, Minneapolis, MN, USA) was used as the detection antibody. The α-syn Luminex assay applied in the ADNI cohort demonstrated low day-to-day as well as plate-to-plate signal variability (< 5% with > 80 plates analyzed), with high signal reproducibility and linear performance in the low pg range (the LLOQ is 9.0 pg/mL). Accuracy for the assay, as determined by recovery of spiked α-syn, was ~93 % [12]. A detailed protocol can be downloaded from the ADNI website. Also, since α-syn is abundant in red blood cells (RBC) and release of the protein from lysed RBC in CSF may confound interpretation of α-syn levels, hemoglobin (Hgb) was measured in each CSF sample to monitor CSF contamination by RBC [12,19]. For this purpose, we used a human hemoglobin ELISA quantitation kit from Bethyl Lab Inc (Montgomery, TX, USA), which has sensitivity well beyond our cut-off value of 200 ng/ml (assay range 6.25 – 400 ng/ml). Samples were run in duplicate, with CVs in the < 10 % range, and samples with CV ≥ 20 % were rerun. In the PPMI cohort, CSF α-syn was analyzed at Covance using a commercially available ELISA assay kit (Covance, Dedham, MA) [33,34], as described previously [19] (also see supplementary material). The α-syn ELISA assay used in the PPMI showed a mean CV for duplicates of α-syn measurements of 6.0% (range: 0.8%–13.2%) for 102 CSF sample and the LLOQ is 6.1 pg/mL.
Statistical Analysis
For the analyses included in Table 1 and Table 2, one way ANOVAs were used for quantitative normally distributed variables. For non-normally distributed quantitative variables, Kruskall-Wallis and rank-based two way methods were used. Chi-square tests were applied for qualitative variables. Due to the heterocedasticity of the cognitive tests in different cognitive groups, a robust test (percentile bootstrap one-step M-estimator) was used to compare the different groups [66]. For further analyses, distributions of the variables and residuals were tested and power transformations applied as needed. Based on data from previous studies [12,20], we selected 200 ng/ml Hgb in CSF as the cut-off to exclude cases in which interpretation of α-syn might be confounded by RBC contamination of CSF samples. Association between biomarkers in covariate-adjusted models was tested using linear regression models. Partial correlation (rpc) was obtained in these adjusted models. Distribution of residuals and absence of multicollinearity was tested in these models (Variance inflation factor <4).
A logistic regression analysis was applied for classification of CN against AD and MCI subjects for each of the studied CSF biomarkers. Importantly, in biomarker research, classifiers, especially when multiple markers are included, while fitting well in the studied population, might work poorly in an independent cohort. This is largely due to the fact that the classifier(s) may also be fitting the noise that is characteristic to the studied samples, a phenomenon referred to as “overfitting”. To avoid this potential problem, the subjects were randomly divided into discovery (70%) vs. validation (30%) sets. To train a classifier (discovery set) and cross-validate the cutoffs in the discovery set, the subjects were further randomly split 10 times to form training (70%) vs. test (30%) sets. The cutoffs of the model were selected in the discovery set using accuracy and kappa index as performance metrics [63,22]. The obtained logistic regression model was then applied to the validation set and sensitivity, specificity and the area under the curve (AUC) in the receiver operating characteristic (ROC) curve were obtained [45].
The mismatch between the expected α-syn levels with respect to p-tau181 levels (α-syn-p-tau181-Mis) was calculated as the standardized residual of the linear regression model that predicted α-syn based on p-tau181, adjusted for Hgb in the whole ADNI cohort. We hypothesized that decreasing α-syn values would represent increasing LBD pathology (i.e. decreased α-syn levels relative to elevated p-tau181 values).
A Cox hazards model, with age, gender and education as covariates, was used to study the conversion of MCI to AD for the different CSF biomarkers studied here. Standardized values (mean=0, standard deviation=1) were used for the biomarker values in order to compare the effect size of the association. We analyzed different quantitative outcome measures longitudinally using mixed-effects models [23,43] to assess their association with the CSF biomarkers studied. Two random effects were included: an intercept and follow-up time measured in weeks. Age, gender and clinical diagnosis at baseline were included in the model as fixed effects. In addition, in the first model the t-tau/Aβ1-42 ratio, the α-syn/Aβ1-42 ratio and the combination of the t-tau/Aβ1-42 ratio with α-syn or α-syn-p-tau181-Mis were included as fixed effects in different models. An interaction between time and clinical diagnosis, and time and CSF biomarker ratio was also included. Statistical tests were two-sided and significance was set at p< 0.05. In the case of multiple comparisons, Benjamini-Hochberg correction for multiple comparisons was applied. Analyses were performed using R v. 2.15.3 [44]. Notably, besides the analysis of the demographic and biomarker variables in Table 2, the only analyses performed in the PPMI cohort involved the association between t-tau and α-syn (summarized in Fig. 1h), and the association of α-syn with age or gender. All other analyses described were performed in the ADNI cohort.
Fig. 1.

Display of Hgb and α-syn levels with both axes square-rooted (a). Display of α-syn levels on the y-axis and Aβ1-42 (b), t-tau (c) and p-tau181 (d) on the x-axis. Display of age against adjusted α-syn levels, after regressing out t-tau, (e). Display of t-tau and p-tau181 on the x- and y-axis respectively; α-syn levels are represented using a color scale with violet indicating lower α-syn levels and red indicating higher α-syn levels, (f). Histogram showing the distribution of α-syn levels stratified by AD based cut-offs for Aβ1-42 and t-tau, (g). T-tau and α-syn CSF levels in CN (red) and PD (blue) PPMI subjects and their regression lines, (h). Box plots showing the distribution of α-syn levels based on clinical diagnosis and CSF based groups, (i)
Results
Demographics and hemoglobin
A total of 389 ADNI and 102 PPMI subjects who had values for CSF α-syn, Aβ1-42, t-tau and p-tau181 were included in the current study. Clinical and demographic characteristics of the studied subjects are summarized in Table 1 and 2, respectively. ADNI clinical groups differed in gender, MMSE, ADAS-Cog, Aβ1-42, t-tau, and p-tau181. Initial description of clinical characteristic and alterations in CSF α-syn, Aβ1-42, t-tau, and p-tau181 for PPMI CN subjects and levodopa therapy naïve PD patients are reported separately [19].
Among the 389 ADNI subjects with CSF α-syn measurements, 34.2% were shown to have high CSF Hgb levels (> 200 ng/ml). Consistent with earlier reports [12,51,20], there was a significant association between CSF α-syn and Hgb levels (Fig. 1a) and therefore, subjects with high Hgb levels above the 200 ng/ml cutoff value were excluded, resulting in a total of 256 subjects who were available for further analyses. In the PPMI cohort, the correlation between Hgb and α-syn was also significant as described previously [19]. Consequently, 6 CN and 18 PD with Hgb levels > 200 ng/ml were excluded from the analysis. Remarkably, α-syn values of the included subjects (Hgb <200 ng/ml) in the ADNI cohort clearly showed a bimodal distribution with a right-sided skew (Supplementary Fig. 1).
Correlation of CSF α-syn with CSF tau and Aβ1-42
When CSF α-syn levels were analyzed in relationship to CSF tau species and Aβ1-42 using an age and gender adjusted model (Fig. 1b–d), there was a strong association with t-tau (t=18.7, p<0.0001, rpc=0.76), a slightly weaker association with p-tau181 (t=13.9, p<0.0001, rpc=0.66), and a much weaker association with Aβ1-42 (t=−2.6, p=0.009, rpc=−0.17). CSF t-tau levels remained significantly associated with CSF α-syn measures when adjusted for Aβ1-42 (t=18.8, p<0.0001), including those with normal Aβ1-42 levels (t=5.3, p<0.0001), or p-tau181 (t=8.3, p<0.0001) (Fig. 1f).
To further investigate the relationship between α-syn and classical AD markers, using the cutoffs of CSF Aβ1-42 and t-tau values established previously [49], the entire ADNI cohort, regardless of clinical diagnosis, was classified into three groups: 1) abnormally increased t-tau independent of Aβ1-42 values (n=101), 2) abnormally decreased Aβ1-42 with normal t-tau values (n=76), and 3) a non-AD-like CSF profile of t-tau and Aβ measures (n=76). Remarkably, the bimodal distribution observed for CSF α-syn values was highly correlated with two distinct categories based on t-tau levels (Supplementary Fig. 1). Specifically, the group with higher α-syn values (centered on 0.56 ng/ml) overlapped largely with the group with abnormally high levels of CSF t-tau, which is part of the AD CSF signature (Fig. 1g) as previously reported [49]. In contrast, the group with lower CSF values of α-syn (centered on 0.35 ng/ml) overlapped essentially with the cases without abnormally high CSF t-tau (Fig. 1g). Thus, it is important to emphasize that a subject with a clinical diagnosis of dementia of the AD type does not always demonstrate AD pathology at autopsy. It is those patients with CSF signatures of AD, especially increased tau and p-tau181, who are most likely to be confirmed with classic AD pathology at autopsy.
To examine the specificity of the association of α-syn with t-tau, we next explored the relationship between these two CSF biomarkers in CN subjects and in patients with PD, a different class of neurodegenerative disorder, enrolled in the PPMI study, where cognitive impairment at baseline is an exclusion criterion. Despite the fact that α-syn was measured by a different technology platform, the strong correlation between α-syn and t-tau and p-tau181 remained as reported previously [19]. Also noted is that this association was shifted down in PD subjects (t-tau: t=−2.1, p=0.0039; p-tau181: t=−2.0, p=0.052) (Fig. 1h). Furthermore, as reported by other groups [51,12,19], α-syn levels were lower in PD subjects compared to CN (t=−2.1, p=−.039), indicating that the presence of LBD decreases CSF α-syn levels (Supplementary Fig. 2). On the other hand, in sharp contrast to AD cases, CSF t-tau and p-tau181 levels are lower in PD compared to CN [19], indicating that the presence of LBD decreases CSF α-syn levels regardless of t-tau levels.
In the ADNI cohort, it was also apparent that some cases demonstrated higher p-tau181 with accompanying lower α-syn (Fig. 1d). This observation led us to hypothesize that a mismatch (α-syn-ptau181-Mis) between the expected CSF α-syn levels with respect to the CSF p-tau181 levels would be observed in AD cases with concomitant LB pathology. By this calculation, values below 0 would indicate low α-syn levels and values above 0 would indicate high α-syn levels. A total of 101 patients in the ADNI cohort (69 MCI and 32 AD) had a negative α-syn-p-tau181-Mis, which we hypothesize is a marker of the presence of concomitant LB pathology in the brains of these subjects. Of note, in the ADNI cohort analyzed currently, two cases have autopsy results available. Both had LB pathology in addition to a diagnosis of AD (Braak stage V and CERAD C). Interestingly, the α-syn-p-tau181-Mis for these two cases was −0.79 and −2.75, which, though quite preliminary with only two cases analyzed, supports the value of α-syn-p-tau181-Mis as a surrogate marker of LB pathology in subjects with clinical dementia of the AD type.
Demographic variables, association with APOE and diagnostic sensitivity and specificity
As previously reported [20], after controlling for age, gender, and APOE genotype, the different clinical diagnoses showed an association with CSF α-syn levels (MCI: t=2.4, p=0.0016, AD: t=4.6, p<0.0001). Curiously, the association was not significant once the presence of abnormal t-tau values was included in the model (MCI: t=0.23, p=0.08, AD: t=1.3, p=0.18, Fig. 1i). On the other hand, while age-dependence was not appreciable without t-tau, an association between increasing age and α-syn levels (t=2.4, p=0.016, Fig. 1e) was discovered when t-tau was included in the model. Similarly, although no gender effect was observed in each diagnostic category, female patients showed lower levels of α-syn (compared to males) when the analysis was adjusted for t-tau levels (t=−2.1, p=0.034). Notably, in the PPMI cohort, there was no association between α-syn and gender (p=0.29) or age (p=0.40) in the analysis, whether adjusted for t-tau levels and clinical diagnosis or not. This agrees with what has been reported previously in PPMI subjects [19].
With respect to the bimodal distribution of CSF α-syn levels in relationship to clinical diagnosis (Fig. 1i), CN with normal CSF Aβ1-42 and t-tau values had lower α-syn levels than MCI and AD subjects with abnormal CSF Aβ1-42 and t-tau measures (t=−7.0, p<0.0001 and t=−7.3, p<0.0001 respectively). Conversely, there was a trend for CN with abnormal Aβ1-42 and t-tau to have higher levels of α-syn than MCI with normal Aβ1-42 and t-tau (t=2.0, p=0.059), indicating that subjects with underlying AD pathology as defined by an abnormal CSF profile of Aβ1-42 and t-tau have increased CSF α-syn values, even when they are clinically asymptomatic.
It has been demonstrated that the APOE ε4 allele is strongly associated with an increased risk for AD. However, in this cohort, an association between APOE ε4 and α-syn levels was not observed, with or without factoring in Aβ1-42 and tau species (data not shown).
We then tested if classifiers including CSF α-syn or α-syn-p-tau181-Mis could improve the classification of AD or MCI versus CN subjects based on the t-tau/Aβ1-42 ratio that is widely used as a CSF biomarker for classification of AD versus CN. In a predefined discovery-validation paradigm, this CSF biomarker classifier was trained and tested in one set of subjects and then validated in an independent sample set comprised of unused subjects. The panel of CSF biomarkers that best classified AD against CN with the highest sensitivity was the combination of the t-tau/Aβ1-42 ratio and α-syn [Sensitivity (Se): 75.0%; Specificity (Sp):85.2%], whereas the highest specificity was obtained with the panel consisting of the t-tau/Aβ1-42 ratio and α-syn-p-tau181-Mis (Se: 70.0%; Sp: 88.9%) (Table 3, Fig. 2). Similarly, for classification of MCI against CN, the t-tau/Aβ1-42 ratio and α-syn-p-tau181-Mis offered the best results, although all combinations offered low specificity (Se: 85.0%; Sp: 46.2%) (Table 3, Fig. 2).
Table 3.
Area under the curve (AUC), sensitivity and specificity of the different biomarkers for the classification of AD against CN and MCI progressors against MCI stable
| AD against CN | MCI progressors against MCI stable | |||||
|---|---|---|---|---|---|---|
| Sensitivity | Specificity | AUC | Sensitivity | Specificity | AUC | |
| T-tau /Aβ1-42 | 70.0% (45.7–88.1%) | 81.5% (61.9–93.7%) | 0.81 (0.67–0.95) | 80.0% (56.3–94.3%) | 46.2% (19.2–74.9%) | 0.56 (0.33–0.79) |
| α-Syn/Aβ1-42 | 65.0% (40.8–84.6%) | 85.2% (66.3–95.8%) | 0.80 (0.66–0.94) | 100.0% (83.3–100.0%) | 0.0% (0.0–24.7%) | 0.59 (0.37–0.80) |
| T-tau /Aβ1-42, α-Syn | 75.0% (50.9–91.3%) | 85.2% (66.3–95.8%) | 0.84 (0.70–0.97) | 85.0% (62.1–96.8%) | 38.5% (13.9–68.4%) | 0.56 (0.33–0.80) |
| T-tau /Aβ1-42, α-Syn-p-tau181-Mis | 70.0% (45.7–88.1%) | 88.9% (70.8–97.6%) | 0.83 (0.69–0.96) | 85.0% (62.1–96.8%) | 46.2% (19.2–74.9%) | 0.61 (0.38–0.84) |
Value (95% confidence interval)
Fig. 2.
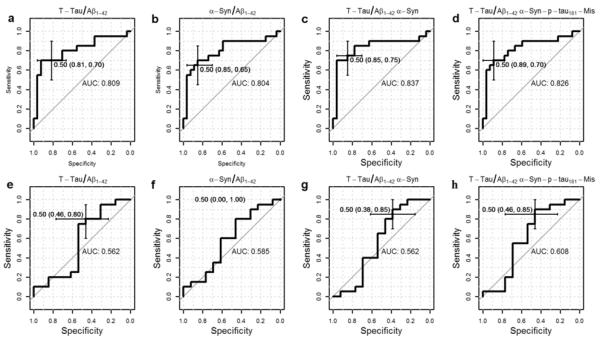
Receiver operating charts (ROC) showing area under the curve (AUC), specificity and sensitivity of t-tau/Aβ1-42 (a), α-syn/Aβ1-42 (b), t-tau/Aβ1-42 and α-syn (c), and α-syn-p-tau181-Mis and t-tau/Aβ1-42 (d) in classifying CN against AD. ROC for t-tau/Aβ1-42 (e), α-syn/Aβ1-42 (f), t-tau/Aβ1-42 and α-syn (g), and t tau/Aβ1-42 and α-syn-p-tau181-Mis (h) for the classification of CN against MCI.
Association of CSF biomarkers with clinical outcomes assessed longitudinally in the ADNI cohort
Of the 76 CN, 17 converted to MCI, two converted to dementia, one with a diagnosis of AD and the other with a non-AD dementia diagnosis. Among 122 MCI subjects, 61 subjects converted to AD at follow-up (median follow-up for MCI 158.9 weeks; for MCI stable 157.1 weeks and for MCI progressors 174.6 weeks). To focus on the set with a sufficient number of conversions for analysis (i.e. MCI to AD), a Cox hazards model was used with adjustment for age, gender, and education. The standardized t-tau/Aβ1-42 ratio (Fig. 3a; HR=1.31, p=0.045) was significantly associated with conversion of MCI subjects to dementia of the AD type, and the standardized α-syn values alone or in combination with the t-tau/Aβ1-42 ratio did not improve the performance of t-tau/Aβ1-42 ratio (HR=0.089, p=0.08). However, decreasing CSF α-syn-p-tau181-Mis was significantly associated with increased conversion to AD in the t-tau/Aβ1-42 ratio adjusted model (Fig. 3b; HR=0.74, p=0.023) and adding α-syn-p-tau181-Mis slightly enhanced the performance of t-tau/Aβ1-42 ratio [13](HR=1.40, p=0.019).
Fig. 3.
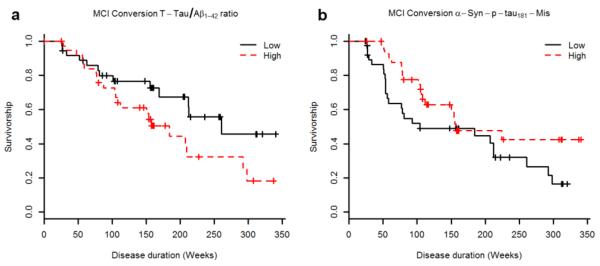
Survival function for the cox hazards model analyzing the progression of MCI to AD in the age, gender, and education adjusted model for t-tau/Aβ1-42 (a) and α-syn-p-tau181-Mis, including t-tau/Aβ1-42 as a covariate (b). Although the variables examined here were treated as quantitative in the analysis, the graphs represent the extreme tertiles for ease of visual representation.
Next, we tested the association between the baseline CSF biomarkers studied here and longitudinal clinical measures in the ADNI cohort, using a mixed-effects model adjusted for age, gender, diagnosis at baseline, and education (Table 4). Increased CSF α-syn/Aβ1-42 and t-tau/Aβ1-42 ratios were clearly associated with a decline/worsening of ADAS-Cog, CDR, short-term and working memory and executive function during follow-up and the t-tau/Aβ1-42 ratio was also associated with worse baseline ADAS-Cog and short term and delayed memory scores (Table 4). When CSF α-syn and/or the α-syn-p-tau181-Mis was tested in the model, low values in either of the α-syn measures were associated with a worse cognitive outcome, with α-syn-p-tau181-Mis generally showing a stronger association. As shown in Fig. 4 and Table 4, a more negative CSF α-syn-p-tau181-Mis value (a hypothesized surrogate marker of concomitant LB pathology) showed increasing trend of faster longitudinal decline, especially in executive function, working memory and short term memory, even for the cases with normal Aβ1-42 values (Fig. 4). Moreover, inclusion of α-syn-p-tau181-Mis increased the association of the t-tau/Aβ1-42 ratio with all cognitive changes as observed previously in the model that studied the conversion from MCI to AD (data not shown). Finally, low α-syn-p-tau181-Mis was associated with higher (i.e. worse) baseline ADAS-Cog.
Table 4.
Association of α-syn/Aβ1-42 and t-tau/Aβ1-42 with longitudinal neuropsychological and severity measures in age, gender, clinical diagnosis and education adjusted analyses in the whole sample
| α-Syn/Aβ1-42 | T-tau/Aβ1-42 | α-Syn1 | α-Syn-p-tau181-Mis1 | |||||
|---|---|---|---|---|---|---|---|---|
| Baseline | Longitudinal Change | Baseline | Longitudinal Change | Baseline | Longitudinal Change | Baseline | Longitudinal Change | |
| ADAS-Cog | t=1.6; p=0.30 | t=3.3; p=0.003 | t=3.7; p=0.004 | t=6.3; p<0.0001 | t=−3.3; p=0.11 | t=−3.5; p=0.002 | t=−2.8; p=0.032 | t=−4.5; p<0.0001 |
| CDR | t=−0.64; p=0.66 | t=4.6; p<0.0001 | t=0.08; p=0.97 | t=6.9; p<0.0001 | t=−1.3; p=0.34 | t=−3.1; p=0.005 | t=−1.5; p=0.30 | t=−2.9; p=0.006 |
| Short term memory | t=−1.2; p=0.34 | t=−3.2; p=0.004 | t=−2.8; p=0.031 | t=−4.4; p<0.0001 | t=1.6; p=0.30 | t=1.9.; p=0.08 | t=1.2; p=0.34 | t=2.8.; p=0.009 |
| Delayed memory | t=−2.9; p=0.18 | t=−1.5; p=0.14 | t=−3.8; p=0.004 | t=−1.8; p=0.08 | t=0.57; p=0.69 | t=1.4; p=0.16 | t=0.03; p=0.97 | t=1.82; p=0.08 |
| Executive function | t=−0.5; p=0.71 | t=−2.7; p=0.011 | t=−1.5; p=0.30 | t=−4.7; p<0.0001 | t=1.8; p=0.30 | t=2.6; p=0.014 | t=2.2; p=0.14 | t=3.0; p=0.006 |
| Working memory | t=−1.3; p=0.34 | t=−1.1; p=0.27 | t=−1.1; p=0.38 | t=−2.3; p=0.034 | t=−0.23; p=0.92 | t=2.1; p=0.049 | t=0.31; p=0.85 | t=2.7; p=0.011 |
T-tau/Aβ1-42 was included in this model as a covariate
All the p-values are adjusted for multiple comparisons
Fig. 4.

Longitudinal cognitive changes for MCI subjects with standardized short term memory (a), delayed memory (b), executive function (c), and working memory (d) scores represented in the y-axis and the follow-up time represented in the x-axis. Predicted values for MCI subjects with low (circle, −0.72), middle (triangle, −0.15), or high (square, 0.40) α-syn-p-tau181-Mis based on the model that includes all subjects (in red) and on the model that includes only subjects with normal Aβ1-42 levels (in blue, Aβ1-42 at baseline > 192 pg/mL) are represented in each graph.
Given the bimodal distribution of CSF α-syn levels discussed above, we also studied the subjects with normal baseline CSF Aβ1-42 levels to see if α-syn measurements are useful diagnostically in subjects who are not expected to have significant AD pathology (Table 5). Neither α-syn/Aβ1-42 nor t-tau/Aβ1-42 ratios alone showed an association with longitudinal cognitive changes in this group. In contrast, when the CSF α-syn-tau181-Mis values were added to the model, the CSF t-tau/Aβ1-42 ratio became significantly associated with worsening in working memory and short-term memory, although the association did not survive adjustment for multiple comparisons (p=0.13 for both measures). However, the association of the CSF α-syn-p-tau181-Mis ratio with ADAS-Cog remained significant after correction for multiple comparisons (Table 5).
Table 5.
Association of α-syn/Aβ1-42 and t-tau/Aβ1-42 with longitudinal neuropsychological and severity measures in age, gender, clinical diagnosis and education adjusted analyses in subject with normal baseline Aβ1-42 values
| α-Syn/Aβ1-42 | T-tau/Aβ1-42 | α-Syn1 | α-Syn-p-tau181-Mis1 | |||||
|---|---|---|---|---|---|---|---|---|
| Baseline | Longitudinal Change | Baseline | Longitudinal Change | Baseline | Longitudinal Change | Baseline | Longitudinal Change | |
| ADAS-Cog | t=0.5; p=0.90 | t=−1.5; p=0.35 | t=1.7; p=0.67 | t=0.4; p=0.78 | t=−1.3; p=0.67 | t=−2.9; p=0.13 | t=−1.6; p=0.67 | t=−3.3; p=0.021 |
| CDR | t=0.15; p=0.92 | t=−0.1; p=0.96 | t=−0.5; p=0.90 | t=1.3; p=0.41 | t=1.3; p=0.66 | t=−1.5; p=0.35 | t=1.24; p=0.67 | t=−1.3; p=0.41 |
| Short term memory | t=−0.4; p=0.90 | t=0.10; p=0.95 | t=−0.8; p=0.84 | t=−1.1; p=0.43 | t=0.3; p=0.90 | t=1.5; p=0.35 | t=0.3; p=0.90 | t=2.2; p=0.13 |
| Delayed memory | t=−1.1; p=0.67 | t=1.1; p=0.41 | t=−1.4; p=0.67 | t=0.53; p=0.71 | t=−0.4; p=0.90 | t=1.2; p=0.41 | t=−0.3; p=0.90 | t=1.2; p=0.41 |
| Executive function | t=1.1; p=0.67 | t=0.11; p=0.95 | t=1.2; p=0.67 | t=−1.0; p=0.43 | t=0.7; p=0.84 | t=−1.4; p=0.41 | t=1.2; p=0.67 | t=−1.4; p=0.43 |
| Working memory | t=−0.8; p=0.84 | t=1.9; p=0.24 | t=−0.66; p=0.88 | t=0.64; p=0.66 | t=−0.03; p=0.97 | t=2.3; p=0.13 | t=0.22; p=0.90 | t=2.4; p=0.13 |
T-tau/Aβ1-42 was included in this model as a covariate
All the p-values are adjusted for multiple comparisons
Discussion
Strengths of the current study of CSF α-syn, Aβ1-42, t-tau, and p-tau181 in AD, MCI, and CN subjects include the availability of Hgb measurements to control for blood contamination in CSF that substantially affects α-syn levels, detailed neuropsychological testing and a longitudinal follow-up in the ADNI cohort, as well as the inclusion of a second cohort consisting of CN and levodopa therapy-naïve PD subjects from PPMI to test the associations of CSF biomarkers in AD and PD as well as MCI and CN. In addition to assessing the effects of demographic factors and APOE genotype, we demonstrated a strong correlation of α-syn and t-tau in AD and CN. Although the curve was shifted down in PD versus CN subjects (Fig. 1h), the association was also reported earlier in the PPMI cohort [19]. When considering CSF t-tau, a bimodal distribution of CSF α-syn was noted in the ADNI cohort, i.e. cases with increased t-tau and normal t-tau correlated distinctly with higher and lower α-syn levels, respectively. We also noticed a mismatch between α-syn and p-tau181 (α-syn-p-tau181-Mis) in a subset of ADNI subjects. Inclusion of α-syn and/or the mismatch not only improved diagnostic sensitivity and specificity of t-tau/Aβ1-42, but also better predicted conversion from MCI to AD and longitudinal cognitive changes.
In a previous investigation, CSF α-syn levels clearly correlated with age, independent of gender [12]. In the current study, however, the association is much weaker and only became significant when adjusted for CSF t-tau levels, which is likely due to the fact that the age span is much narrower in the ADNI cohort (55–89) compared to previous studies (21–90). Another consideration is that previous studies identified AD pathology in up to one third of CN subjects [52,5], which might help explain some of the variable results reported previously [56,53,61].
The positive association between CSF t-tau and α-syn levels in CN, PD, and AD subjects indicates that both biomarkers respond similarly to neurodegenerative brain injury. However, alterations in CSF tau species and α-syn are quite different in AD vs. PD. Specifically, the levels of CSF tau species are increased in AD but decreased in PD in most well controlled studies [67,19,51,36]. While CSF α-syn levels appear to be lower in PD and higher in AD, there is a clear bimodal distribution in relationship to t-tau (Fig. 1g). Specifically, elevated levels of CSF α-syn were not present in subjects with normal t-tau values. One interpretation of this result is that significant neuronal damage associated with AD pathologies causes an increased release of both tau species and α-syn, as in cases with Creutzfeldt-Jakob disease [11,57,54,9]. However, the fact that PD cases, including those in the PPMI cohort, showed lower values of tau species along with α-syn, argues that the regulation of CSF tau species and α-syn is more complex than interpretations based on a simplistic model of increased release of these analytes secondary to neuronal damage. Other factors to consider in interpreting these data are: 1) in diseases with LB pathology, α-syn may be trapped in LBs in the CNS, as is speculated to occur with the sequestration of Aβ1-42 into plaques to account for low CSF Aβ1-42 levels in AD [57,54,26], and 2) the possibility that the release of t-tau and α-syn are increased in AD but decreased in PD. Indeed, this is the fundamental rationale for our efforts to develop the α-syn-p-tau181-Mis value to differentiate the contribution of AD neuropathology (increased p-tau181) and LBD neuropathology (decreased a-syn) in subjects with dementia consistent with a diagnosis of AD.
It should be stressed that while most studies, including ours reported here, showed decreased CSF α-syn levels in PD patients [51,12,19,33,34,9], results on CSF α-syn reported in AD subjects are highly variable. In the ADNI cohort, we recently demonstrated higher CSF α-syn levels in AD subjects, a finding that has been reported previously by some [51,33,9], but not all other studies [53], as well as higher CSF α-syn levels in MCI subjects [20]. A small sample size (in some studies), inadequate control for RBC contamination of CSF samples, methodological differences in α-syn quantification (antibody and assay platform used), and selection of groups without standardized clinical assessment scales may account for these conflicting results. For the classification accuracy of AD against CN, α-syn alone showed modest sensitivity and specificity in the ADNI cohort [20], but α-syn and α-syn-p-tau181-Mis improved upon the performance of the t-tau/Aβ1-42 ratio (Table 3). Similarly, using CSF biomarkers to distinguish MCI subjects from CN showed that the combination of α-syn-p-tau181-Mis and t-tau/Aβ1-42 provided better sensitivity, although the accuracy of the studied biomarkers for the classification of MCI stable subjects versus MCI subjects who progressed to AD was much lower than the one obtained when classifying CN subjects against AD subjects (see Table 3). Two main reasons for this performance are the greater heterogeneity underlying the MCI syndrome [47] and the fact that, as discussed earlier, Aβ1-42, t-tau, and p-tau181 changes are expected to take place in pre-symptomatic stages of AD, thereby confounding the results [14]. Notably, improvements in the sensitivity and/or specificity of CSF biomarkers by combining the multimodal analysis of these biomarkers, especially those involved in independent cellular mechanisms, e.g. tau with Aβ1-42 [57,9] or complement C3 and factor H with Aβ1-42 [67], is well documented. Thus, it is likely that factoring in α-syn and or α-syn-p-tau-Mis with tau and Aβ1-42 better predicts AD [38,37,17], especially those with concomitant LB pathology.
With regard to the longitudinal clinical outcome in the ADNI cohort, as expected, the t-tau/Aβ1-42 ratio was significantly associated with conversion from MCI to AD. Remarkably, decreasing α-syn-p-tau181-Mis values, hypothesized to be indicative of the presence of LB pathology, were associated with increased conversion from MCI to AD and adding α-syn-p-tau181-Mis enhanced the performance of the t-tau/Aβ1-42 ratio. Furthermore, as expected, we found that the t-tau/Aβ1-42 ratio was significantly associated with baseline cognitive impairment, as well as a worse cognitive outcome at follow-up. Importantly, low baseline CSF α-syn-ptau181-Mis was also associated with baseline cognitive impairment, and both low baseline CSF α-syn and α-syn-ptau181-Mis were associated with a worse cognitive outcome determined at follow-up, especially in tests associated with frontal lobe, i.e. executive function, working, and short term memory. Finally, only the inclusion of the CSF t-tau/Aβ1-42 ratio and an α-syn measure (α-syn or α-syn-ptau181-Mis) predicted cognitive decline in the population of subjects with normal Aβ1-42 values. These findings are not only consistent with the clinical observation of faster cognitive decline in the LB variant of AD or AD with concomitant LBD [39,21], but also argues that the additive effect of coincident “independent” pathologies might trigger cognitive deficits at lower thresholds [3,48,13]. At an experimental level, this hypothesis is well supported by in vitro and in vivo studies showing that α-syn, Aβ and tau interact, promoting their mutual aggregation, amplifying neuronal damage and accelerating cognitive decline [16,4,8]. In human autopsy investigations, as noted above, LB pathology is often present in AD cases. Conversely, AD pathology is not an infrequent finding in patients with PD, PDD and DLB [57,18,37,46,13,17].
A few caveats associated with the current study need to be emphasized. First, there are only two cases with a neuropathological diagnosis of combined AD and concomitant LB pathology in the ADNI cohort analyzed. To further test our hypothesis that CSF α-syn-ptau181-Mis values can be used to detect a LB pathology component in clinically diagnosed AD, a larger number of cases with a neuropathological diagnosis that include AD subjects with and without LBD is needed. Also, we cannot quantitatively compare the values for α-syn between control groups of the PPMI and ADNI cohorts, as different assay platforms (ELISA and xMAP Luminex) with different antibody sets were used. Indeed, the same two assays have been compared head-to-head in a Fox Foundation sponsored investigation, which showed that both assays detect α-syn with reasonable sensitivity and variability with good agreement in detecting PD vs. controls, but there is a clear difference in the absolute concentration of α-syn reported by the two assays (http://www.ppmi-info.org/wp-content/uploads/2011/05/PPMI-synuclein-interlaboratory-study.pdf). Notably, it is common to observe significant differences between ELISA and Luminex assays. For example, compared to Innogenetics AlzBio3 xMAP Luminex, Innogenetics ELISAs show 2–6 times higher values for t-tau, p-tau181 and Aβ1-42 in the same CSF samples, although the values tend to correlate well with each other [6,64]. Finally, it should be pointed out that in the ADNI cohort subjects were not drug naïve at the time of CSF collection and therefore, we cannot exclude any potential confounding effect of pharmacotherapy on CSF biomarker levels. To this end, it needs to be stressed that an association between CSF α-syn and t-tau is also detected in the PPMI baseline cohort, where the subjects had no present or past exposure to dopaminergic medications or drugs that interfere with dopamine transporter SPECT (single-photon emission computed tomography) imaging.
In conclusion, our studies reported here confirm and extend evidence for a strong association between CSF α-syn and t-tau and p-tau181, with the most important new finding in this study being the association of α-syn and α-syn-p-tau181-Mis with longitudinal clinical outcomes not only in MCI and AD patients, but also in CN subjects in the presence of the most well established AD CSF biomarkers, i.e. Aβ1-42, t-tau, and p-tau181. We also confirmed previous results of α-syn and additionally demonstrated the significance of α-syn in improving diagnostic sensitivity/specificity provided by Aβ1-42, t-tau and p-tau181. Finally, our data prompt us to hypothesize that it may be feasible to use CSF α-syn-p-tau181-Mis values to detect coexisting LB pathology, but this needs to be validated by follow up studies, especially those consisting of more cases with neuropathological information.
Supplementary Material
Acknowledgements
ADNI is funded by the NIA, NIBIB, and through generous contributions from the following: Alzheimer's Association; Alzheimer's Drug Discovery Foundation; BioClinica, Inc.; Biogen Idec Inc.; Bristol-Myers Squibb Company; Eisai Inc.; Elan Pharmaceuticals, Inc.; Eli Lilly and Company; F. Hoffmann-La Roche Ltd and its affiliated company Genentech, Inc.; GE Healthcare; Innogenetics, N.V.; IXICO Ltd.; Janssen Alzheimer Immunotherapy Research & Development, LLC.; Johnson & Johnson Pharmaceutical Research & Development LLC.; Medpace, Inc.; Merck & Co., Inc.; Meso Scale Diagnostics, LLC.; NeuroRx Research; Novartis Pharmaceuticals Corporation; Pfizer Inc.; Piramal Imaging; Servier; Synarc Inc.; and Takeda Pharmaceutical Company. The Canadian Institutes of Health Research is providing funds to support ADNI clinical sites in Canada. Private sector contributions are facilitated by the Foundation for the National Institutes of Health (www.fnih.org). The grantee organization for ADNI is the Northern California Institute for Research and Education, and the study is coordinated by the Alzheimer's Disease Cooperative Study at the University of California, San Diego. ADNI data are disseminated by the Laboratory for Neuro Imaging at the University of California, Los Angeles. We thank all of the ADNI subjects for their generous participation in ADNI. We thank the Michael J. Fox Foundation, all of our PPMI colleagues and the many individuals who have given their time and of themselves to be subjects in this study. This study is funded by The Michael J. Fox Foundation for Parkinson's Research and industrial funding partners, including Abbott, Avid Radiopharmaceuticals, Biogen Idec, Covance, Elan, Eli Lilly & Co., F. Hoffman-La Roche Ltd., GE Healthcare, Genentech, GlaxoSmithKline, Merck and Company, Pfizer Inc and UCB Pharma SA. This research was also supported by NIA grants (AG10124, ES004696-5897, ES007033-6364, AG033398, ES016873, ES019277, NS057567, NS062684-6221 and NS082137). JQT is the William Maul Measey-Truman G. Schnabel, Jr., Professor of Geriatric Medicine and Gerontology and was supported by the Morris K Udall Center for PD Research Core grant NS053488.
Footnotes
The authors declare no conflict of interest.
References
- 1.Badiola N, de Oliveira RM, Herrera F, Guardia-Laguarta C, Goncalves SA, Pera M, Suarez-Calvet M, Clarimon J, Outeiro TF, Lleo A. Tau enhances alpha-synuclein aggregation and toxicity in cellular models of synucleinopathy. PloS one. 2011;6(10):e26609. doi: 10.1371/journal.pone.0026609. doi:10.1371/journal.pone.0026609. [DOI] [PMC free article] [PubMed] [Google Scholar]
- 2.Beach TG, Monsell SE, Phillips LE, Kukull W. Accuracy of the clinical diagnosis of Alzheimer disease at National Institute on Aging Alzheimer Disease Centers, 2005–2010. Journal of neuropathology and experimental neurology. 2012;71(4):266–273. doi: 10.1097/NEN.0b013e31824b211b. doi:10.1097/NEN.0b013e31824b211b. [DOI] [PMC free article] [PubMed] [Google Scholar]
- 3.Chui HC, Zarow C, Mack WJ, Ellis WG, Zheng L, Jagust WJ, Mungas D, Reed BR, Kramer JH, Decarli CC, Weiner MW, Vinters HV. Cognitive impact of subcortical vascular and Alzheimer's disease pathology. Annals of neurology. 2006;60(6):677–687. doi: 10.1002/ana.21009. doi:10.1002/ana.21009. [DOI] [PMC free article] [PubMed] [Google Scholar]
- 4.Clinton LK, Blurton-Jones M, Myczek K, Trojanowski JQ, LaFerla M. Synergistic Interactions between Abeta, tau, and alpha-synuclein: acceleration of neuropathology and cognitive decline. The Journal of neuroscience : the official journal of the Society for Neuroscience. 2010;30(21):7281–7289. doi: 10.1523/JNEUROSCI.0490-10.2010. doi:10.1523/JNEUROSCI.0490-10.2010. [DOI] [PMC free article] [PubMed] [Google Scholar]
- 5.De Meyer G, Shapiro F, Vanderstichele H, Vanmechelen E, Engelborghs S, De Deyn PP, Coart E, Hansson O, Minthon L, Zetterberg H, Blennow K, Shaw L, Trojanowski JQ. Diagnosis-independent Alzheimer disease biomarker signature in cognitively normal elderly people. Archives of neurology. 2010;67(8):949–956. doi: 10.1001/archneurol.2010.179. doi:10.1001/archneurol.2010.179. [DOI] [PMC free article] [PubMed] [Google Scholar]
- 6.Fagan AM, Shaw LM, Xiong C, Vanderstichele H, Mintun MA, Trojanowski JQ, Coart E, Morris JC, Holtzman DM. Comparison of analytical platforms for cerebrospinal fluid measures of beta-amyloid 1-42, total tau, and p-tau181 for identifying Alzheimer disease amyloid plaque pathology. Archives of neurology. 2011;68(9):1137–1144. doi: 10.1001/archneurol.2011.105. doi:10.1001/archneurol.2011.105. [DOI] [PMC free article] [PubMed] [Google Scholar]
- 7.Fjorback AW, Varming K, Jensen PH. Determination of alpha-synuclein concentration in human plasma using ELISA. Scandinavian journal of clinical and laboratory investigation. 2007;67(4):431–435. doi: 10.1080/00365510601161497. doi:10.1080/00365510601161497. [DOI] [PubMed] [Google Scholar]
- 8.Giasson BI, Forman MS, Higuchi M, Golbe LI, Graves CL, Kotzbauer PT, Trojanowski JQ, Lee VM. Initiation and synergistic fibrillization of tau and alpha-synuclein. Science. 2003;300(5619):636–640. doi: 10.1126/science.1082324. doi:10.1126/science.1082324. [DOI] [PubMed] [Google Scholar]
- 9.Hall S, Ohrfelt A, Constantinescu R, Andreasson U, Surova Y, Bostrom F, Nilsson C, Hakan W, Decraemer H, Nagga K, Minthon L, Londos E, Vanmechelen E, Holmberg B, Zetterberg H, Blennow K, Hansson O. Accuracy of a panel of 5 cerebrospinal fluid biomarkers in the differential diagnosis of patients with dementia and/or parkinsonian disorders. Archives of neurology. 2012;69(11):1445–1452. doi: 10.1001/archneurol.2012.1654. doi:10.1001/archneurol.2012.1654. [DOI] [PubMed] [Google Scholar]
- 10.Hamilton RL. Lewy bodies in Alzheimer's disease: a neuropathological review of 145 cases using alpha-synuclein immunohistochemistry. Brain pathology. 2000;10(3):378–384. doi: 10.1111/j.1750-3639.2000.tb00269.x. [DOI] [PMC free article] [PubMed] [Google Scholar]
- 11.Hamlin C, Puoti G, Berri S, Sting E, Harris C, Cohen M, Spear C, Bizzi A, Debanne SM, Rowland DY. A comparison of tau and 14-3-3 protein in the diagnosis of Creutzfeldt-Jakob disease. Neurology. 2012;79(6):547–552. doi: 10.1212/WNL.0b013e318263565f. doi:10.1212/WNL.0b013e318263565f. [DOI] [PMC free article] [PubMed] [Google Scholar]
- 12.Hong Z, Shi M, Chung KA, Quinn JF, Peskind ER, Galasko D, Jankovic J, Zabetian CP, Leverenz JB, Baird G, Montine TJ, Hancock AM, Hwang H, Pan C, Bradner J, Kang UJ, Jensen PH, Zhang J. DJ-1 and alpha-synuclein in human cerebrospinal fluid as biomarkers of Parkinson's disease. Brain : a journal of neurology. 2010;133(Pt 3):713–726. doi: 10.1093/brain/awq008. doi:10.1093/brain/awq008. [DOI] [PMC free article] [PubMed] [Google Scholar]
- 13.Irwin DJ, White MT, Toledo JB, Xie SX, Robinson JL, Van Deerlin V, Lee VM, Leverenz JB, Montine TJ, Duda JE, Hurtig HI, Trojanowski JQ. Neuropathologic substrates of Parkinson disease dementia. Annals of neurology. 2012;72(4):587–598. doi: 10.1002/ana.23659. doi:10.1002/ana.23659. [DOI] [PMC free article] [PubMed] [Google Scholar]
- 14.Jack CR, Jr., Knopman DS, Jagust WJ, Petersen RC, Weiner MW, Aisen PS, Shaw LM, Vemuri P, Wiste HJ, Weigand SD, Lesnick TG, Pankratz VS, Donohue MC, Trojanowski JQ. Tracking pathophysiological processes in Alzheimer's disease: an updated hypothetical model of dynamic biomarkers. Lancet neurology. 2013;12(2):207–216. doi: 10.1016/S1474-4422(12)70291-0. doi:10.1016/S1474-4422(12)70291-0. [DOI] [PMC free article] [PubMed] [Google Scholar]
- 15.Jellinger KA. Interaction between alpha-synuclein and other proteins in neurodegenerative disorders. TheScientificWorldJournal. 2011;11:1893–1907. doi: 10.1100/2011/371893. doi:10.1100/2011/371893. [DOI] [PMC free article] [PubMed] [Google Scholar]
- 16.Jellinger KA. Interaction between pathogenic proteins in neurodegenerative disorders. Journal of cellular and molecular medicine. 2012;16(6):1166–1183. doi: 10.1111/j.1582-4934.2011.01507.x. doi:10.1111/j.1582-4934.2011.01507.x. [DOI] [PMC free article] [PubMed] [Google Scholar]
- 17.Jellinger KA, Attems J. Prevalence and impact of vascular and Alzheimer pathologies in Lewy body disease. Acta neuropathologica. 2008;115(4):427–436. doi: 10.1007/s00401-008-0347-5. doi:10.1007/s00401-008-0347-5. [DOI] [PubMed] [Google Scholar]
- 18.Jellinger KA, Attems J. Prevalence of dementia disorders in the oldest-old: an autopsy study. Acta neuropathologica. 2010;119(4):421–433. doi: 10.1007/s00401-010-0654-5. doi:10.1007/s00401-010-0654-5. [DOI] [PubMed] [Google Scholar]
- 19.Kang JH, Irwin DJ, Chen-Plotkin AS, Siderowf A, Caspell C, Coffey CS, Waligorska T, Taylor P, Pan S, Frasier M, Marek K, Kierbutz K, Jennings D, Simuni T, Tanner CM, Singleton A, Toga AW, Chowdhury S, Mollenhauer B, Trojanoswki JQ, Shaw LM. JAMA neurology (epub) 2013. Association of cerebrospinal fluid Aβ1-42, t-tau, p-tau181 and α-synuclein levels with clinical features of early drug naïve Parkinson's disease patients. [DOI] [PMC free article] [PubMed] [Google Scholar]
- 20.Korff A, Liu C, Ginghina C, Shi M, Zhang J. α-Synuclein in cerebrospinal fluid of Alzheimer's disease and mild cognitive impairment. Journal of Alzheimer's disease : JAD (epub) 2013 doi: 10.3233/JAD-130458. [DOI] [PMC free article] [PubMed] [Google Scholar]
- 21.Kraybill ML, Larson EB, Tsuang DW, Teri L, McCormick WC, Bowen JD, Kukull WA, Leverenz JB, Cherrier M. Cognitive differences in dementia patients with autopsy-verified AD, Lewy body pathology, or both. Neurology. 2005;64(12):2069–2073. doi: 10.1212/01.WNL.0000165987.89198.65. doi:10.1212/01.WNL.0000165987.89198.65. [DOI] [PMC free article] [PubMed] [Google Scholar]
- 22.Kuhn M. Building Predictive Models in R Using the caret. Journal of Statistical Software. 2008;28(5) [Google Scholar]
- 23.Laird NM, Ware JH. Random-effects models for longitudinal data. Biometrics. 1982;38(4):963–974. [PubMed] [Google Scholar]
- 24.Landau SM, Lu M, Joshi AD, Pontecorvo M, Mintun MA, Trojanowski JQ, Shaw LM, Jagust WJ, Initiative.. ftAsDN Comparing PET imaging and CSF measurements of Aß. Annals of neurology. 2013 doi: 10.1002/ana.23908. [DOI] [PMC free article] [PubMed] [Google Scholar]
- 25.Larson ME, Sherman MA, Greimel S, Kuskowski M, Schneider JA, Bennett DA, Lesne SE. Soluble alpha-synuclein is a novel modulator of Alzheimer's disease pathophysiology. The Journal of neuroscience : the official journal of the Society for Neuroscience. 2012;32(30):10253–10266. doi: 10.1523/JNEUROSCI.0581-12.2012. doi:10.1523/JNEUROSCI.0581-12.2012. [DOI] [PMC free article] [PubMed] [Google Scholar]
- 26.Le Bastard N, Coart E, Vanderstichele H, Vanmechelen E, Martin JJ, Engelborghs S. Comparison of two analytical platforms for the clinical qualification of Alzheimer's disease biomarkers in pathologically-confirmed dementia. Journal of Alzheimer's disease : JAD. 2013;33(1):117–131. doi: 10.3233/JAD-2012-121246. doi:10.3233/JAD-2012-121246. [DOI] [PubMed] [Google Scholar]
- 27.Lindersson E, Beedholm R, Hojrup P, Moos T, Gai W, Hendil KB, Jensen PH. Proteasomal inhibition by alpha-synuclein filaments and oligomers. The Journal of biological chemistry. 2004;279(13):12924–12934. doi: 10.1074/jbc.M306390200. doi:10.1074/jbc.M306390200. [DOI] [PubMed] [Google Scholar]
- 28.Lippa CF, Fujiwara H, Mann DM, Giasson B, Baba M, Schmidt ML, Nee LE, O'Connell B, Pollen DA, St George-Hyslop P, Ghetti B, Nochlin D, Bird TD, Cairns NJ, Lee VM, Iwatsubo T, Trojanowski JQ. Lewy bodies contain altered alpha-synuclein in brains of many familial Alzheimer's disease patients with mutations in presenilin and amyloid precursor protein genes. The American journal of pathology. 1998;153(5):1365–1370. doi: 10.1016/s0002-9440(10)65722-7. [DOI] [PMC free article] [PubMed] [Google Scholar]
- 29.Marek K, Jennings D, Lasch S, Siderowf A, Tanner C, Simuni T, Coffey C, Kieburtz K, Flagg E, Chowdhury S, Poewe W, Mollenhauer B, Sherer T, Frasier M, Meunier C. The Parkinson Progression Marker Initiative (PPMI) Progress in neurobiology. 2011;95(4):629–635. doi: 10.1016/j.pneurobio.2011.09.005. doi:10.1016/j.pneurobio.2011.09.005. [DOI] [PMC free article] [PubMed] [Google Scholar]
- 30.Masliah E, Rockenstein E, Veinbergs I, Sagara Y, Mallory M, Hashimoto M, Mucke L. beta-amyloid peptides enhance alpha-synuclein accumulation and neuronal deficits in a transgenic mouse model linking Alzheimer's disease and Parkinson's disease. Proceedings of the National Academy of Sciences of the United States of America. 2001;98(21):12245–12250. doi: 10.1073/pnas.211412398. doi:10.1073/pnas.211412398. [DOI] [PMC free article] [PubMed] [Google Scholar]
- 31.Mattila PM, Rinne JO, Helenius H, Dickson DW, Roytta M. Alpha-synuclein-immunoreactive cortical Lewy bodies are associated with cognitive impairment in Parkinson's disease. Acta neuropathologica. 2000;100(3):285–290. doi: 10.1007/s004019900168. [DOI] [PubMed] [Google Scholar]
- 32.McKhann GM, Knopman DS, Chertkow H, Hyman BT, Jack CR, Jr., Kawas CH, Klunk WE, Koroshetz WJ, Manly JJ, Mayeux R, Mohs RC, Morris JC, Rossor MN, Scheltens P, Carrillo MC, Thies B, Weintraub S, Phelps CH. The diagnosis of dementia due to Alzheimer's disease: recommendations from the National Institute on Aging-Alzheimer's Association workgroups on diagnostic guidelines for Alzheimer's disease. Alzheimer's & dementia : the journal of the Alzheimer's Association. 2011;7(3):263–269. doi: 10.1016/j.jalz.2011.03.005. doi:10.1016/j.jalz.2011.03.005. [DOI] [PMC free article] [PubMed] [Google Scholar]
- 33.Mollenhauer B, Locascio JJ, Schulz-Schaeffer W, Sixel-Doring F, Trenkwalder C, Schlossmacher MG. alpha-Synuclein and tau concentrations in cerebrospinal fluid of patients presenting with parkinsonism: a cohort study. Lancet neurology. 2011;10(3):230–240. doi: 10.1016/S1474-4422(11)70014-X. doi:10.1016/S1474-4422(11)70014-X. [DOI] [PubMed] [Google Scholar]
- 34.Mollenhauer B, Trautmann E, Taylor P, Manninger P, Sixel-Doring F, Ebentheuer J, Trenkwalder C, Schlossmacher MG. Total CSF alpha-synuclein is lower in de novo Parkinson patients than in healthy subjects. Neuroscience letters. 2013;532:44–48. doi: 10.1016/j.neulet.2012.11.004. doi:10.1016/j.neulet.2012.11.004. [DOI] [PubMed] [Google Scholar]
- 35.Montine TJ, Phelps CH, Beach TG, Bigio EH, Cairns NJ, Dickson DW, Duyckaerts C, Frosch MP, Masliah E, Mirra SS, Nelson PT, Schneider JA, Thal DR, Trojanowski JQ, Vinters HV, Hyman BT. National Institute on Aging-Alzheimer's Association guidelines for the neuropathologic assessment of Alzheimer's disease: a practical approach. Acta neuropathologica. 2012;123(1):1–11. doi: 10.1007/s00401-011-0910-3. doi:10.1007/s00401-011-0910-3. [DOI] [PMC free article] [PubMed] [Google Scholar]
- 36.Montine TJ, Shi M, Quinn JF, Peskind ER, Craft S, Ginghina C, Chung KA, Kim H, Galasko DR, Jankovic J, Zabetian CP, Leverenz JB, Zhang J. CSF Abeta(42) and tau in Parkinson's disease with cognitive impairment. Movement disorders : official journal of the Movement Disorder Society. 2010;25(15):2682–2685. doi: 10.1002/mds.23287. doi:10.1002/mds.23287. [DOI] [PMC free article] [PubMed] [Google Scholar]
- 37.Nelson PT, Alafuzoff I, Bigio EH, Bouras C, Braak H, Cairns NJ, Castellani RJ, Crain BJ, Davies P, Del Tredici K, Duyckaerts C, Frosch MP, Haroutunian V, Hof PR, Hulette CM, Hyman BT, Iwatsubo T, Jellinger KA, Jicha GA, Kovari E, Kukull WA, Leverenz JB, Love S, Mackenzie IR, Mann DM, Masliah E, McKee AC, Montine TJ, Morris JC, Schneider JA, Sonnen JA, Thal DR, Trojanowski JQ, Troncoso JC, Wisniewski T, Woltjer RL, Beach TG. Correlation of Alzheimer disease neuropathologic changes with cognitive status: a review of the literature. Journal of neuropathology and experimental neurology. 2012;71(5):362–381. doi: 10.1097/NEN.0b013e31825018f7. doi:10.1097/NEN.0b013e31825018f7. [DOI] [PMC free article] [PubMed] [Google Scholar]
- 38.Nelson PT, Head E, Schmitt FA, Davis PR, Neltner JH, Jicha GA, Abner EL, Smith CD, Van Eldik LJ, Kryscio RJ, Scheff SW. Alzheimer's disease is not “brain aging”: neuropathological, genetic, and epidemiological human studies. Acta neuropathologica. 2011;121(5):571–587. doi: 10.1007/s00401-011-0826-y. doi:10.1007/s00401-011-0826-y. [DOI] [PMC free article] [PubMed] [Google Scholar]
- 39.Olichney JM, Galasko D, Salmon DP, Hofstetter CR, Hansen LA, Katzman R, Thal LJ. Cognitive decline is faster in Lewy body variant than in Alzheimer's disease. Neurology. 1998;51(2):351–357. doi: 10.1212/wnl.51.2.351. [DOI] [PubMed] [Google Scholar]
- 40.Olsson A, Vanderstichele H, Andreasen N, De Meyer G, Wallin A, Holmberg B, Rosengren L, Vanmechelen E, Blennow K. Simultaneous measurement of beta-amyloid(1-42), total tau, and phosphorylated tau (Thr181) in cerebrospinal fluid by the xMAP technology. Clinical chemistry. 2005;51(2):336–345. doi: 10.1373/clinchem.2004.039347. doi:10.1373/clinchem.2004.039347. [DOI] [PubMed] [Google Scholar]
- 41.Parkkinen L, Soininen H, Alafuzoff I. Regional distribution of alpha-synuclein pathology in unimpaired aging and Alzheimer disease. Journal of neuropathology and experimental neurology. 2003;62(4):363–367. doi: 10.1093/jnen/62.4.363. [DOI] [PubMed] [Google Scholar]
- 42.Petersen RC, Aisen PS, Beckett LA, Donohue MC, Gamst AC, Harvey DJ, Jack CR, Jr., Jagust WJ, Shaw LM, Toga AW, Trojanowski JQ, Weiner MW. Alzheimer's Disease Neuroimaging Initiative (ADNI): clinical characterization. Neurology. 2010;74(3):201–209. doi: 10.1212/WNL.0b013e3181cb3e25. doi:10.1212/WNL.0b013e3181cb3e25. [DOI] [PMC free article] [PubMed] [Google Scholar]
- 43.Pinheiro J, Bates D, DebRoy S, Sarkar D. nlme: Linear and Nonlinear Mixed Effects Models. R package version 3.1-108 edn. 2013. [Google Scholar]
- 44.R Core Team . R: A Language and Environment for Statistical Computing. R Foundation for Statistical Computing; Vienna, Austria: 2013. [Google Scholar]
- 45.Robin X, Turck N, Hainard A, Tiberti N, Lisacek F, Sanchez JC, Muller M. pROC: an open-source package for R and S+ to analyze and compare ROC curves. BMC bioinformatics. 2011;12:77. doi: 10.1186/1471-2105-12-77. doi:10.1186/1471-2105-12-77. [DOI] [PMC free article] [PubMed] [Google Scholar]
- 46.Schneider JA, Arvanitakis Z, Bang W, Bennett DA. Mixed brain pathologies account for most dementia cases in community-dwelling older persons. Neurology. 2007;69(24):2197–2204. doi: 10.1212/01.wnl.0000271090.28148.24. doi:10.1212/01.wnl.0000271090.28148.24. [DOI] [PubMed] [Google Scholar]
- 47.Schneider JA, Arvanitakis Z, Leurgans SE, Bennett DA. The neuropathology of probable Alzheimer disease and mild cognitive impairment. Annals of neurology. 2009;66(2):200–208. doi: 10.1002/ana.21706. doi:10.1002/ana.21706. [DOI] [PMC free article] [PubMed] [Google Scholar]
- 48.Schneider JA, Boyle PA, Arvanitakis Z, Bienias JL, Bennett DA. Subcortical infarcts, Alzheimer's disease pathology, and memory function in older persons. Annals of neurology. 2007;62(1):59–66. doi: 10.1002/ana.21142. doi:10.1002/ana.21142. [DOI] [PubMed] [Google Scholar]
- 49.Shaw LM, Vanderstichele H, Knapik-Czajka M, Clark CM, Aisen PS, Petersen RC, Blennow K, Soares H, Simon A, Lewczuk P, Dean R, Siemers E, Potter W, Lee VM, Trojanowski JQ. Cerebrospinal fluid biomarker signature in Alzheimer's disease neuroimaging initiative subjects. Annals of neurology. 2009;65(4):403–413. doi: 10.1002/ana.21610. doi:10.1002/ana.21610. [DOI] [PMC free article] [PubMed] [Google Scholar]
- 50.Shaw LM, Vanderstichele H, Knapik-Czajka M, Figurski M, Coart E, Blennow K, Soares H, Simon AJ, Lewczuk P, Dean RA, Siemers E, Potter W, Lee VM, Trojanowski JQ. Qualification of the analytical and clinical performance of CSF biomarker analyses in ADNI. Acta neuropathologica. 2011;121(5):597–609. doi: 10.1007/s00401-011-0808-0. doi:10.1007/s00401-011-0808-0. [DOI] [PMC free article] [PubMed] [Google Scholar]
- 51.Shi M, Bradner J, Hancock AM, Chung KA, Quinn JF, Peskind ER, Galasko D, Jankovic J, Zabetian CP, Kim HM, Leverenz JB, Montine TJ, Ginghina C, Kang UJ, Cain KC, Wang Y, Aasly J, Goldstein D, Zhang J. Cerebrospinal fluid biomarkers for Parkinson disease diagnosis and progression. Annals of neurology. 2011;69(3):570–580. doi: 10.1002/ana.22311. doi:10.1002/ana.22311. [DOI] [PMC free article] [PubMed] [Google Scholar]
- 52.Sperling RA, Aisen PS, Beckett LA, Bennett DA, Craft S, Fagan AM, Iwatsubo T, Jack CR, Jr., Kaye J, Montine TJ, Park DC, Reiman EM, Rowe CC, Siemers E, Stern Y, Yaffe K, Carrillo MC, Thies B, Morrison-Bogorad M, Wagster MV, Phelps CH. Toward defining the preclinical stages of Alzheimer's disease: recommendations from the National Institute on Aging-Alzheimer's Association workgroups on diagnostic guidelines for Alzheimer's disease. Alzheimer's & dementia : the journal of the Alzheimer's Association. 2011;7(3):280–292. doi: 10.1016/j.jalz.2011.03.003. doi:10.1016/j.jalz.2011.03.003. [DOI] [PMC free article] [PubMed] [Google Scholar]
- 53.Spies PE, Melis RJ, Sjogren MJ, Rikkert MG, Verbeek MM. Cerebrospinal fluid alpha-synuclein does not discriminate between dementia disorders. Journal of Alzheimer's disease : JAD. 2009;16(2):363–369. doi: 10.3233/JAD-2009-0955. doi:10.3233/JAD-2009-0955. [DOI] [PubMed] [Google Scholar]
- 54.Tapiola T, Alafuzoff I, Herukka SK, Parkkinen L, Hartikainen P, Soininen H, Pirttila T. Cerebrospinal fluid {beta}-amyloid 42 and tau proteins as biomarkers of Alzheimer-type pathologic changes in the brain. Archives of neurology. 2009;66(3):382–389. doi: 10.1001/archneurol.2008.596. doi:10.1001/archneurol.2008.596. [DOI] [PubMed] [Google Scholar]
- 55.The Lancet N Biomarker promise for Parkinson's disease. Lancet neurology. 2010;9(12):1139. doi: 10.1016/S1474-4422(10)70284-2. doi:10.1016/S1474-4422(10)70284-2. [DOI] [PubMed] [Google Scholar]
- 56.Tokuda T, Salem SA, Allsop D, Mizuno T, Nakagawa M, Qureshi MM, Locascio JJ, Schlossmacher MG, El-Agnaf OM. Decreased alpha-synuclein in cerebrospinal fluid of aged individuals and subjects with Parkinson's disease. Biochemical and biophysical research communications. 2006;349(1):162–166. doi: 10.1016/j.bbrc.2006.08.024. doi:10.1016/j.bbrc.2006.08.024. [DOI] [PubMed] [Google Scholar]
- 57.Toledo JB, Brettschneider J, Grossman M, Arnold SE, Hu WT, Xie SX, Lee VM, Shaw LM, Trojanowski JQ. CSF biomarkers cutoffs: the importance of coincident neuropathological diseases. Acta neuropathologica. 2012;124(1):23–35. doi: 10.1007/s00401-012-0983-7. doi:10.1007/s00401-012-0983-7. [DOI] [PMC free article] [PubMed] [Google Scholar]
- 58.Toledo JB, Vanderstichele H, Figurski M, Aisen PS, Petersen RC, Weiner MW, Jack CR, Jr., Jagust W, Decarli C, Toga AW, Toledo E, Xie SX, Lee VM, Trojanowski JQ, Shaw LM. Factors affecting Abeta plasma levels and their utility as biomarkers in ADNI. Acta neuropathologica. 2011;122(4):401–413. doi: 10.1007/s00401-011-0861-8. doi:10.1007/s00401-011-0861-8. [DOI] [PMC free article] [PubMed] [Google Scholar]
- 59.Tsigelny IF, Crews L, Desplats P, Shaked GM, Sharikov Y, Mizuno H, Spencer B, Rockenstein E, Trejo M, Platoshyn O, Yuan JX, Masliah E. Mechanisms of hybrid oligomer formation in the pathogenesis of combined Alzheimer's and Parkinson's diseases. PloS one. 2008;3(9):e3135. doi: 10.1371/journal.pone.0003135. doi:10.1371/journal.pone.0003135. [DOI] [PMC free article] [PubMed] [Google Scholar]
- 60.van den Berge SA, Kevenaar JT, Sluijs JA, Hol EM. Dementia in Parkinson's Disease Correlates with alpha-Synuclein Pathology but Not with Cortical Astrogliosis. Parkinson's disease. 2012;2012:420957. doi: 10.1155/2012/420957. doi:10.1155/2012/420957. [DOI] [PMC free article] [PubMed] [Google Scholar]
- 61.van Geel WJ, Abdo WF, Melis R, Williams S, Bloem BR, Verbeek MM. A more efficient enzyme-linked immunosorbent assay for measurement of alpha-synuclein in cerebrospinal fluid. Journal of neuroscience methods. 2008;168(1):182–185. doi: 10.1016/j.jneumeth.2007.09.021. doi:10.1016/j.jneumeth.2007.09.021. [DOI] [PubMed] [Google Scholar]
- 62.Vanderstichele H, De Meyer G, Shapiro F, Engelborghs S, De Deyn PP, Shaw LM, Trojanowski JQ. Scarpini DGaE (ed) BioMarkers for Early Diagnosis of Alzheimer's Disease. Nova Science Publishers, Inc; Hauppauge, NY: 2008. Alzheimer's disease biomarkers: from concept to clinical utility; pp. 81–122. [Google Scholar]
- 63.Venables W, Ripley B. Modern Applied Statistics with S. Springer Verlag; New York: 2002. [Google Scholar]
- 64.Wang LS, Leung YY, Chang SK, Leight S, Knapik-Czajka M, Baek Y, Shaw LM, Lee VM, Trojanowski JQ, Clark CM. Comparison of xMAP and ELISA assays for detecting cerebrospinal fluid biomarkers of Alzheimer's disease. Journal of Alzheimer's disease : JAD. 2012;31(2):439–445. doi: 10.3233/JAD-2012-120082. doi:10.3233/JAD-2012-120082. [DOI] [PMC free article] [PubMed] [Google Scholar]
- 65.Weiner MW, Veitch DP, Aisen PS, Beckett LA, Cairns NJ, Green RC, Harvey D, Jack CR, Jagust W, Liu E, Morris JC, Petersen RC, Saykin AJ, Schmidt ME, Shaw L, Siuciak JA, Soares H, Toga AW, Trojanowski JQ. The Alzheimer's Disease Neuroimaging Initiative: a review of papers published since its inception. Alzheimer's & dementia : the journal of the Alzheimer's Association. 2012;8(1 Suppl):S1–68. doi: 10.1016/j.jalz.2011.09.172. doi:10.1016/j.jalz.2011.09.172. [DOI] [PMC free article] [PubMed] [Google Scholar]
- 66.Wilcox RR, Schönbrodt FD. The WRS package for robust statistics in R. (version 0.15) 2011 Retrieved from http://r-forge.r-project.org/projects/wrs/
- 67.Zhang J, Sokal I, Peskind ER, Quinn JF, Jankovic J, Kenney C, Chung KA, Millard SP, Nutt JG, Montine TJ. CSF multianalyte profile distinguishes Alzheimer and Parkinson diseases. American journal of clinical pathology. 2008;129(4):526–529. doi: 10.1309/W01Y0B808EMEH12L. doi:10.1309/W01Y0B808EMEH12L. [DOI] [PMC free article] [PubMed] [Google Scholar]
Associated Data
This section collects any data citations, data availability statements, or supplementary materials included in this article.