

Summary
Cumulative cortisol burden is known to influence neuropsychiatric and metabolic disorders. To better understand the relationship between daily cortisol exposure and measures of the diurnal circadian cortisol rhythm, we examined the cross-sectional association of the cortisol awakening response (CAR) with wake-up cortisol, bedtime cortisol, diurnal slope, and total cortisol area under the curve (AUC). Up to 18 salivary cortisol samples were collected over 3 days from 935 White, Hispanic, and Black individuals (mean age 65 ± 9.8 years) in the Multi-Ethnic Study of Atherosclerosis. Outcome measures included awakening cortisol, CAR (awakening to 30 min post-awakening), early decline (30 min to 2 h post-awakening), late decline (2 h post-awakening to bedtime), and the corresponding AUCs. Total cortisol AUC was a summary measure of cumulative cortisol exposure. Higher CAR was associated with significantly lower wake-up cortisol (β = −0.56; 95% CI: −0.59 to −0.53) and a higher early decline AUC (β = 0.38; 95% CI: 0.34–0.42) but was not associated with total cortisol AUC (β = 0.04; 95% CI: −0.01 to 0.09), or other diurnal cortisol curve components following multivariable adjustment. Total cortisol AUC was significantly and positively associated with wake-up cortisol (β = 0.36; 95% CI: 0.32–0.40), bedtime cortisol (β = 0.61; 95% CI: 0.58–0.64), and other AUC measures, following multivariable adjustment. Associations were similar by sex, race/ethnicity, and age categories. We conclude that bedtime cortisol showed the strongest correlation with total cortisol AUC, suggesting it may be a marker of daily cortisol exposure.
Keywords: Cortisol awakening response (CAR), Hypothalamic–pituitary–adrenal (HPA) axis, Diurnal cortisol, Correlation, Population-based study
Investigations over the last few years have demonstrated that inter-individual differences in hypothalamic–pituitary–adrenal (HPA) axis function can be associated with increased risk for stress-related and metabolic disorders. Hypercortisolism, hypocortisolism, and a blunted diurnal cortisol slope have all been associated with adverse measures of mental and physical health (Champaneri et al., 2010). Specifically, higher urine free cortisol has longitudinally predicted increased cardiovascular disease mortality (Vogelzangs et al., 2010) and higher total cortisol AUC has been cross-sectionally associated with diabetes in women (Champaneri et al., 2012). Cross-sectionally, hypocortisolism in some conditions, such as obesity (Champaneri et al., 2010, 2013), diabetes in men (Champaneri et al., 2012), and post-traumatic stress disorder (Kudielka et al., 2012), has been suggested by a lower total cortisol AUC or flattened diurnal slope, although this profile may reflect reduced glucocorticoid sensitivity. A blunted diurnal slope, has longitudinally predicted increased cardiovascular disease mortality, independent of stress measures (Kumari et al., 2011). Depressive disorders have been cross-sectionally associated with a mixture of HPA abnormalities, including hypercortisolism (Stetler and Miller, 2011) and a blunted diurnal slope (Champaneri et al., 2010).
Another important component of the HPA axis circadian rhythm is the cortisol awakening response (CAR). The CAR refers to the rapid increase in cortisol that occurs 30–45 min after awakening in the morning. An abnormal CAR (heightened or blunted) has been reported to be associated with several neuropsychiatric and/or metabolically dysfunctional groups including individuals with a history of childhood trauma (Mangold et al., 2010), depression (Huber et al., 2006), chronic stress (Kudielka and Wust, 2010), obesity (Wallerius et al., 2003; Steptoe et al., 2004; Therrien et al., 2007; Champaneri et al., 2013), and type 2 diabetes (Bruehl et al., 2009; Champaneri et al., 2012). However, it remains unclear what a robust or blunted CAR indicates in regards to daily cortisol burden (Golden et al., 2011). Specifically it is unknown whether the CAR can be used as a measure of total daily cortisol exposure, an important risk factor for neuropsychiatric and metabolic disease.
Few studies have examined whether the CAR is a proxy for total daily cortisol secretion measured by multiple cortisol measurements throughout the day. A small study of 22 adults did not identify a cross-sectional association between CAR AUC, determined from cortisol samples collected at awakening and every 15 min post-awake for 60 min, and integrated 12-h salivary cortisol measurements (Schmidt-Reinwald et al., 1999). However, Edwards et al. (2001) noted in 42 healthy men a significant positive cross-sectional association between CAR AUC, established from cortisol samples collected at awakening and every 15 min for 45 min, and 12-h mean diurnal cortisol on 2 separate days, suggesting that CAR AUC may be a surrogate measure for predicting cortisol levels for the remainder of the day. Both of these studies included small sample sizes, and their findings warrant follow-up in a larger population.
If the CAR does not represent total daily cortisol exposure and instead reflects a different aspect of HPA axis function, it would be informative to know which other components of the diurnal cortisol curve—wake-up cortisol, bedtime cortisol, or diurnal slope—reflect total daily cortisol exposure, estimated as the total AUC. This information would be important in informing appropriate measures of daily cortisol exposure, in addition to and complimentary to the CAR, for clinical evaluation and biopsychosocial research.
The Multi-Ethnic Study of Atherosclerosis (MESA) provides a large enough sample size to begin to address these questions. The MESA Stress Study collected diurnal salivary cortisol profiles on a subset of 1002 ethnically diverse adult men and women and offers a unique opportunity to examine the cross-sectional association of the CAR with the diurnal cortisol rhythm and the total daily cortisol AUC with other components of the diurnal cortisol rhythm, and to exploit additional data collected from the main MESA study to examine potential confounders/explanatory factors in these associations (e.g. race/ethnicity, sex, body fat).
1. Methods
1.1. Study population
MESA is a multi-center, longitudinal cohort study of the prevalence and correlates of subclinical cardiovascular disease and the factors that influence its progression (Bild et al., 2002). Between July 2000 and August 2002, 6814 men and women without clinical cardiovascular disease who identified themselves as white, black, Hispanic, or Chinese, and were 45–84 years of age were recruited from six U.S. communities: Baltimore City and Baltimore County, Maryland; Chicago, Illinois; Forsyth County, North Carolina; Los Angeles County, California; Northern Manhattan and the Bronx, New York; and St. Paul, Minnesota. Details on the sampling frames and the cohort examination procedures have been published elsewhere (Bild et al., 2002).
Between July 2004 and November 2006, in conjunction with the second and third follow-up examinations of the full MESA sample, a subsample of 1002 white, Hispanic, and African-American participants at the New York and Los Angeles sites of MESA were recruited for a sub-study of biological stress markers (the MESA Stress Study), which included repeat assessments of salivary cortisol (Ranjit et al., 2009; Hajat et al., 2010). Enrollment continued until approximately 500 participants were enrolled at each site (Ranjit et al., 2009; Hajat et al., 2010). From 1002 participants, there were 3006 participant-days of data collection. We excluded 127 days because no track-caps time was available (n = 107 days), no cortisol sample was collected (n = 15 days), or no first cap time or wake-up time was available (n = 5 days). We excluded 936 samples with no track-cap time, insufficient sample for assay, or unreliable cortisol values (0 or >100 nmol/L). An additional 35 participants were excluded who were taking oral or inhaled steroids. This resulted in 935 participants, 2774 days, and 15,774 samples (Ranjit et al., 2009). Informed consent was obtained from each participant, and the study was approved by the Institutional Review Boards of each institution.
1.2. Hormonal measures
MESA Stress Study participants were instructed, by trained staff, to collect six salivary cortisol samples a day (directly upon awakening, 30 min after waking, 1000 h, 1200 h or before lunch whichever was earlier, 1800 h or before dinner whichever was earlier, and at bedtime). In order to avoid blood contamination of samples or meal-related surges in cortisol, both of which can cause falsely high salivary cortisol readings, participants were instructed to avoid brushing their teeth or eating 15 min prior to sample collection. This daily collection protocol was repeated on each of three successive week days; thus, each participant provided up to 18 cortisol measures. As previously reported, 97% of participants collected samples on all 3 days and 85% of participants collected at least 5 samples per day for all days on which they collected samples (Hajat et al., 2010). Participants recorded collection time on special cards; in addition, a time tracking device (Track Caps) automatically registered the time at which cotton swabs were extracted to collect each sample. Participants were told of this time tracking device. Because prior work has shown that use of this device increases compliance with the requested sampling time (Kudielka et al., 2003), we used the recorded Track Caps time for all analyses. Based on prior work in our population, the median difference in times between the track caps and recorded times was between 2 and 4 min depending on the sample. The 25th and 75th percentiles were between 1 and 2 and 5 and 13 min, respectively, with the longest times corresponding to the last sample of the day. Therefore the CAR was least affected by timing discrepancy. Overall the first sample was taken within 5 min of wake-up for 78% of days across participants and the median difference between the first and second sample was 34 min.
Participants were permitted to carry samples with them over the course of the day during collection but were instructed to store the samples in the refrigerator after collection until they were returned to the clinic in-person or picked up from the participant. Saliva samples were collected using cotton swabs and stored at −20 °C until analysis. Before biochemical analysis, samples were thawed and centrifuged at 3000 rpm for 3 min to obtain clear saliva with low viscosity. Cortisol levels were determined employing a commercially available chemi-luminescence assay with a high sensitivity of 0.16 ng/mL (IBL-Hamburg; Germany). Intra- and inter-assay coefficients of variation were below 8%.
1.3. Covariates
Data on age, race/ethnicity, sex, years of education, cigarette smoking, highest level of education achieved, and annual income were self-reported using standard protocols (Bild et al., 2002). Analysis of socioeconomic status was simplified by use of a single wealth-income index variable described by Hajat et al. (2010) and incorporates annual income and information about assets. Prescription and over-the-counter medications were determined by transcription of medications brought into clinic during each exam (Bild et al., 2002). Because Badrick et al. (2007) showed higher salivary cortisol levels in current compared to never and ex-smokers only and no differences among ex-smokers and never-smokers, we categorized smoking as current smoking or non-current smoking status.
Weight and height were measured using a balanced beam scale and a vertical ruler, respectively, with participants wearing light clothing and no shoes. Height was recorded to the nearest 0.5 cm and weight to the nearest 0.5 lb. Body-mass index (BMI) was calculated as weight (kg) divided by height squared (m2). Waist circumference was measured at the minimum abdominal girth and the hip circumference was measured at the level of the symphysis pubis and maximum protrusion of the buttocks. All anthropometric measures were taken in duplicate and averaged. Diabetes status was defined according to the 2003 American Diabetes Association criteria as fasting glucose ≥7.0 mmol/L (126 mg/dL) or use of hypoglycemic medication (oral agents and/or insulin). Impaired fasting glucose was defined as a fasting glucose of 5.5–6.9 mmol/L (100–125 mg/dL) (American Diabetes Association, 2010). Depressive symptoms were assessed using The Center for Epidemiologic Studies Depression (CES-D) Scale, a 20-item questionnaire aimed at measuring depression symptoms in community populations (Radloff, 1977) and elevated depressive symptoms were defined as a CES-D score ≥16, consistent with mild-to-moderate depression or dysthymia (Beekman et al., 1997).
1.4. Statistical analysis
1.4.1. Derivation of salivary cortisol curve variables
Cortisol secretion has a well-documented circadian pattern typified by a rapid early morning peak within 30–45 min after waking followed by a decline throughout the remainder of the day (Edwards et al., 2001; Levine et al., 2007). For each of three days of sampling, we computed the most commonly used features of the circadian rhythm as follows. Prior to constructing cortisol curve features, cortisol values were log-transformed. The wake up value was the first sample taken on each day recorded by the track caps (Fig. 1). The CAR was computed as the difference in cortisol from wake time to 30 min post-awakening (the second sample; Fig. 1). The “early decline” slope in cortisol was calculated by estimating a regression line using samples taken between 20 and 150 min post-awakening. The “late decline” slope in cortisol was calculated by estimating a regression line using only samples taken after 120 min post-awakening and prior to 16 h post-awakening (Ranjit et al., 2009; Fig. 1). We also calculated area under the curve (AUC) summary measures to estimate the total amount of cortisol exposure during three portions of the diurnal cortisol cycle: CAR AUC (wake to 30 min post awake), early decline (30 min to 2 h post awake), late decline (2–16 h post awake), and overall AUC (sum of the prior three; see Fig. 1). The AUC summary measures were computed using the trapezoidal rule and represented the AUC with respect to increase (Pruessner et al., 2003). Using the 30 min and 2 h post awakening in our analysis is similar to our previously used models for salivary cortisol modeling (Ranjit et al., 2009) where the curve as a whole is modeled using piecewise linear splines with knots at 30 and 120 min post awakening. Measures were estimated separately for each day and averaged across days for descriptive analyses.
Figure 1.
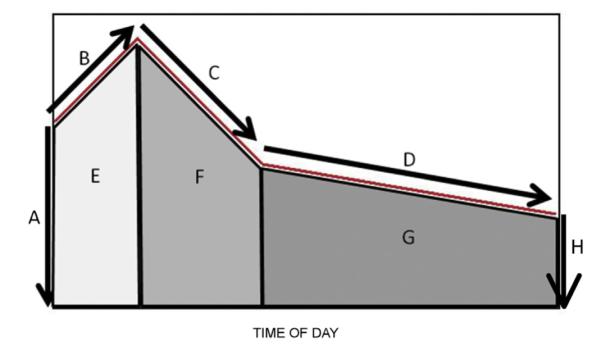
Summary of diurnal cortisol curve. Key: A: awakening cortisol at time zero; B: cortisol awakening response (CAR) denoting rise from awakening to 30 min post-awakening; C: early decline from 30 min post-awakening to 2 h post-awakening; D: late decline from 2 h post-awakening to bedtime; E: area under curve (AUC) for CAR; F: AUC for early decline; G: AUC for late decline; the full AUC is the sum E + F + G. From: Champaneri et al. (2012).
1.4.2. Correlation analyses
Correlations between any pair of cortisol features were estimated by fitting a repeated measures model with a semi-structured covariance matrix. The repeated outcome measures for the model were the pair of measures over three days (e.g., CARi1, Wakeupi1, CARi2, Wakeupi2, CARi3, Wakeupi3, where i denotes subject and the second subscript denotes day). The covariance matrix for the model consisted of three equal blocks of 2 × 2 matrices on the diagonal, denoting equal variances and covariances between the features across days, with the rest of the 6 × 6 covariance matrix being unstructured (see appendix for more details). This approach is advantageous because it allows us to estimate the correlations between any pair of features on a given day by pooling data across multiple days of measurement, but without the need to first average features across days, and without making assumptions on the correlations between the features across different days. Unadjusted correlations between CAR and the other features were computed, followed by partial correlations after adjustment for age, race/ethnicity, and sex. Correlations and adjusted/partial correlations were computed (versus regression coefficients) to enable the direct comparison of relative strength of associations between each feature and CAR. Additional adjustment for diabetes, medications that might affect cortisol levels (e.g. beta-blockers, hormone replacement therapy in women) (Granger et al., 2009), socioeconomic status (wealth index), BMI, and cigarette smoking as potential confounders in hormonal status were done. We chose these adjustments because we have previously shown that CAR and other cortisol curve components are influenced by race/ethnicity (Hajat et al., 2010), wealth index (Hajat et al., 2010), diabetes status (Champaneri et al., 2012) and BMI (Champaneri et al., 2013).
We performed identical analyses to determine the association between total AUC, as a measure of total daily cortisol secretion, and other cortisol curve parameters. Because models were estimated using maximum likelihood, all available data from individuals, including those with partially missing data, were used in the analyses. We performed 16 tests of correlations in our primary analyses – between AUC and other cortisol curve features (8 comparisons), and CAR and other cortisol curve features (8 comparisons). Therefore, in all of our analyses, a two-sided Bonferroni-corrected P-value of <0.003 (P = 0.05/16) was considered statistically significant. All the analyses were carried out using SAS version 9.2 (Cary, NC).
2. Results
2.1. Baseline characteristics
Baseline characteristics of the study participants are summarized in Table 1. The mean age was 65 years (median 65 years; interquartile range 57–73 years), approximately half of the participants were women and Hispanic and had completed education beyond high school or its equivalent. The mean BMI was 29 kg/m2. Approximately 18% of individuals had elevated depressive symptoms, 10% were current smokers, 39% had impaired fasting glucose or diabetes, 16% were treated with beta-blockers, and 9% of women were taking hormone replacement therapy. The raw and derived cortisol measures for the cohort are summarized in Table 2.
Table 1.
Descriptive characteristics of study population (n = 935 unless otherwise stated).
| Characteristic | Mean (standard deviation) or % |
|---|---|
| Age (years) | 65.3 (9.8) |
| Sex | |
| Female (n = 482) | 51.6% |
| Male (n = 453) | 48.4% |
| Race/ethnicity | |
| White (n = 183) | 19.6% |
| Black (n = 258) | 27.6% |
| Hispanic (n = 494) | 52.8% |
| Education | |
| ≤High School/GED (n = 449) | 48.0% |
| Some college to associate (n = 264) degree |
28.3% |
| ≥Bachelors degree (n = 222) | 23.6% |
| Income | |
| <$5000 (n = 25) | 2.64% |
| $5000–7999 (n = 48) | 5.17% |
| $8000–11,999 (n = 72) | 7.70% |
| $12,000–15,999 (n = 80) | 8.58% |
| $16,000–19,999 (n = 65) | 6.93% |
| $20,000–24,999 (n = 79) | 8.47% |
| $25,000–29,999 (n = 71) | 7.59% |
| $30,000–34,999 (n = 86) | 9.24% |
| $35,000–39,999 (n = 56) | 6.05% |
| $40,000–49,000 (n = 90) | 9.68% |
| $50,000–74,999 (n = 121) | 12.9% |
| $75,000–99,999 (n = 60) | 6.38% |
| ≥$100,000 (n = 82) | 8.69% |
| Body mass index (kg/m2) | 29.0 (5.7) |
| Waist circumference (cm) | 100.4 (14.7) |
| Center for Epidemiological Studies | |
| Depression (CES-D) Scale score, (n = 933)a | 6 (3, 12) |
| CES-D ≥16, (n = 933) | 18.4% |
| Wake up time (am) | 6:39 (1.16) |
| Smoking status | |
| Non-current (n = 855) | 91.4% |
| Current (n = 80) | 8.6% |
| Fasting glucose status | |
| Normal (n = 576) | 61.6% |
| Impaired fasting glucose (n = 197) | 21.1% |
| Diabetes (n = 162) | 17.3% |
| Beta blocker use (n = 144) | 15.8% |
| Hormone replacement therapy use (among women) (n = 505) | |
| User | 8.9% |
| Non-user | 91.1% |
Median (interquartile range).
Table 2.
Summary of cortisol parameters.
| Cortisol variable | n | Median | Interquartile range |
|---|---|---|---|
| Wake up cortisol (ng/mL) | 926 | 12.27 | 8.73, 16.55 |
| Wake up + 30 min cortisol (ng/mL) | 924 | 17.07 | 12.36, 23.34 |
| 10 am cortisol (ng/mL) | 921 | 7.81 | 5.75, 10.66 |
| Before lunch cortisol (ng/mL) | 920 | 6.07 | 4.42, 8.52 |
| Before dinner cortisol (ng/mL) | 920 | 3.06 | 2.01. 4.65 |
| Bedtime cortisol (ng/mL) | 922 | 2.14 | 1.32, 3.49 |
| Wake up (A), log(CU) | 926 | 2.44 | 2.12, 2.75 |
| Bedtime (H), log(CU) | 922 | 0.65 | 0.18, 1.12 |
| Early decline slope (C), log(CU) | 265 | −0.42 | −0.59, −0.22 |
| Late decline slope (D), log(CU) | 932 | −0.64 | −0.88, −0.43 |
| CAR, log(CU) | 867 | 0.36 | 0.08, 0.65 |
| Total AUC (E + F + G), log(CU) | 913 | 1.53 | 1.26, 1.80 |
| CAR AUC (E), log(CU) | 906 | 2.61 | 2.28, 2.88 |
| Early decline AUC (F), log(CU) | 906 | 2.58 | 2.30, 2.85 |
| Late decline AUC (G), log(CU) | 910 | 1.39 | 1.11, 1.69 |
AUC: area under the curve; CAR: cortisol awakening response; CU: cortisol unit.
2.2. Association of CAR with diurnal cortisol profile features
In analyses adjusted for wake-up time, age, sex, race/ethnicity, diabetes status, smoking, beta blocker use, BMI, wealth index, and depressive symptoms, CAR showed a significant inverse association with the wake-up cortisol and the CAR AUC, indicating that a higher CAR was associated with a lower wake-up cortisol and lower CAR AUC (Table 3). The CAR was positively associated with the early decline AUC, indicating that a higher CAR was associated with higher cortisol exposure in the morning hours from 30 min to 2 h post-awakening (Table 3). Associations of CAR with bedtime cortisol, cortisol slope, and late decline AUC were weak and CAR was not associated with total AUC in any models, suggesting that it is not correlated with total cortisol secretion (Table 3). While there were some variations in the associations by sex and race/ethnicity, CAR did not correlate with total AUC in sex and race/ethnic strata and the inverse association of CAR with wake-up cortisol was significant and robust across sex and race/ethnic strata (see Supplemental Table 1). Associations were of similar, magnitude, direction, and statistical significance in older (age > 65 years) versus younger (age ≤ 65 years) adults (Supplemental Table 2). All results were unchanged following adjustment for hormone replacement therapy (data not shown).
Table 3.
Crude and adjusted correlations between CAR and other cortisol features measured on the same day.
| Cortisol curve feature (label in Fig. 1) |
Unadjusted a |
Partially adjusted b |
Fully adjustedc |
|||
|---|---|---|---|---|---|---|
| Correlation (95% CI) | P-Value | Correlation (95% CI) | P-Value | Correlation (95% CI) | P-Value | |
| Wake up (A) | −0.55 (−0.58 to −0.51) | <0.0001 | −0.55 (−0.59 to −0.52) | <0.0001 | −0.56 (−0.60 to −0.53) | <0.0001 |
| Bedtime (H) | −0.08 (−0.12 to −0.03) | <0.01 | −0.07 (−0.12 to −0.02) | <0.01 | −0.07 (−0.11 to −0.02) | 0.006 |
| Early decline slope (C) |
−0.19 (−0.29, −0.10) | <0.0001 | −0.19 (−0.29, −0.10) | <0.0001 | −0.19 (−0.29, −0.09) | 0.0002 |
| Late decline slope (D) |
−0.06 (−0.10 to −0.01) | 0.01 | −0.06 (−0.11 to −0.02) | 0.01 | −0.06 (−0.11 to −0.02) | 0.006 |
| Total AUC (E + F + G) |
0.02 (−0.03 to 0.07) | 0.52 | 0.03 (−0.02 to 0.08) | 0.28 | 0.04 (−0.01 to 0.09) | 0.13 |
| CAR AUC (E) | −0.17 (−0.22 to −0.12) | <0.0001 | −0.18 (−0.23 to −0.13) | <0.0001 | −0.18 (−0.23 to −0.13) | <0.0001 |
| Early decline AUC (F) |
0.37 (0.33 to 0.41) | <0.0001 | 0.38 (0.33 to 0.42) | <0.0001 | 0.38 (0.34 to 0.43) | <0.0001 |
| Late decline AUC (G) |
−0.01 (−0.06 to 0.04) | 0.57 | 0.00 (−0.05 to 0.05) | 0.98 | 0.01 (−0.04 to 0.06) | 0.83 |
Only adjusted for wake up time.
Adjusted for wake up time, age, sex, race/ethnicity.
Partially adjusted + diabetes status, smoking, use of beta blockers, body mass index, income, education, Center for Epidemiological Studies Depression scale (CES-D) score.
2.3. Association of total cortisol AUC with diurnal cortisol profile features
In analyses adjusted for wake-up time, age, sex, race/ethnicity, diabetes status, smoking, beta blocker use, BMI, wealth index, and depressive symptoms, the total AUC showed a significant positive association with wake-up cortisol and bedtime cortisol (Table 4). Not surprisingly, total AUC correlated positively with individual AUC components—CAR AUC and both early and late decline AUC. Total AUC did not correlate with CAR. Associations were of similar magnitude, direction, and statistical significance when results were stratified by sex, race/ethnicity, and age (see Supplemental Tables 3 and 4). All results were unchanged following adjustment for hormone replacement therapy (data not shown).
Table 4.
Crude and adjusted correlations between total cortisol AUC and other cortisol features measured on the same day.
| Feature | Unadjusted a |
Partially adjusted b |
Fully adjusted c |
|||
|---|---|---|---|---|---|---|
| Correlation (95% CI) | P-Value | Correlation (95% CI) | P-Value | Correlation (95% CI) | P-Value | |
| Wake up (A) | 0.39 (0.34 to 0.43) | <0.0001 | 0.36 (0.32 to 0.41) | <0.0001 | 0.36 (0.32 to 0.4) | <0.0001 |
| Bedtime (H) | 0.64 (0.61 to 0.66) | <0.0001 | 0.61 (0.58 to 0.64) | <0.0001 | 0.61 (0.58 to 0.64) | <0.0001 |
| Early decline slope (C) | 0.11 (−0.01 to 0.23) | 0.076 | 0.11 (−0.02 to 0.24) | 0.080 | 0.12 (−0.02 to 0.25) | 0.086 |
| Late decline slope (D) | 0.21 (0.16 to 0.26) | <0.0001 | 0.19 (0.14 to 0.24) | <0.0001 | 0.18 (0.13 to 0.23) | <0.0001 |
| Total AUC (E + F + G) | 0.02 (−0.03 to 0.07) | 0.50 | 0.03 (−0.02 to 0.08) | 0.28 | 0.04 (−0.01 to 0.09) | 0.13 |
| CAR AUC (E) | 0.44 (0.40 to 0.48) | <0.0001 | 0.42 (0.38 to 0.46) | <0.0001 | 0.42 (0.38 to 0.46) | <0.0001 |
| Early decline AUC (F) | 0.55 (0.52 to 0.59) | <0.0001 | 0.54 (0.5 to 0.57) | <0.0001 | 0.54 (0.50 to 0.58) | <0.0001 |
| Late decline AUC (G) | 0.99 (0.99 to 0.99) | <0.0001 | 0.99 (0.99 to 0.99) | <0.0001 | 0.99 (0.99 to 0.99) | <0.0001 |
Only adjusted for wake up time.
Adjusted for wake up time, age, sex, race/ethnicity.
Partially adjusted + diabetes status, smoking, use of beta blockers, body mass index, income, education, Center for Epidemiological Studies Depression scale (CES-D) score.
2.4. Subsidiary analysis
Because some studies have suggested a lower upper cut-off for high salivary cortisol values >50 nmol/L (Nicolson et al., 2010), we performed a subsidiary analysis excluding samples with cortisol values between 50 and 100 nmol/L. There were 108 samples (out of 15,774 samples) with cortisol values between 50 and 100 nmol/L, which represented 0.7% of all the samples. The 108 samples were distributed across 85 days. In this subsidiary analysis excluding data from these 85 days, the magnitude, direction, and significance of our associations were unchanged (data not shown).
3. Discussion
The CAR was associated with a lower wake-up cortisol and higher cortisol exposure during the early period of the day but was not associated with the late cortisol slope or other diurnal cortisol curve components. We found that three diurnal cortisol curve components—wake-up cortisol, bedtime cortisol, and CAR AUC—were positively correlated with total cortisol AUC. Of the three measures, the bedtime cortisol was most strongly correlated with total cortisol AUC (i.e., the confidence interval for this correlation did not overlap the confidence intervals for the correlation of wake-up and CAR AUC with total AUC), suggesting that it may be a marker of daily cortisol exposure. In contrast, the CAR (cortisol rise from awakening to 30 min post-awake), was not associated with total cortisol AUC, suggesting that it likely reflects a distinct component of HPA axis activity other than overall total cortisol exposure. These associations were the same among men and women and among Whites, African Americans, and Hispanic Americans.
Cumulative cortisol burden is known to influence neuropsychiatric and metabolic disorders. As summarized recently, population-based studies have been hampered in exploring the HPA axis as a mediator in the association between chronic stress and metabolic disorders, such as diabetes, obesity, cardiovascular disease, because of difficulty identifying single cortisol measure that reflects cortisol burden (Golden et al., 2011). Our results suggest that the bedtime cortisol, collected around 2300 h, at least partly reflects total cortisol exposure. Although the wake-up salivary cortisol was correlated with total cortisol AUC, it has been shown in other studies to have lower intra-individual reliability (r = 0.33–0.67) than the 2300 h salivary cortisol (r = 0.78) (Golden et al., 2011). Thus, bedtime cortisol levels should be considered as a potential proxy of total daily cortisol exposure, which can be used as a compliment to the CAR in population-based studies, behavioral science research, and clinical settings.
Based on our data, the CAR did not correlate with total cortisol AUC and may instead reflect the adrenal capacity to respond to stress (Pruessner et al., 1997) and awakening (Wilhelm et al., 2007). Similar to a prior study that found a positive cross-sectional association between the CAR AUC and 12-h mean diurnal cortisol collected over two days (Edwards et al., 2001), we found a positive cross-sectional association between CAR AUC and total diurnal cortisol AUC. Our findings corroborate those of a smaller study which also failed to find a cross-sectional association between CAR and integrated 12-h cortisol measured every 15 min (Schmidt-Reinwald et al., 1999). The CAR, however, is a well-established measure of HPA axis function used in bio-behavioral research (Pruessner et al., 1997). Thus, taken together, our findings and those of other investigators would suggest that adding the bedtime cortisol to the CAR in clinical and population-based research studies would allow simultaneous estimation of an individual’s awakening cortisol responsiveness, total daily cortisol exposure and diurnal slope (difference between the bedtime and awakening cortisol), capturing several important components of HPA axis function. Although needing to be confirmed in a larger population, Kraemer et al. (2006) showed that the diurnal slope from two samples collected at awakening and 9 pm correlated very strongly with the slope calculated from collection of 5 daily samples.
Our study has several strengths. First, to our knowledge, it is one of the largest studies with data on the diurnal salivary cortisol curve to determine which individual components reflect total cortisol exposure. Second, salivary cortisol sample collection included the use of track caps for recording sample times to increase compliance in sample collection. Third, salivary cortisol sample collection occurred over 3 days, allowing a more accurate determination of the underlying diurnal cortisol pattern for each participant. Fourth, we were able to adjust for potentially confounding variables using data collected in MESA. Finally, our sample was multiethnic and we were able to determine which cortisol measures demonstrated robust associations with total AUC and CAR across sex and race/ethnicity.
Our findings, however, should be interpreted in light of its limitations. First, this was a cross-sectional study, so we cannot determine whether bedtime cortisol collected at the current visit will predict higher cortisol exposure longitudinally over time. This is an important limitation that warrants follow-up using longitudinal data. Also some studies defined CAR as the awakening cortisol plus 15, 30, 45 and 60 min cortisol samples (Schmidt-Reinwald et al., 1999; Edwards et al., 2001; Pruessner et al., 2003; Fekedulegn et al., 2007). This more comprehensive interrogation of the CAR makes it difficult to compare our results to all studies examining the association of CAR and CAR AUC to total daily cortisol secretion. Thus, our conclusions regarding the CAR AUC should be interpreted with some caution as we only had two time points on which to base its calculation. Prior studies have also shown lower CAR in non-adherent compared to adherent participants (Kudielka et al., 2007, 2012); however, in our population, inferences regarding the association of the CAR with sociodemographic factors were unchanged using the track caps versus self-reported times (data not shown). We used cotton swabs for saliva collection, which may result in lower cortisol retrieval (Kudielka et al., 2012); however, this was true of all samples and should not have affected our inferences. Some medications can theoretically affect salivary cortisol levels (Granger et al., 2009), and our study only had data on a subset of these. Finally, our study population was older and heavier than many, which may limit generalizability to other populations.
In summary, the CAR appears to represents something different than total daily cortisol exposure. To measure daily cortisol secretion, our data suggests that the bedtime or 2300 h cortisol should be used as it correlates with total cortisol AUC and has been shown to be a reliable measure over time. The use of bedtime cortisol in conjunction with the CAR allows simultaneous assessment of daily cortisol exposure and diurnal slope (awakening to bedtime cortisol). Incorporating such measures into on-going population-based, longitudinal studies will help to expand our understanding of the role of the HPA axis in the association of acute and chronic stress with metabolic disorders.
Supplementary Material
Acknowledgements
The authors thank the other investigators, the staff, and the participants of the MESA study for their valuable contributions. A full list of participating MESA investigators and institutions can be found at http://www.mesa-nhlbi.org.
Role of funding sources Grants/fellowships: MESA was supported by contracts NO1-HC-95159 through NO1-HC-95165 and NO1-HC-95169 from the National Heart, Lung, and Blood Institute. MESA Stress Study was supported by RO1 HL10161-01A1 and R21 DA024273 (PI: Dr. Diez-Roux).
The funding agency (NHLBI) reviews all manuscripts following internal review and approval by the MESA Publications Committee and approved the manuscript to be submitted for journal review. The NHLBI had no further role in the study design, collection, analysis and interpretation of data, or writing of the manuscript.
Footnotes
Contributors S. Golden wrote the first draft of the manuscript and designed and interpreted the analyses. B. Sanchez wrote the analytic program for the analyses and supervised M. Wu, who performed the statistical analyses. A. Diez Roux obtained funding, designed and wrote the protocol for the MESA Stress Study, and critically reviewed the manuscript. A. Diez Roux and T. Seeman were involved in data collection for MESA Stress. All authors contributed to critical manuscript revisions and have approved the final manuscript.
Author disclosures S. Golden, B. Sanchez, M. Wu, S. Champaneri, T. Seeman, and G. Wand have nothing to disclose. A. Diez Roux is funded by a research grant from NIH-NHLBI that supports MESA Stress.
Appendix A. Supplementary data Supplementary material related to this article can be found, in the online version, at http://dx.doi.org/10.1016/j.psyneuen.2013.06.032.
References
- American Diabetes Association Diagnosis and Classification of Diabetes Mellitus. Diabetes Care. 2010;33(Suppl. 1):S62–S69. doi: 10.2337/dc10-S062. [DOI] [PMC free article] [PubMed] [Google Scholar]
- Badrick E, Kirschbaum C, Kumari M. The relationship between smoking status and cortisol secretion. J. Clin. Endocrinol. Metab. 2007;92(3):819–824. doi: 10.1210/jc.2006-2155. [DOI] [PubMed] [Google Scholar]
- Beekman AT, Deeg DJ, van Limbeek J, Braam AW, DeVries MA, Van Tilburg W. Criterion validity of the Center for Epidemiological Studies Depression Scale (CES-D): results from a community-based sample of older subjects in the Netherlands. Psychol. Med. 1997;27:231–235. doi: 10.1017/s0033291796003510. [DOI] [PubMed] [Google Scholar]
- Bild DE, Bluemke DA, Burke GL, Detrano R, Diez Roux AV, Folsom AR, Greenland P, Jacob DR, Jr., Kronmal R, Lui K, Nelson JC, O’Leary D, Saad MF, Shea S, Szklo M, Tracy RP. Multi-ethnic study of atherosclerosis: objectives and design. Am. J. Epidemiol. 2002;156(9):871–881. doi: 10.1093/aje/kwf113. [DOI] [PubMed] [Google Scholar]
- Bruehl H, Wolf OT, Convit A. A blunted cortisol awakening response and hippocampal atrophy in type 2 diabetes mellitus. Psychoneuroendocrinology. 2009;34:815–821. doi: 10.1016/j.psyneuen.2008.12.010. [DOI] [PMC free article] [PubMed] [Google Scholar]
- Champaneri S, Wand GS, Malhotra SS, Casagrande SS, Golden SH. Biological basis of depression in adults with diabetes. Curr. Diab. Rep. 2010;10(6):396–405. doi: 10.1007/s11892-010-0148-9. [DOI] [PubMed] [Google Scholar]
- Champaneri S, Xu X, Carnethon MR, Bertoni AG, Seeman T, Diez Roux A, Golden SH. Diurnal salivary cortisol and urinary catecholamines are associated with diabetes mellitus: the multi-ethnic study of atherosclerosis. Metabolism. 2012;61:986–995. doi: 10.1016/j.metabol.2011.11.006. [DOI] [PMC free article] [PubMed] [Google Scholar]
- Champaneri S, Xu X, Carnethon MR, Bertoni AG, Seeman T, DeSantis AS, Diez Roux A, Shrager S, Golden SH. Diurnal salivary is associated with body mass index and waist circumference: the Multi-Ethnic Study of Atherosclerosis. Obesity. 2013;21(1):E56–E63. doi: 10.1002/oby.20047. [DOI] [PMC free article] [PubMed] [Google Scholar]
- Edwards S, Clow A, Evans P, Hucklebridge F. Exploration of the awakening cortisol response in relation to diurnal cortisol secretory activity. Life Sci. 2001;68(18):2093–2103. doi: 10.1016/s0024-3205(01)00996-1. [DOI] [PubMed] [Google Scholar]
- Fekedulegn DB, Andrew ME, Buchfiel CM, Viiolanti JM, Hartley TA, Charles LE, Miller DB. Area under the curve and other summary indicators of repeated cortisol measurements. Psychosom. Med. 2007;69:651–659. doi: 10.1097/PSY.0b013e31814c405c. [DOI] [PubMed] [Google Scholar]
- Golden SH, Wand GS, Malhotra S, Kamel I, Horton K. Reliability of hypothalamic–pituitary–adrenal axis assessment methods for use in population-based studies. Eur. J. Epidemiol. 2011;26(7):511–525. doi: 10.1007/s10654-011-9585-2. [DOI] [PMC free article] [PubMed] [Google Scholar]
- Granger DA, Hibel LC, Fortunato CK, Kapelewski CH. Medication effects on salivary cortisol: tactics and strategy to minimize impact in behavioral and developmental science. Psychoneuroendocrinology. 2009;34(10):1437–1448. doi: 10.1016/j.psyneuen.2009.06.017. [DOI] [PubMed] [Google Scholar]
- Hajat A, Diez-Roux A, Franklin TG, Seeman T, Shrager S, Ranjit N, Castro C, Watson K, Sanchez B, Kirschbaum C. Socioeconomic and race/ethnic differences in daily salivary cortisol profiles: the multi-ethnic study of atherosclerosis. Psychoneuroendocrinology. 2010;35(6):932–943. doi: 10.1016/j.psyneuen.2009.12.009. [DOI] [PMC free article] [PubMed] [Google Scholar]
- Huber TJ, Issa K, Schik G, Wolf OT. The cortisol awakening response is blunted in psychotherapy inpatients suffering from depression. Psychoneuroendocrinology. 2006;31(7):900–904. doi: 10.1016/j.psyneuen.2006.03.005. [DOI] [PubMed] [Google Scholar]
- Kraemer HC, Giese-Davis J, Yutsis M, O’Hara R, Neri E, Gallagher-Thompson D, Taylor CB, Spiegel D. Design decisions to optimize reliability of daytime cortisol slopes in an older population. Am. J. Geriatr. Psychiatry. 2006;14:325–333. doi: 10.1097/01.JGP.0000201816.26786.5b. [DOI] [PubMed] [Google Scholar]
- Kudielka BM, Wust S. Human models in acute and chronic stress: assessing determinants of individual hypothalamus–pituitary–adrenal axis activity and reactivity. Stress. 2010;13(1):1–14. doi: 10.3109/10253890902874913. [DOI] [PubMed] [Google Scholar]
- Kudielka BM, Broderick JE, Kirschbaum C. Compliance with saliva sampling protocols: electronic monitoring reveals invalid cortisol daytime profiles in noncompliant subjects. Psychosom. Med. 2003;65:313–319. doi: 10.1097/01.psy.0000058374.50240.bf. [DOI] [PubMed] [Google Scholar]
- Kudielka BM, Hawkley LC, Adam EK, Cacioppo JT. Compliance with ambulatory saliva sampling in the Chicago Health, Aging, and Social Relations Study and associations with social support. Ann. Behav. Med. 2007;34:209–216. doi: 10.1007/BF02872675. [DOI] [PubMed] [Google Scholar]
- Kudielka BM, Gierens A, Hellhammer DH, Wust S, Schlotz W. Salivary cortisol in ambulatory assessment—some dos, some don’ts, and some open questions. Psychosom. Med. 2012;74:418–431. doi: 10.1097/PSY.0b013e31825434c7. [DOI] [PubMed] [Google Scholar]
- Kumari M, Shipley M, Stafford M, Kivimaki M. Association of diurnal patterns in salivary cortisol with all-cause and cardiovascular mortality: findings from the Whitehall II Study. J. Clin. Endocrinol. Metab. 2011;96(5):1478–1485. doi: 10.1210/jc.2010-2137. [DOI] [PMC free article] [PubMed] [Google Scholar]
- Levine A, Zagoory-Sharon O, Feldman R, Lewis JG, Weller A. Measuring cortisol in human psychobiological studies. Physiol. Behav. 2007;90:43–53. doi: 10.1016/j.physbeh.2006.08.025. [DOI] [PubMed] [Google Scholar]
- Mangold D, Wand G, Javors M, Mintz J. Acculturation, childhood trauma and the cortisol awakening response in Mexican-American adults. Horm. Behav. 2010;58(4):637–646. doi: 10.1016/j.yhbeh.2010.06.010. [DOI] [PMC free article] [PubMed] [Google Scholar]
- Nicolson NA, Davis MC, Kruszewski D, Zautra AJ. Childhood maltreatment and diurnal cortisol patterns in women with chronic pain. Psychosom. Med. 2010;72(5):471–480. doi: 10.1097/PSY.0b013e3181d9a104. [DOI] [PubMed] [Google Scholar]
- Pruessner JC, Wolf OT, Hellhammer DH, Buske-Kirschbaum A, von Auer K, Jobst S, Kaspers F, Kirschbaum C. Free cortisol levels after awakening: a reliable biological marker for the assessment of adrenocortical activity. Life Sci. 1997;61(26):2539–2549. doi: 10.1016/s0024-3205(97)01008-4. [DOI] [PubMed] [Google Scholar]
- Pruessner JC, Kirschbaum C, Meinlsmidt G, Hellhammer DH. Two formulas for computation of the area under the curve represent measures of total hormone concentration versus time-dependent change. Psychoneuroendocrinology. 2003;28:916–931. doi: 10.1016/s0306-4530(02)00108-7. [DOI] [PubMed] [Google Scholar]
- Radloff LS. The CES-D scale: a self-report depression scale for research in the general population. Appl. Psych. Meas. 1977;1:385–401. [Google Scholar]
- Ranjit N, Diez-Roux AV, Sanchez B, et al. Association of salivary cortisol circadian pattern with cynical hostility: multiethnic study of atherosclerosis. Psychosom. Med. 2009;71(7):748–755. doi: 10.1097/PSY.0b013e3181ad23e7. [DOI] [PMC free article] [PubMed] [Google Scholar]
- Schmidt-Reinwald A, Pruessner JC, Hellhammer DH, Federenko I, Rohleder N, Schurmeyer TH, Kirschbaum C. The cortisol response to awakening in relation to different challenge tests and a 12-hour cortisol rhythm. Life Sci. 1999;64(18):1653–1660. doi: 10.1016/s0024-3205(99)00103-4. [DOI] [PubMed] [Google Scholar]
- Steptoe A, Kunz-Ebrecht SR, Brydon L, Wardle J. Central adiposity and cortisol responses to waking in middle-aged men and women. Int. J. Obes. Relat. Metab. Disord. 2004;28(9):1168–1173. doi: 10.1038/sj.ijo.0802715. [DOI] [PubMed] [Google Scholar]
- Stetler C, Miller GE. Depression and hypothalamic–pituitary–adrenal activation: a quantitative summary of four decades of research. Psychosom. Med. 2011;73(2):114–126. doi: 10.1097/PSY.0b013e31820ad12b. [DOI] [PubMed] [Google Scholar]
- Therrien F, Drapeau V, Lalonde J, Lupien SJ, Beaulieu S, Tremblay A, Richard D. Awakening cortisol response in lean, obese, and reduced obese individuals: effect of gender and fat distribution. Obesity. 2007;15(2):377–385. doi: 10.1038/oby.2007.509. [DOI] [PubMed] [Google Scholar]
- Vogelzangs N, Beekman AT, Milaneschi Y, Bandinelli S, Ferrucci L, Penninx BW. Urinary cortisol and six-year risk of all-cause and cardiovascular mortality. J. Clin. Endocrinol. Metab. 2010;95(11):4959–4964. doi: 10.1210/jc.2010-0192. [DOI] [PMC free article] [PubMed] [Google Scholar]
- Wallerius S, Rosmond R, Ljung T, Holm G, Bjorntorp P. Rise in morning saliva cortisol is associated with abdominal obesity in men: a preliminary report. J. Endocrinol. Invest. 2003;26(7):616–619. doi: 10.1007/BF03347017. [DOI] [PubMed] [Google Scholar]
- Wilhelm I, Born J, Kudielka BM, Schlotz W, Wust S. Is the cortisol awakening rise a response to awakening? Psychoneuroendocrinology. 2007;32:358–366. doi: 10.1016/j.psyneuen.2007.01.008. [DOI] [PubMed] [Google Scholar]
Associated Data
This section collects any data citations, data availability statements, or supplementary materials included in this article.