Abstract
Organic Anion Transporters (OATs, SLC22) interact with a remarkably diverse array of endogenous and exogenous organic anions. However, little is known about the structural features that determine their substrate selectivity. We examined the substrate binding preferences and transport function of olfactory organic anion transporter, Oat6, in comparison to the more broadly expressed transporter, Oat1 (first identified as NKT). In analyzing interactions of both transporters with over forty structurally diverse organic anions, we find a correlation between organic anion potency (pKi) and hydrophobicity (LogP) suggesting a hydrophobicity-driven association with transporter binding sites, which appears particularly prominent for Oat6. On the other hand, organic anion binding selectivity between Oat6 and Oat1 is influenced by the anion mass and net charge. Smaller mono-anions manifest greater potency for Oat6 and di-anions for Oat1. Comparative Molecular Field Analysis (CoMFA) confirms these mechanistic insights and provides a model for predicting new OAT substrates. By CoMFA, both hydrophobic and charged interactions contribute to Oat1 binding, whereas it is predominantly the former that contributes to Oat6 binding. Together, the data suggest that, although the 3-dimensional structures of these two transporters may be very similar, the binding pockets exhibit crucial differences. Furthermore, for six radiolabeled substrates, we assessed transport efficacy (Vmax) for Oat6 and Oat1. Binding potency and transport efficacy had little correlation, suggesting that different molecular interactions are involved in substrate binding to the transporter and translocation across the membrane. Substrate specificity to a particular transporter may enable design of drugs for targeting to specific tissues (e.g., olfactory mucosa). We also discuss how these data suggest a possible mechanism for remote sensing between OATs in different tissue compartments (e.g., kidney, olfactory mucosa) via organic anions.
The proximal tubule of the mammalian kidney rapidly clears a very large number of structurally diverse small organic anions from the circulation (1). While several organic anion transporter proteins (OATs) are expressed in the kidney (2), it appears, on the basis of in vivo studies in knockout mice, that one among these, Oat1, is responsible for the bulk of renal secretion of organic anions (3). There are numerous studies reporting the interaction of Oat1 with diverse groups of substrates, particularly various categories of drugs (e.g., non-steroidal anti-inflammatory drugs, β-lactam antibiotics, diuretics, reviewed in (4)); however, there has not been a comprehensive examination of substrate preferences within a single study, or clear mechanistic insight into the structural requirements for transport by OATs.
Oat6 is a close phylogenetic relation of Oat1, first identified as NKT (5–8). Uniquely among the OATs, it appears absent from the kidney but instead expressed in olfactory mucosa (9,10). In addition to different tissue localization, substrate discrimination between the two transporters (10) may reflect their distinctive physiological functions. Both Oat1 and Oat6 interact (though with different affinity) with organic anions implicated in urinary odortype specification (i.e., those contributing to the urinary odors and thus helping mice distinguish different individuals) (3,10). This raises the possibility that odorants secreted into the urine via one OAT might be absorbed and/or sensed in the olfactory mucosa via another OAT (10). Furthermore, Oat6 or similar transporters might mediate nasal absorption of some of the organic anionic drugs that are also substrates for other SLC22 family transporters. This could allow for intranasal administration as an alternate route of drug delivery that might bypass the blood-brain barrier, suggesting the possibility of selective drug targeting for enhanced brain delivery (11–13).
To characterize the multispecificity of OATs, two kinds of substrate-transporter interaction should be analyzed separately: (1) interactions leading to the substrate association with the transporter binding site, and (2) interactions of the bound substrate within the binding site that affect transporter conformational dynamics and substrate translocation. Previous studies by Ullrich et.al, performed on whole kidney proximal tubules prior to the cloning and identification of the key transporters expressed at renal as well as extrarenal sites, assumed specific interactions between hydrophobic moieties of the substrate with particular hydrophobic residues within the transporter channel; furthermore, optimal substrates contained two carboxylates spaced 6–7 Ǻ́ apart (14). Aside from this work, which is focused on the whole kidney, no comprehensive studies have been carried out to clarify chemical space requirements for substrate specificity. Given the tremendous pharmacological relevance of the OATs, as well as their role in handling key metabolites in many different cells and tissues, it is important to define the structural basis for substrate preferences.
To address this issue, we have performed a detailed wet lab and computational characterization of the substrate binding preferences and transport function of Oat6 in comparison to those of Oat1, testing over 40 compounds for their interaction with and/or transport by these OATs. We first analyzed correlations of the binding preferences of these compounds with their one-dimensional property activities (hydrophobicity, net charge, and molecular mass). Next we extended these analyses by determining the 3D Quantitative Structure Activity Relationships (QSAR) of Oat1 and Oat6 binding using Comparative Molecular Field Analysis (CoMFA). In 3D-QSAR, differences in observed biological properties are correlated with determinations made by placing ligands in a 3-dimensional field box and evaluating the electrostatic (Coulombic interactions) and steric (van der Waals interactions) fields at regularly spaced grid points. This approach has been used with much success on other transporters (15) and in fact, can be used to predict the affinity of a ligand for a transporter.
Our experimental data together with computational analyses strongly support several novel conclusions regarding the structural determinants of OAT substrate selectivity, helping to explain the difference in Oat1 versus Oat6 substrate preferences and presumably reflecting specific differences in the transporter binding pockets. We find substrate potency (pKi) to be correlated with hydrophobicity (LogP) mainly in the case of Oat6, suggesting a hydrophobicity-driven association of organic anions with the transporter binding site. In contrast, substrate binding to Oat1 involves roughly equal contributions from hydrophobic and electrostatic interactions. Differences in substrate selectivity between Oat6 and Oat1 are influenced by ligand size and charge, rather than hydrophobicity, with smaller mono-anions manifesting a higher affinity for Oat6 and di-anions for Oat1. In addition, we determined the maximum uptake rates (Vmax) of six radiolabeled substrates for both transporters. Little correlation was found between Ki and Vmax, suggesting that, for these transporters different substrate characteristics influence binding to the transporter versus actual translocation across the membrane. The data suggests ways of targeting drugs to specific OATs and also a mechanism for remote sensing, via endogenous organic anions, between OAT-expressing tissue compartments.
EXPERIMENTAL PROCEDURES
Organic anions (OAT substrates and inhibitors)
[3H]-labeled OAT substrates – [3H]-p-aminohippurate (PAH, specific activity 4.2 Ci/mmol) and [3H]-estrone-3-sulfate (ES, 57 Ci/mmol) were purchased from Perkin-Elmer Life Sciences (Boston, MA); [3H]-ochratoxin A (15 Ci/mmol), [3H]-methotrexate (20 Ci/mmol), [3H]-ibuprofen (0.5 Ci/mmol) and [3H]-prostaglandin E2 (193.5 Ci/mmol) were obtained from American Radiolabeled Chemicals (St Louis, MO).
Unlabeled organic anions (potential substrates/inhibitors) were obtained from Sigma-Aldrich as free acids or sodium salts, and their stock solutions (100 mM) were prepared and adjusted to pH 7.4 as described previously (10).
LogP values (octanol-water partition coefficients) of the organic anions were calculated using Molinspiration software (16).
Uptake in Xenopus oocytes
Capped RNA was synthesized from linearized plasmid DNA (mOat6, Image clone ID: 6309674; mOat1, Image clone ID: 4163278) using mMessage mMachine in vitro transcription kit (Ambion, Inc., Austin, TX).
Xenopus oocyte uptake assays were performed as described previously (10). Briefly, oocytes were isolated and maintained in Barth's buffer (88 mM NaCl, 1 mM KCl, 0.33 mM Ca(NO3)2, 0.41 mM CaCl2, 0.82 mM MgSO4, 2.4 mM NaHCO3 and 10 mM HEPES, pH 7.4) supplemented with 5% fetal horse serum, 0.05 mg/ml gentamycin sulfate and 2.5 mM sodium pyruvate. The day after oocytes were harvested, cRNA solution (mOat6 or mOat1, 1 μg/μl) was injected into oocytes (23 nl/oocyte) using the Nanoliter 2000 nanoinjector (World Precision Instruments, Sarasota, FL). Two days after injection, oocytes were washed in serum-free Barth's buffer, and experimental groups of 20 to 30 oocytes each were placed in wells of a 24-well plate with 1 ml of Barth's buffer containing 1 μCi of a [3H]-labeled tracer ion and an unlabeled organic anion (tracer uptake inhibitor), with no inhibitor in a control group. After 1 hr incubation at room temperature, oocytes were washed three times with ice-cold Barth's buffer, each experimental group was divided into four samples of 5 to 8 oocytes, and radioactivity measured by scintillation counting.
Transport activity was calculated for [3H]-labeled tracers as tracer clearance from the incubation medium (CL = Vtransport/S), by dividing the amount of tracer absorbed per oocyte per unit time (Vtransport, cpm/oocyte/hr) by the tracer concentration in the incubation medium (S, cpm/μl). In all experiments, the background (non-OAT-mediated) tracer uptake was measured in uninjected oocytes (in preliminary experiments, uptake in water-injected and uninjected oocytes was not found to be significantly different). This background uptake (probably combining non-saturable tracer diffusion and endogenous transport expressed by the oocytes) was subtracted from the uptake measured in injected oocytes, to calculate the OAT-mediated component of uptake. In a typical experiment, the control (uninhibited) transporter-mediated tracer clearance was 0.35 to 0.9 μl/oocyte/hr for [3H]-ES uptake in Oat6-injected oocytes and 0.7 to 2.0 μl/oocyte/hr for [3H]-PAH uptake in Oat1-injected oocytes. This indicates that the percentage of tracer that is transported in one hour did not exceed 6% (assuming maximum experimental group size of 30 oocytes and maximum tracer clearance of 2.0 μl/oocyte/hr), so that the tracer concentration was practically constant during the incubation time. In all inhibition experiments, the uninhibited OAT-mediated clearance exceeded the background clearance of the same tracer in uninjected oocytes by at least 10-fold.
Calculations and statistics
In each experimental group, tracer clearance was calculated as Mean ± SE of quadruplicate samples (with exception of the control group which comprised eight samples). In uptake inhibition experiments, the OAT-mediated clearance (i.e., difference between cRNA-injected and uninjected oocytes) in the presence of an inhibiting organic anion was expressed as a percentage of the mean OAT-mediated clearance in the control group.
To determine potencies of organic anions (tested as tracer uptake inhibitors), tracer uptake was measured in the presence of increasing inhibitor concentration. For each organic anion, a series of 3 to 4 concentrations in successive 10-fold increments was tested. The inhibition data was considered sufficient for curve-fitting when the inhibitor concentration points spanned the interval comprising 50% inhibition. The tracer uptake-vs.-Log[inhibitor] data was fit in the one-site competition equation incorporated in Prism 4.0 software (GraphPad Inc., San Diego, CA), and Log(IC50) was calculated as Mean ± SE. The IC50 value was calculated as 10Mean and standard error for IC50 as SEIC50 = 10Mean − 10Mean−SE. Analysis of the uptake inhibition of [3H]-labeled tracer substrate (237 nM [3H]-PAH in Oat1-injected oocytes, or 17 nM [3H]-ES in Oat6-injected oocytes) by ‘cold’ PAH and ES yielded Kd values of 9.4 ± 1.1 μM and 58 ± 10 μM, respectively (10). These results indicate that the concentrations of both tracers in our uptake inhibition experiments were far below their Kd values, so that analyzing inhibition data using the Cheng-Prusoff equation (Ki = IC50/(1+[substrate]/Kd)) for all organic anions yielded Ki values not distinguishable from respective IC50 values (the differense being always significantly less than the standard error for IC50, data not shown). Based on these results, we used the calculated values of IC50 as inhibition constant (Ki) values and calculated organic anion potencies as pKi = −Log(Ki).
The maximum transporter-mediated uptake rate was determined for six [3H]-labeled substrates in Oat6- and Oat1-injected oocytes as Vmax = CL·(S+Ki) (see Results section for details). Standard error for Vmax was calculated as SEVmax = [SECL2·(S+Ki)2 + SEKi2·CL2]1/2.
Molecular modeling and alignment
Three-dimensional (3D) structure building was performed using SYBYL 7.1 (Sybyl). Energy minimizations were performed using the Tripos force field (17) and Gasteiger-Hückel charges with distance-dependent dielectrics and the conjugate gradient method with a convergence criterion of 0.001 kcal/mol. The most important requirement for Comparative Molecular Field Analysis (CoMFA) (18) is the structural overlap of the molecules to be analyzed to a suitable template, which is assumed to be a “bioactive conformation”. The 3D-coordinates of methotrexate were obtained from the protein data bank (PDB access ID: 1RX3) (19) and used as a template for the superimposition of all other molecules using the “Flexible Superposition” option in the FlexS (20) module of Sybyl.
Comparative Molecular Field Analysis (CoMFA) 3D-QSAR models
CoMFA explains the gradual changes in observed biological properties by evaluating the electrostatic (Coulombic interactions) and steric (van der Waals interactions) fields at regularly spaced grid points surrounding a set of mutually aligned ligands for a specific target protein. A statistical algorithm, Partial Least Square (PLS), was used to correlate the field descriptors with biological activities (i.e. pKi). The standard CoMFA settings were applied for developing Oat1, Oat6 and selectivity models (i.e. pKi(Oat6) − pKi(Oat1); Table 3). The global model contains 28 molecules in training set (19 mono-anions, 9 di-anions) and 7 molecules in test set (5 mono-anions, 2 di-anions). The pKi of 2-hydroxy-3-methyl-butyrate, 2-methyl butyrate, 3-hydroxy butyrate and 2-ethyl hexanoate were tested using racemic mixtures; hence, their activities were predicted as separate enantiomers. The aligned molecules were placed inside a 3D cubic lattice box with grid spacing of 2.0Å in x, y and z directions. The CoMFA steric and electrostatic descriptors were calculated at each grid point using an sp3 hybridized carbon atom probe with +1 charge at 1.52 Å van der Waals radius. The cutoff value for steric and electrostatic fields was set to +30 kcal/mol. To derive CoMFA models, pKi values were used as the dependent variables and CoMFA (steric and electrostatics) and logP values were used as the independent variables in partial least squares (PLS) analysis. The predictive ability of the model was evaluated using leave-one out (LOO) cross-validation studies (r2cv) and the predictive residual sum of squares (PRESS) of the test set. The optimum number of components from r2cv was used for the final PLS model and calculating the conventional r2 of the model. The r2cv was calculated using the following equation:
| (Eq. 1) |
where, Ypredicted, Yobserved and Ymean are the predicted, observed and mean pKi values, respectively. The numerator in Eq. 1 indicates PRESS, which is the difference of squared deviations between predicted and observed bioactivity values for molecules in the test set.
Table 3.
Statistical analysis of global models
| Model No. | r2cva | Nb | r2c | SEEd | PRESSe | Ff | % Contributionsg | ||
|---|---|---|---|---|---|---|---|---|---|
| Steric | Electrostatics | logP | |||||||
| 1 | 0.643 | 4 | 0.969 | 0.243 | 7.766 | 177.506 | 50.5 | 49.5 | - |
| 2 | 0.622 | 3 | 0.909 | 0.302 | 3.788 | 80.019 | 40.1 | 59.9 | - |
| 3 | 0.560 | 3 | 0.900 | 0.455 | 17.742 | 72.74 | 49.0 | 51.0 | - |
| 4 | 0.689 | 5 | 0.972 | 0.234 | 8.219 | 153.254 | 47.1 | 44.9 | 8.0 |
| 5 | 0.638 | 3 | 0.901 | 0.315 | 4.763 | 72.919 | 30.2 | 48.1 | 21.7 |
| 6 | 0.516 | 4 | 0.923 | 0.408 | 16.169 | 69.208 | 47.1 | 49.6 | 3.3 |
Cross-validated correlation coefficient.
Optimum number of components obtained form cross-validated PLS analysis.
Non cross-validated correlation coefficient.
Standard error of estimate.
Predictive residual sum of squares of test set
F-test value.
Field contributions: Steric, electrostatic and logP contributions from CoMFA.
RESULTS
Inhibition of tracer uptake in Oat6- and Oat1-injected oocytes
The ability of different organic anions to interact with Oat6 and Oat1 was assessed by inhibiting the transporter-mediated uptake of a radiolabeled tracer, [3H]-estrone-3-sulfate (ES) or [3H]-p-aminohippurate (PAH), respectively, in Oat6-injected or Oat1-injected oocytes. A diverse collection of 41 organic anions (mono- and di-anionic) was examined, including endogenous metabolites previously identified as potential Oat1 substrates (4-hydroxyphenyl-pyruvate, 4-hydroxyphenyl-lactate, N-acetylaspartate and 3-hydroxybutyrate) (3), anions of volatile organic acids described as odortype components (propionate, 2- and 3-methyl-butyrates, benzoate, heptanoate and 2-ethyl-hexanoate) (21,22) and tested in our previous work (10), as well as a number of anionic drugs and model compounds that are either described elsewhere as OAT substrates/inhibitors (4,14) or are presumed to be OAT ligands based on their structural similarity to known OAT substrates or inhibitors.
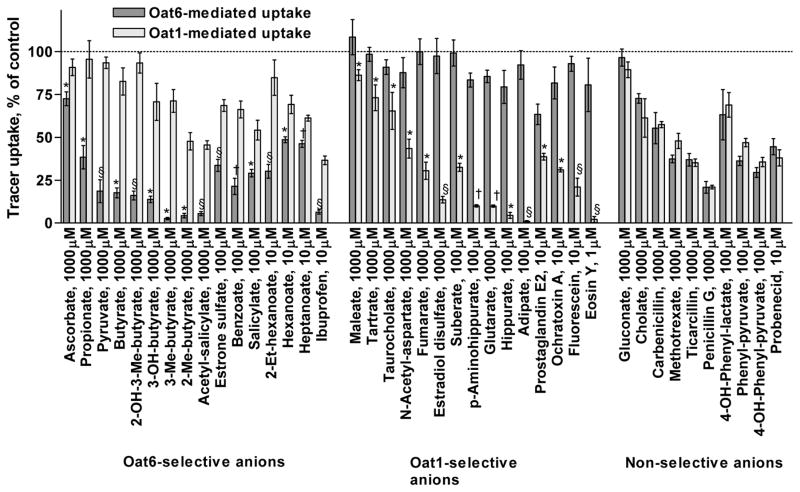
Figure 1 shows the side-by-side comparison of the inhibition of Oat6- and Oat1-mediated uptake by different organic anions tested at a single concentration (in the range of 1 μM to 1 mM, depending on the organic anion potency). The majority of the organic anions in the study significantly inhibited radioactive tracer uptake through Oat6 or/and Oat1, when tested at up to 1 mM concentration. Of all organic anions tested, sixteen displayed significantly stronger inhibition of Oat6, fifteen inhibited Oat1 to a greater extent, and ten showed no apparent preference for either transporter.
Figure 1.
Inhibition of the uptake of tracer substrate ([3H]-ES for Oat6-injected oocytes and [3H]-PAH for Oat1-injected oocytes) in the presence of various organic anions (at the indicated concentration) in the oocyte incubation medium. Each bar represents Mean ± SE of quadruplicate samples. Significance of the difference between the two inhibition values: *p <0.05; †p <0.01; §p <0.001.
To determine the potency of organic anions that exhibitited sub-millimolar activity upon at least one of the two transporters, we examined the concentration-dependent inhibition of tracer uptake. Organic anions producing <50% inhibition of both Oat1- and Oat6-mediated transport at 1 mM (ascorbate, maleate, tartrate, taurocholate, cholate, and gluconate) (Figure 1) were excluded from the potency assessment experiments. With the remaining 35 anions, concentration-dependent inhibition of tracer uptake was measured and the potencies (apparent pKi values – please refer to the Experimental Procedures section for details) calculated for both transporters. Figure 2 shows representative examples of the concentration-dependent inhibition of tracer uptake by organic anions selective for Oat6 (benzoate, pyruvate) or for Oat1 (PAH, fluorescein), and by those displaying similar potency for the two transporters (probenecid, penicillin G). The summarized results, along with the structures of the organic anions, their molecular masses, and LogP values (octanol-water partition coefficient, indicating hydrophobicity), are presented in Table 1.
Figure 2.
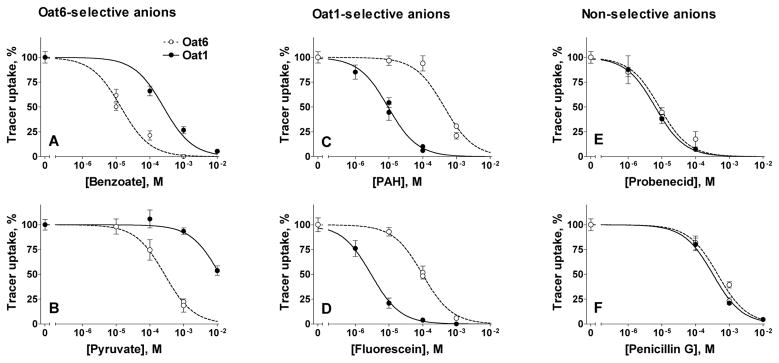
Concentration-dependent inhibition of tracer anion uptake ([3H]-ES, 17 nM, and [3H]-PAH, 237 nM, respectively, for Oat6- and Oat1-injected oocytes) by different organic anions. Examples are presented of organic anions selective for Oat6 (A, benzoate; B, pyruvate) or Oat1 (C, PAH; D, fluorescein), and for those equally potent for the two transporters (E, probenecid; F, penicillin G).
Table 1.
Molecular characteristics of the organic anions tested as inhibitors of OAT-mediated uptake, and the Ki values calculated from the concentration dependences of the tracer uptake inhibition in Oat6- and Oat1-injected oocytes.
| Organic anion | MW(1) | LogP (1,2) | Chemical structure (1) | pKi, Mean ± SE. (Ki, μM, Mean ± SE) | Selectivity: pKi(Oat6)–pKi(Oat1) | |
|---|---|---|---|---|---|---|
| Oat6 | Oat1 | |||||
| Monoanions | ||||||
| 3-Methyl-butyrate | 102 | 1.21 |

|
4.49 ± 0.05 (32.3±3.4) (3) | 2.63 ± 0.03 (2335±174) (3) | 1.86±0.06 |
| 2-Hydroxy-3-methyl-butyrate | 118 | 0.04 |

|
3.50 ± 0.19 (315±110) | 1.85 ± 0.12 (14200±3400) | 1.65±0.22 |
| Pyruvate | 88 | −0.90 |

|
3.57 ± 0.03 (271±20) | 1.92 ± 0.08 (11900±2100) | 1.64±0.09 |
| Butyrate | 88 | 1.00 |
|
4.09 ± 0.18 (82±27) | 2.46 ± 0.11 (3500±780) | 1.63±0.21 |
| Propionate | 74 | 0.44 |
|
3.55 ± 0.33 (279±147) (3) | 2.09 ± 0.11 (8180±1860) (3) | 1.47±0.34 |
| 2-Methyl-butyrate | 102 | 1.18 |

|
4.39 ± 0.02 (40.7±0.5)(3) | 3.04 ± 0.02 (920±25)(3) | 1.35±0.0.3 |
| Benzoate | 122 | 1.85 |

|
4.86 ± 0.09 (13.8±2.5)(3) | 3.60 ± 0.11 (253±55)(3) | 1.26±0.014 |
| 3-Hydroxybutyrate | 104 | −0.44 |

|
3.72 ± 0.04 (191±18) | 2.49 ± 0.10 (3220±660) | 1.23±0.11 |
| 2-Ethylhexanoate | 144 | 2.75 |
|
5.18 ± 0.28 (6.6±3.1)(3) | 4.25 ± 0.20 (57±21)(3) | 0.93±0.34 |
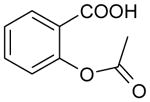
| Acetyl salicylate | 180 | 1.43 |
|
3.99 ± 0.09 (101±19) | 3.16 ± 0.19 (687±240) | 0.83±0.21 |
| Ibuprofen | 206 | 3.46 |

|
5.95 ± 0.07 (1.1±0.2) | 5.33 ± 0.14 (4.7±1.3) | 0.62±0.16 |
| Hexanoate | 116 | 2.01 |
|
5.04 ± 0.07 (9.0±1.3) | 4.43 ± 0.21 (38±15) | 0.62±0.22 |
| Estrone-3-sulfate | 350 | 0.84 |

|
4.24 ± 0.08 (58±10) (3) | 3.69 ± 0.02 (203±10) (3) | 0.55±0.08 |
| Salicylate | 138 | 1.87 |

|
4.36 ± 0.05 (44±5) | 3.84 ± 0.20 (145±53) | 0.52±0.20 |
| Phenylpyruvate | 164 | 0.53 |

|
4.54 ± 0.30 (29±14) | 4.10 ± 0.17 (79±26) | 0.44±0.36 |
| Heptanoate | 129 | 2.51 |
|
5.09 ± 0.05 (8.2±0.8) (3) | 4.78 ± 0.05 (16.7±1.8) (3) | 0.31±0.07 |
| 4-Hydroxyphenyl-lactate | 181 | 0.24 |

|
3.74 ± 0.05 (182±18) | 3.65 ± 0.04 (223±18) | 0.09±0.06 |
| 4-Hydroxyphenylpyruvate | 180 | 0.05 |

|
4.18 ± 0.27 (66±30) | 4.14 ± 0.15 (73±21) | 0.04±0.31 |
| Probenecid | 285 | 2.92 |

|
5.07 ± 0.12 (8.4±2.0) | 5.20 ± 0.02 (6.4±0.3) | −0.12±0.12 |
| Penicillin G | 334 | 1.37 |

|
3.34 ± 0.11 (452±97) | 3.48 ± 0.06 (328±44) | −0.14±0.12 |
| Prostaglandin E2 | 355 | 2.87 |

|
4.74 ± 0.23 (18.0±7.5) | 5.47 ± 0.23 (3.4±1.4) | −0.73±0.33 |
| Hippurate | 179 | −0.54 |

|
3.51 ± 0.09 (312±58) | 4.25 ± 0.02 (55.6±1.8) | −0.75±0.09 |
| Ochratoxin A | 404 | 1.74 |

|
4.31 ± 0.09 (49 ±10) | 5.20 ± 0.07 (6.2±0.9) | −0.89±0.12 |
| p-Aminohippurate | 194 | −1.46 |

|
3.35 ± 0.11 (446±98) (3) | 5.03 ± 0.05 (9.4±1.1) (3) | −1.68±0.12 |
| Di-anions | ||||||
| Methotrexate | 454 | −1.97 |

|
3.22 ± 0.06 (597±79) | 3.05 ± 0.06 (901±108) | 0.18±0.08 |
| Ticarcillin | 384 | 0.44 |

|
3.27 ± 0.07 (533±79) | 3.28 ± 0.04 (530±45) | 0.00±0.08 |
| Carbenicillin | 378 | 1.33 |

|
2.87 ± 0.12 (1330±330) | 2.89 ± 0.06 (1280±165) | −0.02±0.14 |
| Suberate | 174 | 1.37 |
|
2.95 ± 0.08 (1130±190) | 4.47 ± 0.13 (34.1±9.0) | −1.52±0.16 |
| Estradiol disulfate | 433 | −1.30 |

|
2.14 ± 0.16 (7210±2240) | 3.66 ± 0.07 (220±33) | −1.52±0.18 |
| N-Acetylaspartate | 175 | −3.25 |

|
1.56 ± 0.20 (27800±9900) | 3.08 ± 0.16 (840±260) | −1.52±0.25 |
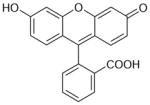
| Fluorescein | 330 | 3.92 |
|
4.00 ± 0.03 (99±7) | 5.53 ± 0.02 (3.0±0.2) | −1.53±0.04 |
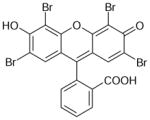
| Eosin Y | 648 | 7.13 |
|
5.36 ± 0.09 (4.4±0.8) | 7.05 ± 0.08 (0.09±0.01) | −1.69±0.12 |
| Fumarate | 116 | −0.68 |
|
<1.5 (>30000) | 3.21 ± 0.19 (610±220) | <−1.71 |
| Glutarate | 132 | −0.15 |
|
2.27 ± 0.15 (5410±1570) | 5.17 ± 0.11 (6.7±1.5) | −2.91±0.18 |
| Adipate | 146 | 0.36 |
|
2.80 ± 0.03 (1580±110) | 6.39 ± 0.03 (0.41±0.03) | −3.58±0.04 |
Chemical structures, MW and LogP values are presented for neutral (protonated) form
Estimated LogP values are calculated using Molinspiration software (see Materials and Methods)
Data from (9).
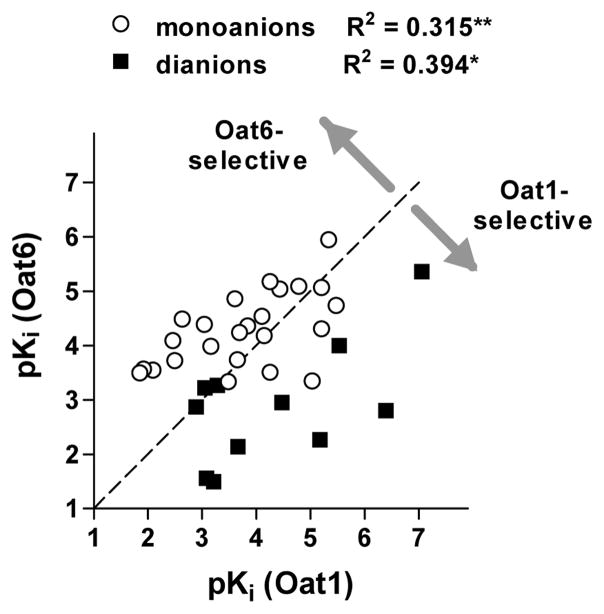
Plotting the pKi values of Oat6 against those for Oat1 (Figure 3) demonstrates a correlation between the potencies of organic anion for the two transporters. This correlation was found to be significant for both single-charged and double-charged anions. In addition, Figure 3 reveals the generally higher potency of mono-anions for Oat6 and of di-anions for Oat1.
Figure 3.
Correlation between the potencies (pKi values) of organic anions assayed on Oat6-injected and Oat1-injected oocytes. R2 values and significance of correlation (* p < 0.05, ** p < 0.01) are presented for mono-anions (○, n = 24) and di-anions (▪, n = 11).
Physicochemical and structural determinants of the Oat6/Oat1 affinity and selectivity of organic anions
The data in Table 1 were analyzed to determine the one-dimensional quantitative property-activity relationship between the potency of organic anions for the OATs and the most common molecular features that impact the interaction of a small molecule with protein binding sites (molecular mass, hydrophobicity and net charge).
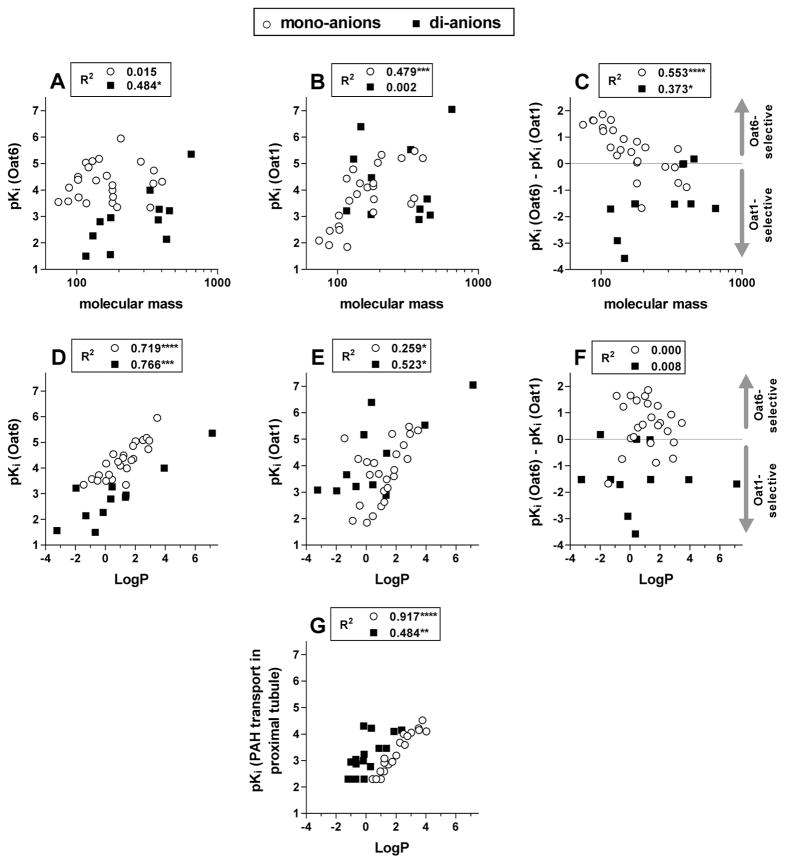
The potencies of the organic anions (pKi values) plotted versus their molecular masses are presented in Figure 4, A and B, as determined for Oat6 and Oat1, respectively. While no correlation between organic anion potency and molecular mass was detected for mono-anions on Oat6 or for di-anions with Oat1, a weak correlation was observed for di-anions on Oat6 (Figure 4A) and a strong correlation for mono-anions with Oat1 (Figure 4B) (in both cases, smaller anions tend to manifest lower potency). To verify the influence of the molecular mass of organic anions on their selectivity between the two transporters, we also analyzed the potency difference between the transporters, pKi(Oat6)−pKi(Oat1). This approach compensates for the structural features of organic anions that contribute equally to their interaction with both Oat1 and Oat6 and reveals the features distinguishing between the two transporters. Single-charged organic anions, but not di-anions, showed a very strong correlation between the potency difference and molecular mass (p < 0.0001, Figure 4C), with a distinct Oat6 preference for mono-anions with a molecular mass below or around 150.
Figure 4.
A–F. Potencies (pKi values) of organic anions (○, mono-anions, n = 24; ▪, di-anions, n = 11) for Oat6 (A, D) and Oat1 (B, E), and the calculated potency difference, pKi(Oat6) − pKi(Oat1) (C, F), plotted versus Log(molecular mass) (A, B, C) and versus LogP (D, E, F). G. Substrate potency-LogP dependence calculated based on the data of Ullrich et al (22,37) on the inhibition of PAH transport (primarily Oat1-mediated) in the proximal tubule of the rat kidney by aliphatic mono-carboxylates (○, n = 19) (22) and di-carboxylates (▪, n = 16) (23). R2 values and significance of correlation (* p < 0.05, ** p < 0.01, *** p < 0.001, **** p < 0.0001) are presented for mono- and di-anions in each panel.
We also investigated whether organic anion hydrophobicity (LogP value) correlated with differences in potency between Oat6 and Oat1. In contrast to the data on the effect of organic anion molecular mass on selectivity between Oat6 and Oat1 (Figure 4, A–C), the organic anion LogP value apparently affected the potency for both Oat6 (strong potency–LogP correlation, Figure 4D) and Oat1 (weak correlation, Figure 4E), but not the selectivity between the transporters (no correlation between pKi(Oat6)−pKi(Oat1) and LogP, Figure 4F). Interestingly, di-anions displayed a consistently lower potency for Oat6 than mono-anions with comparable LogP (Figure 4D), whereas for Oat1, di-anions tended to be more potent than mono-anions (Figure 4E). Computational analysis later strikingly confirmed these differences in substrate preferences (see global and anion specific CoMFA models below).
To verify the potency−LogP correlation (though weak) observed for inhibition of Oat1-mediated transport (Figure 4E), we applied the same approach to analyze the previously published data of Ullrich and colleagues, on the inhibitory effect of aliphatic mono-carboxylates (23) and di-carboxylates (24) on PAH transport in the proximal tubule of the rat kidney, which is primarily Oat1-mediated (3). Based on these data, we calculated the potencies (pKi) and hydrophobicities (LogP) of the organic anions and plotted pKi versus LogP (Figure 4G). It is noteworthy that, with such a homogeneous collection of structurally uniform ligands (as compared to the set of structurally diverse organic anions used in our experiments), a much stronger potency-hydrophobicity correlation was obtained, with clearly higher potency observed for di-anions (when compared to mono-anions with similar hydrophobicity). These results were found to be robust upon subsequent analysis (see below).
Uptake of radiolabeled tracers in Oat6- and Oat1-injected oocytes
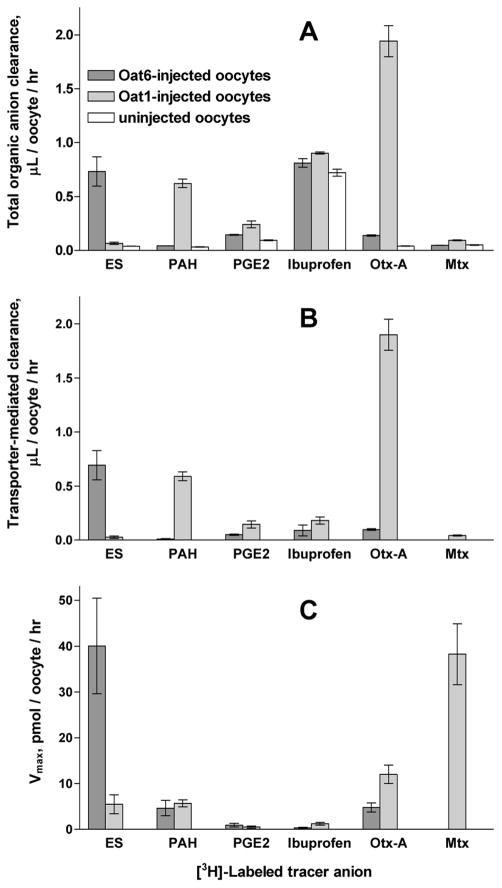
To directly assess organic anion transport via Oat6 and Oat1, we measured the rate of transporter-mediated uptake for a subset of six organic anions ([3H]-labeled) varying in their potencies and transporter binding preferences (Table 1): p-aminohippurate (PAH), estrone sulfate (ES), ochratoxin A, prostaglandin E2, methotrexate and ibuprofen. The entire set of measurements was performed in a single experiment using Oat1-injected, Oat6-injected and uninjected oocytes from the same batch, to improve the likelihood that transporter expression level would not contribute to uptake differences between substrates. The results (Figure 5A) revealed significant Oat6-mediated uptake of [3H]-ES and Oat1-mediated uptake of [3H]-PAH and [3H]-ochratoxin A that considerably exceeded (typically by more than 10-fold) the background uptake of these compounds in uninjected oocytes. Lesser transporter-mediated uptake was measured for [3H]-ochratoxin A and [3H]-prostaglandin E2 in Oat6-injected oocytes and for [3H]-prostaglandin E2 and [3H]-methotrexate in Oat1-injected oocytes. The high background uptake observed for the most hydrophobic of these six organic anions, ibuprofen, is likely due to its non-transporter-mediated diffusion across the membrane.
Figure 5.
Transporter-mediated uptake of organic anions. A. Total clearance of various [3H]-labeled organic anions (ES, PAH, prostaglandin E2, ibuprofen, ochratoxin A and methotrexate, all 1 μCi/mL in the Barth's buffer) in Oat6-injected, Oat1-injected and uninjected oocytes during 1 hr incubation. All measurements were performed in a single experiment using the same batch of oocytes. B. Transporter-mediated clearance calculated for each of the six [3H]-labeled organic anions as clearance difference between RNA-injected and uninjected oocytes. C. Calculated maximum uptake rate (Vmax, see Table 2 for details).
Transport efficacy (maximum translocation rate) for different Oat6/Oat1 substrates
In our experiments, uptake of [3H]-labeled tracers was measured as the initial rate on the linear part of the uptake kinetics (10). Under these conditions, the dependence of transporter-mediated uptake rate (Vtransport) on substrate concentration (S) can be described as Vtransport = Vmax·S/(S+Km), where Km is the apparent equilibrium constant of the substrate-transporter complex, and Vmax is the maximum uptake rate.
Oat6- and Oat1-mediated clearance of six [3H]-labeled substrates (ES, PAH, prostaglandin E2, ibuprofen, ochratoxin A and methotrexate) (Figure 5B) was determined by subtracting the background clearance (in uninjected oocytes) from the total clearance observed in Oat6- and Oat1-injected oocytes (Figure 5A). Based on obtained values of CL = Vtransport/S, the maximum uptake rates, Vmax, can be calculated as Vmax = (Vtransport/S)·(S+Km), provided that the respective Km values are known. It is reasonable to assume that the Ki values found for these six organic anions in the tracer uptake inhibition experiments (Table 1) should represent an approximation of the Km values. Accordingly, the maximum uptake rate for each substrate was calculated as Vmax = (Vtransport/S)·(S+Ki) = CL· (S+Ki). The discussion of Vmax that follows should therefore be understood to be qualified by the above assumption.
These calculations (Table 2) revealed that the apparent Vmax varies greatly among the organic anions tested (Figure 5C), and that, for both Oat1 and Oat6, there is little correlation between organic anion potency (Ki) and efficacy (Vmax). For Oat6, ES is the most efficacious substrate, followed by ochratoxin A and PAH. With Oat1, the highest Vmax value was calculated for methotrexate followed by ochratoxin A, PAH and ES.
Table 2.
Calculation of the maximum uptake rate (Vmax) of radiolabeled substrates for Oat6 and Oat1.
| [3H]-labeled substrate | S (1), μM | Ki (2), μM | CL (3), μL/oocyte/hr | Vmax (4), pmol/oocyte/hr | |||
|---|---|---|---|---|---|---|---|
| Oat6 | Oat1 | Oat6 | Oat1 | Oat6 | Oat1 | ||
| ES | 0.017 | 58 ± 10 | 203 ± 10 | 0.693 ± 0.135 | 0.027 ± 0.010 | 40.0 ± 10.4 | 5.5 ± 2.1 |
| PAH | 0.237 | 446 ± 98 | 9.4 ± 1.1 | 0.010 ± 0.003 | 0.590 ± 0.040 | 4.6 ± 1.7 | 5.7 ± 0.7 |
| Prostaglandin E2 | 0.005 | 18.0 ± 7.5 | 3.4 ± 1.4 | 0.050 ± 0.007 | 0.146 ± 0.032 | 0.90 ± 0.39 | 0.49 ± 0.23 |
| Ibuprofen | 2.0 | 1.1 ± 0.2 | 4.7 ± 1.3 | 0.090 ± 0.050 | 0.182 ± 0.033 | 0.28 ± 0.16 | 1.2 ± 0.3 |
| Ochratoxin A | 0.067 | 49 ± 10 | 6.2 ± 0.9 | 0.098 ± 0.008 | 1.900 ± 0.145 | 4.8 ± 1.0 | 12.0 ± 2.0 |
| Methotrexate | 0.05 | 597 ± 79 | 901 ± 108 | ND (5) | 0.043 ± 0.005 | ND (5) | 38.3 ± 6.7 |
Calculated for the 1 μCi/mL content of [3H]-labeled substrates in the incubation media, based on specific activities (see Materials and Methods).
Data from Table 1.
Calculated as CL = Vtransport/S (plotted in Figure 5B).
Calculated as Vmax = CL·(S+Ki) (plotted in Figure 5C).
Oat6-mediated uptake of methotrexate is not detectable (no difference between Oat6-injected and uninjected oocytes, see Figure 5A).
Interestingly, ibuprofen and prostaglandin E2, though highly potent inhibitors of both Oat6- and Oat1-mediated tracer uptake, are not efficiently transported by either of the transporters. It is also worth noting that, when transforming substrate clearance data to transporter efficacy data (Vmax values), the relative magnitude increases for low-potency substrates. Thus, the calculation reveals a high Vmax value for Oat1-mediated transport of methotrexate (though this substrate manifests a low clearance) because of its relatively low potency (high Ki). Another example of such a divergence between the measured clearance and calculated maximum uptake rate is the finding that Vmax values for ES and PAH uptake via Oat1 are similar (Figure 5C) though the respective CL values are very different (Figure 5B).
Comparative Molecular Field Analysis - Global Models
To further delineate the role of hydrophobic (steric) interactions in substrate affinity for Oat1 and Oat6, we applied CoMFA to disseminate the relative contributions of steric and electrostatic molecular properties in three-dimensional space. Furthermore, logP was used as an independent variable to determine its relative contribution to steric properties, if any. The global CoMFA includes both mono- and di-anions. Six different CoMFA models were built: Models 1–3 used CoMFA as independent and pKi as dependent variables to develop models for Oat1, Oat6 and Oat1/Oat6 selectivity, respectively, whereas models 4–6 included pKi as dependent and CoMFA and logP as independent variables (Table 3). The predictive ability of all models was evaluated based on PRESS, where a lower value is indicative of a better model.
Interestingly, Oat1 and Oat6 models based on CoMFA descriptors (models 1 and 2) are generally better than models based on both CoMFA and logP as independent variables (models 4 and 5), even though models 4 and 5 display higher cross-validated r2 values. This is consistent with the observation that r2cv may not be, in all cases, an accurate measure of the predictive ability of models (25). The contribution of logP to Oat1 and Oat6 affinity models is 8.0% and 21.7%, respectively, indicating that logP is more important in explaining the variation in activity for Oat6 than Oat1, as demonstrated by our one-dimensional Quantitative Structure Activity Relationship (QSAR) (Figure 4D). It is interesting to note that for all models, the variability in biological data (pKi) can be explained by approximately 50% steric and 50% electrostatic molecular field contributions (Table 3). Although the inclusion of logP as an independent variable (models 4–6) produces robust CoMFA models, the relative contribution to the models is primarily drawn from steric interaction fields. This is not surprising, since logP is an intrinsically steric property. Thus, we have extended and superseded the prior one-dimensional logP models (Fig. 4) by analyzing both steric and electrostatic interactions that govern Oat1 and Oat6 inhibition.
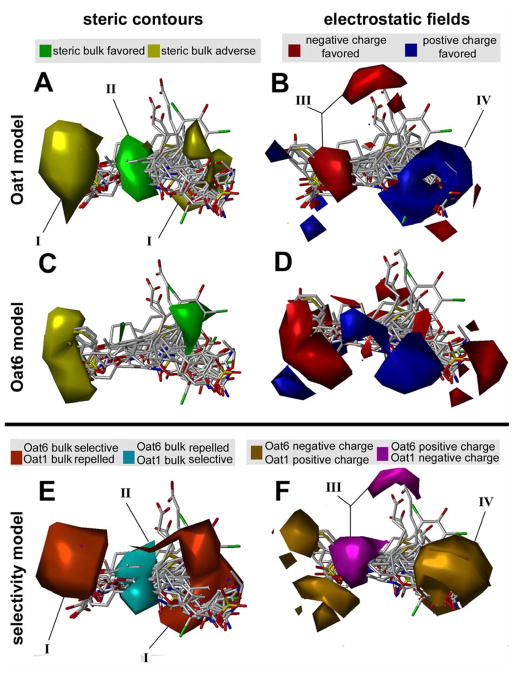
The interpretation of CoMFA contour maps (Figure 6) is distinctly different for the individual OAT models and the selectivity model. For example, the presence or absence of bulk near green or yellow regions, and an increase of negative charge near the red region or positive charge near the blue region, favors binding in the case of individual OAT models (Figure 6, A and B). However, the selectivity models favor Oat6 binding when steric bulk is present or absent near orange or pink regions; also, Oat6 affinity is favored with an increase of negative charge near purple regions or positive charge near teal regions. Conversely, the presence of bulk near pink and absence near the orange region, and increase in positive charge near purple and increase in negative charge near teal would favor Oat1 binding (Figure 6C).
Figure 6.
A, B. Oat1 binding model. C, D. Oat6 binding model. E, F. Oat6/Oat1 selectivity model. A, C, E. CoMFA contour map for steric and B, D, F. electrostatic properties. For Oat1 and Oat6 steric field maps (A, C) green contours indicate areas where steric bulk is allowed and positively contributes to Oat1 pKi values, whereas yellow regions convey areas where steric bulk negatively impacts pKi. Oat1 and Oat6 electrostatic maps (B, D) feature blue contours where positive charge is favored, whereas more negative electron density is favored within red contours. The selectivity model CoMFA fields for Oat6 and Oat1 (E, F) suggest that Oat6 binding is favored with the presence or absence of bulk near orange or teal regions, and an increase of negative charge near the gold region or positive charge near purple regions. Conversely, the presence of bulk near teal and absence near orange regions, and increases in positive charge near gold and increases in negative charge near purple favors Oat1 inhibition. Oat6 selective ligands can be designed by introducing bulky groups near contours I, removing bulk near contour II, and placing groups with electropositive and electronegative density near contours III and IV, respectively. The training set molecules are shown in capped stick mode (red: oxygen, white: carbon, blue: nitrogen, green: halogens)
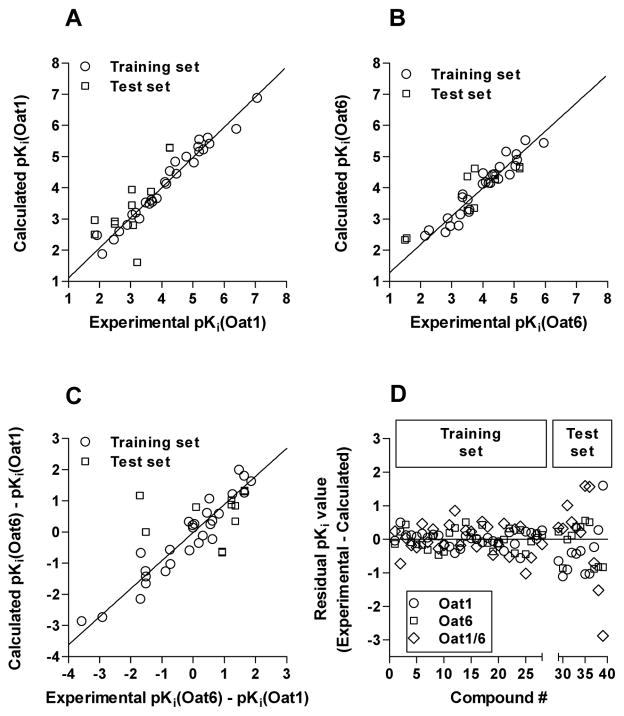
Correlation between calculated and experimental pKi values (Figure 7, A–C) indicates that all models were linear with at least a 5–6 log unit spread in data points; randomly selected test set molecules were evenly distributed across the range in activity data for all three models. Further inspection of residual values for both training and test set data (Figure 7D) revealed that the mean residual values for Oat1 and Oat6 training models were −0.04 and −0.01, respectively; the Oat6/1 selectivity training model had the highest mean residual value (0.19). As expected for studies involving extrapolation of data, test set mean residual values were markedly higher for Oat1 (−0.43) and Oat6/1 selectivity model (0.32); however, Oat6 test set predictions were identical to the performance of the training set estimates (−0.01), indicating a significantly predictive model.
Figure 7.
Correlation between predicted (calculated) and experimental pKi values for Oat1 (A), Oat6 (B), and the Oat1/6 selectivity model (C). Panel D illustrates the residual values obtained for the training set and test set molecules with all three models.
Comparative Molecular Field Analysis – Anion-Specific Models
Based on the global CoMFA model it is clear that logP is an important physicochemical property governing affinity for Oat6. In line with 1D property-activity relationship analyses (Figure 4), individual CoMFA models were built for mono- and di-anions to investigate the relationship between specific anions and logP for OAT binding. The entire data set was divided into mono- and di-anions, and using pKi as dependent variable and CoMFA and logP as independent variables, three individual models were developed for Oat1, Oat6 and Oat6/Oat1 selectivity (Table 4). The predictive ability of the Oat1 mono- and di-anion models is comparable as indicated by similar r2 values. However, the predictive ability of the Oat6 mono-anion model (r2 = 0.691) is poor compared to that of the di-anion model (r2 = 0.833). Overall, the individual mono- and di-anion models clearly indicate that equal contributions of steric and electrostatic factors govern affinity for Oat1, whereas logP contributions predominate affinity for Oat6.
Table 4.
Statistical analysis of anion specific models
| PLS Statistics | Mono-anions | Di-anions | ||||
|---|---|---|---|---|---|---|
| Oat1 | Oat6 | Selective | Oat1 | Oat6 | Selective | |
| r2cva | 0.624 | 0.558 | 0.408 | 0.477 | 0.566 | 0.495 |
| Nb | 4 | 1 | 5 | 3 | 1 | 5 |
| r2c | 0.978 | 0.691 | 0.978 | 0.954 | 0.833 | 0.997 |
| SEEd | 0.187 | 0.400 | 0.169 | 0.410 | 0.427 | 0.113 |
| PRESSe | 2.987 | 0.407 | 0.753 | 0.5202 | 1.476 | 0.620 |
| Ff | 154.554 | 37.981 | 113.668 | 34.669 | 34.933 | 209.085 |
| % Contributionsg | ||||||
| Steric | 46.3 | 11.4 | 48.9 | 42.2 | 13.2 | 51.0 |
| Electrostatics | 46.3 | 11.8 | 41.8 | 36.3 | 23.1 | 47.7 |
| LogP | 7.40 | 76.8 | 9.30 | 21.5 | 63.7 | 1.30 |
Cross-validated correlation coefficient.
Optimum number of components obtained form cross-validated PLS analysis.
Non cross-validated correlation coefficient.
Standard error of estimate.
Predictive residual sum of squares of test set
F-test value.
Field contributions: Steric, electrostatic and logP contributions from CoMFA.
DISCUSSION
The olfactory epithelium is important for maintaining the microenvironment surrounding olfactory neurons; however, no clear role has been established for membrane transporters in this tissue (26). Oat6 is a close phylogenetic relation of Oat1 that is absent from kidney but instead expressed in olfactory mucosa (9). As we have shown (Figure 5, Table 1), Oat6 might mediate nasal absorption of some of the same organic anionic drugs that are Oat1 substrates, potentially allowing for intranasal administration as an alternate route of drug delivery that might bypass the blood-brain barrier (11–13). Oat6 may also possess distinct anion preferences (10), which, along with its unique tissue localization, might indicate a specialized role in olfactory physiology. Moreover, while substrate discrimination between Oat6 and Oat1 may reflect their respective physiological functions, overlapping substrates may indicate a mechanism for “remote sensing” between tissue compartments (e.g., kidney and olfactory mucosa) via organic anions. Specifically, odorant organic anions such as 2-methylbutyrate, 3-methylbutyrate and hexanoate, which have been demonstrated to evoke glomerular responses in the olfactory bulb (27), might be secreted into the urine via Oat1 and then absorbed and/or sensed in the olfactory mucosa via Oat6 (10).
Clearly defining the similarities and differences in substrate structural preferences between these two transporters, then, could have important ramifications not only for drug design but for understanding how tissues communicate via small molecules. Our results indicate very different charge and hydrophobicity preferences for these two transporters. Because they are such close phylogenetic relatives, our data suggests that while the general 3D structures of the transporters might be very similar, the binding pockets have crucial differences.
Characterization of the affinity of organic anions for Oat6 and Oat1
To investigate the molecular features influencing organic anion selectivity between the transporters, we used the potencies of 35 organic anions determined for both Oat6 and Oat1 (Table 1). Our results for Oat1 are consistent with the Km and Ki data available elsewhere for many of these organic anions (reviewed in (4,14)). Our study includes four of the total of five organic anions assayed in other studies (28) (ES, probenecid, salicylate and penicillin G), and our results show general agreement.
Comparative analysis of organic anion potencies (pKi values, Table 1) reveals the influence of molecular features such as anion net charge, molecular mass and hydrophobicity on affinity and selectivity for Oat6 and Oat1. The most obvious observation is a clear-cut preference of single-charged organic anions for Oat6 and of double-charged ones for Oat1 (Figures 3 and 4).
Examination of the organic anion potency correlation with molecular mass also shows a difference in the binding preferences of the two transporters. With single-charged organic anions, no correlation was observed for Oat6 (Figure 4A), while Oat1 tends to “dislike” smaller ligands (Figure 4B). This tendency becomes more pronounced when the potency difference, pKi(Oat6)−pKi(Oat1) is analyzed (Figure 4C). Thus, Oat6 would seem to represent a better fit, compared to Oat1, for binding of low molecular mass odorant anions. Interestingly, we did not see a similar correlation for double-charged organic anions (Figure 4C).
Our results demonstrate that hydrophobicity (calculated LogP value) correlates very strongly with organic anion potency for both transporters, a correlation that is particularly prominent for the olfactory-expressed organic anion transporter, Oat6 (Figure 4D). Such a high correlation between potency and hydrophobicity, observed for a wide range of structurally diverse organic anions, suggests that their association with the Oat6 binding site does not require specific structural features of the organic anions other than the presence of a negatively charged group. Therefore, we suggest that substrate hydrophobicity contributes indirectly to binding to the transporter – hydrophobic compounds are repelled from the aqueous medium and thus forced into the transporter binding pocket, which provides a more hydrophobic environment.
Compared to Oat6, the binding of organic anions to Oat1 displays a much weaker correlation with LogP, suggesting a significant role for structure-specific molecular interactions in the ligand-transporter binding energy. Moreover, while a second negatively charged group consistently lowers organic anion potency for Oat6 (Figure 4D), an apparently positive contribution of a second anionic group to potency is noted for Oat1 (Figure 4E). This overall pattern suggests a difference between the two transporters in anion-binding modes: primarily hydrophobicity-driven binding for Oat6, with relatively little involvement of specific molecular interactions (the present study) versus largely structure-dependent ligand association with Oat1 (14). Figure 4F clearly demonstrates that the ligand hydrophobicity equally contributes to the binding energy with both transporters: no correlation is detected between ligand hydrophobicity and potency difference, pKi(Oat6)−pKi(Oat1), which is calculated to factor out non-transporter-specific aspects of ligand-transporter interactions and uncover the role of transporter-specific interactions.
It is noteworthy that, in the case of a more homogeneous collection of organic anions (aliphatic mono- and di-carboxylates) lacking additional groups (other than carboxyls) capable of specific interactions with hydrogen bond-forming or aromatic groups of the transporter, a strong potency-hydrophobicity correlation is observed for inhibition of proximal tubular PAH transport (which is largely mediated by Oat1 (3)); (Figure 4G, based on the data of Ullrich and coauthors (23,24)), A very strong correlation observed for mono-carboxylates (R2 = 0.917, p < 0.0001) supports the idea that the single carboxyl group in organic anions varying in size (C3 to C10) and molecular structure (linear, branched, unsaturated) interacts uniformly with the binding site of the transporter, with the overall hydrophobicity of the ligand controlling its equilibrium between the aqueous medium and the transporter binding pocket. With dicarboxylates, a weaker pKi−LogP correlation is noted (R2 = 0.484, p < 0.01), which is consistent with specific interactions of both carboxyl groups being essential, so that their relative position affects affinity. Interestingly, no significant correlation was obtained when analyzing a larger data set from the same group of investigators (29–33) which included structurally diverse single charged organic anions containing additional groups (aromatic, hydrogen bond-forming) that are potentially capable of specific interactions with the transporter binding site (data not shown).
Comparative molecular Field Analysis
To gain further understanding of the binding mode of organic anions to Oat1 and Oat6, we used a computational approach to model in vitro inhibition data. Although a one-dimensional property-activity relationship is a useful approach to analyze the influence of physicochemical properties on biological activity, it does not take into consideration the three-dimensional molecular orientation and the spatial distribution of electrostatic and steric interactions. To address these limitations, we extended our analyses using the CoMFA 3D-QSAR algorithm. Using an iterative process, predictive QSAR models were derived for the individual OAT transporters as well as a model focusing on Oat6/1 selectivity (Table 3, Figure 6). The latter model is expected to predict compounds that specifically bind to Oat6. As a further illustration, Figure 7 displays the residual plots of divergence between predicted and actual activity values for the Oat1, Oat6, and Oat6/1 models, respectively. The CoMFA models feature robust r2cv values, indicative of internally consistent models.
The biological implications of the 3D-QSAR analyses are explained through CoMFA coefficient contour maps (Figure 6), which illustrate the correlation of steric and electrostatic fields with biological activity. The most interesting areas of selectivity fields are the regions with opposite colors (Figure 6E,F) in the individual Oat1 and Oat6 models. The regions in the selectivity field can be used to interpret the quantitative structure-selectivity relationship in designing selective ligands for Oats. For example, Oat6-selective ligands can be designed by introducing bulky groups near contour I, removing bulk near contour II, and placing groups with electropositive and electronegative density near contours III and IV, respectively (Figure 6). Furthermore, the CoMFA models suggest that logP plays a dominant role in binding for Oat6-selective compounds. In other words, hydrophobicity is an important determinant of Oat6 affinity, whereas specific interactions (e.g. electrostatics) are more important for Oat1 affinity. The Oat1 and Oat6 models developed here can also be used for virtual screening of molecular databases to identify lead compounds in the design of novel OAT substrates or inhibitors. Alternatively, this technique can be used to identify current prescription drugs that might be unrecognized substrates or inhibitors for OATs, as shown previously for P-glycoprotein and PEPT1 (34,35). This, in turn, would aid in understanding of drug-drug interactions and aid the development of therapeutic guidelines for OAT substrates.
Characterization of the transport function of Oat6 and Oat1
The aforementioned discussion relates to organic anion potency, which is characteristic of the anion association with the transporter binding site. However, high affinity binding does not ensure an organic anion being a true OAT substrate that is actually translocated across the membrane via the transporter. Therefore, with a subset of six organic anions ([3H]-labeled), we also determined actual transport function (uptake rate) and calculated the transporter efficacy (maximum uptake rate, Vmax) for each of the substrates.
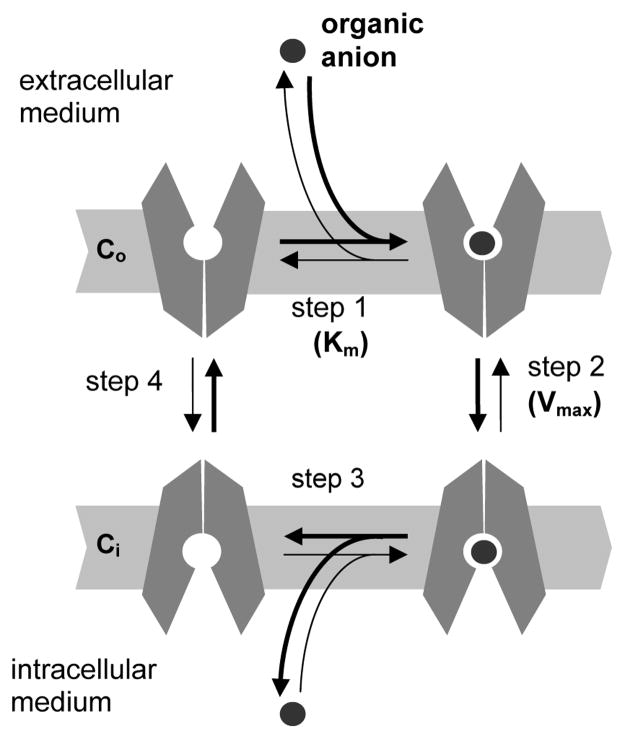
OATs belong to the Major Facilitator Superfamily (MFS) of transporters currently postulated to function via a single binding site – alternate access mechanism (36,37). Based on this transport mechanism, the inwardly directed transporter-mediated uptake of a substrate anion can be described as involving the following steps (Figure 8): (1) substrate binding to the transporter in the conformation open to extracellular medium (Co); (2) switching of the substrate-transporter complex to the conformation open to intracellular medium (Co → Ci); (3) substrate dissociation into the intracellular medium; and (4) switching of the “empty” transporter back to the Co conformation. In this scheme, the equilibrium constant of the substrate-transporter complex determines the substrate concentration profile (Km value, Figure 8, step 1), and the rates of conformational transition of the substrate-transporter complex (step 2) and of the “empty” transporter (step 4) control the maximum uptake rate (Vmax).
Figure 8.
Scheme of OAT-mediated uptake (bold arrows indicate inwardly directed organic anion transport). Step 1, binding of the substrate anion from the extracellular medium to the binding site of the transporter in outside-open conformation (Co). Step 2, switch of the substrate-transporter complex to inside-open conformation (Co→Ci). Step 3, substrate dissociation into the intracellular medium. Step 4, switch of “empty” transporter back to the Co conformation. Steps 1 and 2 are assumed to determine, respectively, substrate potency (Km) and efficacy (Vmax).
Substantial differences among the Vmax values found for the substrates tested in this work suggest that the rate of the conformational switch of the transporter-substrate complex (step 2, substrate-dependent), rather than that of “empty” transporter (step 4, substrate-independent) mostly determines the substrate uptake rate. It should be noted that the “empty” transporter might actually mean a complex of the transporter with one of anionic metabolites – intracellular OAT substrates. In this case, an intracellular substrate (such as α-ketoglutarate for Oat1 (4)) would be transported from the oocytes in exchange for the extracellular substrate taken up. This notion, however, does not affect the conclusion (based on the present view of single binding site-alternating access transport model) about the Co → Ci conformational switch of the transporter-substrate complex (Figure 8, step 2) being the rate limiting step in substrate uptake.
In contrast to the observed correlation between the potencies of organic anions for OATs (pKi values, describing the substrate affinity for the transporter binding site) and their general molecular characteristics (molecular size, charge, hydrophobicity) (Figure 4), little correlation was found for the efficacies of organic anions (Vmax values, reflecting the conformational dynamics of the transporter-substrate complex). It should also be emphasized that our results (Table 2) revealed no apparent relation between the Vmax values for Oat6 and Oat1, or between the Vmax and Ki values for either of the transporters. For example, ES and ochratoxin A interact with Oat6 with approximately equal potency, but the former is translocated across the membrane with much higher efficacy. As a counter example, the potency of PAH for Oat1 is much higher than that of ES, but when bound, both appear equally efficacious in inducing the transporter conformation switch.
Thus, there appear to be very distinct requirements for the two steps of OAT-mediated transport: substrate binding to the transporter (Figure 8, step 1) is largely dependent on general physicochemical characteristics of the substrate (charge, size, hydrophobicity) (14), whereas actual translocation across the membrane, driven by switching the conformation of the substrate-transporter complex (step 2), is apparently determined by distinctive molecular features of the substrate. Consequently, when describing the facilitated transport of a substrate, two kinds of the substrate-transporter interaction should be analyzed separately: (1) interactions leading to the substrate association with the transporter binding site and (2) interactions of the bound substrate within the binding site that affect transporter conformational dynamics. Our results indicate marked differences between these two kinds of interaction
Supplementary Material
Acknowledgments
This work was supported by NIH grants AI057695 and HD40011 to SKN, DK61425 to PWS, and DK064839 and DK075486 to SAE.
References
- 1.Dantzler WH, Wright SH. Biochimica et Biophysica Acta (BBA) - Biomembranes. 2003;1618(2):185–193. doi: 10.1016/j.bbamem.2003.08.015. [DOI] [PubMed] [Google Scholar]
- 2.Eraly SA, Bush KT, Sampogna RV, Bhatnagar V, Nigam SK. Mol Pharmacol. 2004;65(3):479–487. doi: 10.1124/mol.65.3.479. [DOI] [PubMed] [Google Scholar]
- 3.Eraly SA, Vallon V, Vaughn DA, Gangoiti JA, Richter K, Nagle M, Monte JC, Rieg T, Truong DM, Long JM, Barshop BA, Kaler G, Nigam SK. J Biol Chem. 2006;281(8):5072–5083. doi: 10.1074/jbc.M508050200. [DOI] [PubMed] [Google Scholar]
- 4.Burckhardt BC, Burckhardt G. Rev Physiol Biochem Pharmacol. 2003;146:95–158. doi: 10.1007/s10254-002-0003-8. [DOI] [PubMed] [Google Scholar]
- 5.Lopez-Nieto CE, you G, Barros EJG, Beier DR, Nigam SK. J Am Soc Nephrol. 1996;7:1301. [Google Scholar]
- 6.Lopez-Nieto CE. GenBank Accession Number: MMU528. 1996. [Google Scholar]
- 7.Lopez-Nieto CE, You G, Bush KT, Barros EJ, Beier DR, Nigam SK. J Biol Chem. 1997;272(10):6471–6478. doi: 10.1074/jbc.272.10.6471. [DOI] [PubMed] [Google Scholar]
- 8.Sweet DH, Wolff NA, Pritchard JB. J Biol Chem. 1997;272(48):30088–30095. doi: 10.1074/jbc.272.48.30088. [DOI] [PubMed] [Google Scholar]
- 9.Monte JC, Nagle MA, Eraly SA, Nigam SK. Biochem Biophys Res Commun. 2004;323(2):429–436. doi: 10.1016/j.bbrc.2004.08.112. [DOI] [PubMed] [Google Scholar]
- 10.Kaler G, Truong DM, Sweeney DE, Logan DW, Nagle M, Wu W, Eraly SA, Nigam SK. Biochem Biophys Res Commun. 2006;351(4):872–876. doi: 10.1016/j.bbrc.2006.10.136. [DOI] [PMC free article] [PubMed] [Google Scholar]
- 11.Illum L. European Journal of Pharmaceutical Sciences. 2000;11(1):1–18. doi: 10.1016/s0928-0987(00)00087-7. [DOI] [PubMed] [Google Scholar]
- 12.Bagger MA, Bechgaard E. European Journal of Pharmaceutical Sciences. 2004;21(2–3):235–242. doi: 10.1016/j.ejps.2003.10.012. [DOI] [PubMed] [Google Scholar]
- 13.Vyas T, SA, Marathe S, Misra A. Curr Drug Deliv. 2005;2(2):165–175. doi: 10.2174/1567201053586047. [DOI] [PubMed] [Google Scholar]
- 14.Ullrich KJ. J Membr Biol. 1997;158(2):95–107. doi: 10.1007/s002329900247. [DOI] [PubMed] [Google Scholar]
- 15.Suhre WM, Ekins S, Chang C, Swaan PW, Wright SH. Mol Pharmacol. 2005;67(4):1067–1077. doi: 10.1124/mol.104.004713. [DOI] [PubMed] [Google Scholar]
- 16.http://www.molinspiration.com. molinspiration webpage. In.
- 17.Clark M, Cramer RD, OpdenBosch N. J Comput Chem. 1989;10:982–1012. [Google Scholar]
- 18.Cramer RD, Patterson DE, Bunce JD. J Am Chem Soc. 1988;110(18):5959–5967. doi: 10.1021/ja00226a005. [DOI] [PubMed] [Google Scholar]
- 19.Berman HM, Westbrook J, Feng Z, Gilliland G, Bhat TN, Weissig H, Shindyalov IN, Bourne PE. Nucleic Acids Res. 2000;28(1):235–242. doi: 10.1093/nar/28.1.235. [DOI] [PMC free article] [PubMed] [Google Scholar]
- 20.Lemmen C, Lengauer T, Klebe G. J Med Chem. 1998;41(23):4502–4520. doi: 10.1021/jm981037l. [DOI] [PubMed] [Google Scholar]
- 21.Singer AG, Beauchamp GK, Yamazaki K. PNAS. 1997;94(6):2210–2214. doi: 10.1073/pnas.94.6.2210. [DOI] [PMC free article] [PubMed] [Google Scholar]
- 22.Willse A, Belcher AM, Preti G, Wahl JH, Thresher M, Yang P, Yamazaki K, Beauchamp GK. Anal Chem. 2005;77(8):2348–2361. doi: 10.1021/ac048711t. [DOI] [PubMed] [Google Scholar]
- 23.Ullrich KJ, Rumrich G, Kloss S. Pflugers Arch. 1987;409(6):547–554. doi: 10.1007/BF00584652. [DOI] [PubMed] [Google Scholar]
- 24.Ullrich KJ, Rumrich G, Fritzsch G, Kloss S. Pflugers Arch. 1987;408(1):38–45. doi: 10.1007/BF00581838. [DOI] [PubMed] [Google Scholar]
- 25.Golbraikh A, Tropsha A. J Mol Graph Model. 2002;20(4):269–276. doi: 10.1016/s1093-3263(01)00123-1. [DOI] [PubMed] [Google Scholar]
- 26.Nakamura T. Comp Biochem Physiol A Mol Integr Physiol. 2000;126(1):17–32. doi: 10.1016/s1095-6433(00)00191-4. [DOI] [PubMed] [Google Scholar]
- 27.Johnson BA, Leon M. J Comp Neurol. 2000;426(2):330–338. doi: 10.1002/1096-9861(20001016)426:2<330::aid-cne12>3.0.co;2-5. [DOI] [PubMed] [Google Scholar]
- 28.Schnabolk GW, Youngblood GL, Sweet DH. Am J Physiol Renal Physiol. 2006;291(2):F314–321. doi: 10.1152/ajprenal.00497.2005. [DOI] [PMC free article] [PubMed] [Google Scholar]
- 29.Ullrich KJ, Rumrich G, Kloss S. Pflugers Arch. 1988;413(2):134–146. doi: 10.1007/BF00582523. [DOI] [PubMed] [Google Scholar]
- 30.Ullrich KJ, Rumrich G, Kloss S. Kidney Int. 1989;36(1):78–88. doi: 10.1038/ki.1989.164. [DOI] [PubMed] [Google Scholar]
- 31.Ullrich KJ, Rumrich G, Wieland T, Dekant W. Pflugers Arch. 1989;415(3):342–350. doi: 10.1007/BF00370886. [DOI] [PubMed] [Google Scholar]
- 32.Ullrich KJ, Rumrich G, Papavassiliou F, Kloss S, Fritzsch G. Pflugers Arch. 1991;418(4):360–370. doi: 10.1007/BF00550874. [DOI] [PubMed] [Google Scholar]
- 33.Ullrich KJ, Rumrich G, Papavassiliou F, Hierholzer K. Pflugers Arch. 1991;418(4):371–382. doi: 10.1007/BF00550875. [DOI] [PubMed] [Google Scholar]
- 34.Chang C, Swaan PW, Ngo LY, Lum PY, Patil SD, Unadkat JD. Mol Pharmacol. 2004;65(3):558–570. doi: 10.1124/mol.65.3.558. [DOI] [PubMed] [Google Scholar]
- 35.Ekins S, Johnston JS, Bahadduri P, D'Souza VM, Ray A, Chang C, Swaan PW. Pharm Res. 2005;22(4):512–517. doi: 10.1007/s11095-005-2505-y. [DOI] [PubMed] [Google Scholar]
- 36.West IC. Biochim Biophys Acta. 1997;1331(3):213–234. doi: 10.1016/s0304-4157(97)00007-5. [DOI] [PubMed] [Google Scholar]
- 37.Lemieux MJ, Huang Y, Wang DN. Curr Opin Struct Biol. 2004;14(4):405–412. doi: 10.1016/j.sbi.2004.06.003. [DOI] [PubMed] [Google Scholar]
Associated Data
This section collects any data citations, data availability statements, or supplementary materials included in this article.


