

Abstract
In order to evaluate people’s lifestyle for health maintenance, this paper presents a segmentation method based on multi-sensor data recorded by a wearable computer called eButton. This device is capable of recording more than ten hours of data continuously each day in multimedia forms. Automatic processing of the recorded data is a significant task. We have developed a two-step summarization method to segment large datasets automatically. At the first step, motion sensor signals are utilized to obtain candidate boundaries between different daily activities in the data. Then, visual features are extracted from images to determine final activity boundaries. It was found that some simple signal measures such as the combination of a standard deviation measure of the gyroscope sensor data at the first step and an image HSV histogram feature at the second step produces satisfactory results in automatic daily life event segmentation. This finding was verified by our experimental results.
I. INTRODUCTION
Improvement in lifestyle has received increasing attention by the public in recent years because lifestyle has high significance in health maintenance and disease prevention. If accurate lifestyle data can be acquired from individuals objectively, healthcare professionals will be able to advice and monitor their lifestyle more effectively. For example, lifestyle data can be used to monitor and control calorie intake and expenditure, environmental pollutant exposure, and psychosocial stress. In recent years, lifestyle data collection and analysis have become an emerging research field in biomedical engineering.
Electronic devices and sensors such as camera, audio recorder, and motion sensors (including accelerometer and gyroscope) have been used to record daily life data in free-living individuals. Data captured by these sensors act as an electronic diary which records events and experiences of an individual’s daily life. A wrist-worn activity detector containing a 3-axis accelerometer was developed for motion recording [1]. A shoe-based portable physical activity monitor was investigated containing five pressure sensors and a 3-axis accelerometer [2]. Besides these sensors, the gyroscope, which measures orientation, has been used for gait analysis [3]. The SenseCam [4], which is worn around the neck using a lanyard, takes about 3,000 images each day for life experience recording.
In order to capture not only physical activities involving body motions, but also sedentary activities and social events, such as TV watching, eating and social interaction we have investigated a wearable device called eButton [5] embedded with a camera, a gyroscope, an accelerometer, a GPS sensor and a number of other sensors. The eButton is worn in front of the chest in the form of a decorated chest pin [6]. In order to save power and reduce amounts of data, eButton takes one picture (640 pixels by 480 pixels) at a low rate between one and five seconds, adjustable by the user. This device acquires approximately 10,000 pictures (assuming a rate of 4 seconds per picture for 12 hours), along with data recorded by other sensors, and saves them on a micro SD card. The sampling rate for motion sensors is set to 30Hz.
Despite the use of relatively low data rates, it takes a long time to analyze the large dataset if the analysis is performed manually, such as by the user oneself. In order to reduce data analysis burden and help the user recall past activities when the recorded data are examined, an automatic data segmentation algorithm is very helpful. This algorithm compares data epochs sequentially and groups them together when these epochs are similar. As a result, the user does not have to browse thousands of pictures and other data. Instead, he/her only needs to examine a few representative epochs in each data group to identify the segmented event. Because of the high usefulness of this algorithm, it is currently a key component of our data analysis software for lifestyle evaluation.
In the field of image processing, many video and image sequence segmentation methods have been proposed. Most segmentation methods focus on movies or videos. Color and edge features [7], as well as combinations of these and other image features [8], have been used in segmentation algorithms. Motion information, such as motion vectors, has been well studied in image/video segmentation [9]. Mutual information and the joint entropy between frames have been used in shot detection [10]. Many clustering and machine learning methods, such as support vector machine (SVM), have been applied to video boundaries detection [11, 12].
Although image based segmentation algorithms are effective, these algorithms are generally computationally complex. In the wearable system such as the eButton, the location sensor (GPS) and motion sensors including accelerometer sensor and gyroscope are available, providing additional information. Among these sensors, the GPS data are often unavailable in the indoor environment. We thus focus on motion sensors for activity segmentation. Many features such as the mean, standard deviation, kurtosis, spectral energy, signal-magnitude area and autoregressive coefficients have been utilized to classify activities [1, 13]. However, most existing algorithms do not target the detection of event boundaries. Although the CombMNZ algorithm is proposed to fuse accelerometer, visual data and light sensor data for segmentation of life log data acquired by the SenseCam [4], it is assumed that the number of segments during each day is fixed, and the computational cost is relatively high.
II. SEGMENTATION ALGORITHM
A. Overview of Proposed Segmentation Method
In order to segment multi-sensor data quickly and efficiently, we proposed a two-step segmentation method which combines motion and image features as shown in Fig. 1. The first step of this method detects candidate boundaries according to extracted motion features. At the second step, images in the neighborhoods of candidate boundaries are examined for a similarity evaluation. Because the second step is applied to a small portion of the recorded images, our algorithm is significantly faster than the existing ones which require examination of all images in the dataset.
Figure 1.

Flow chart of the proposed method
B. Motion Feature Extraction
Since the data from motion sensors provides basic activity information without details, this type of data is ideal for the first-step, coarse-level segmentation. In our device, motion sensors contain an accelerometer and a gyroscope, which are both three-axis sensors capable of characterizing motion in vector forms. Because, in this step, we are more interested in the computational speed than the segmentation precision, simple signal measures such as the standard deviation (STD) within a certain window is calculated from the motion data in each axis. In order to simplify computation further, we sum the STD values for all three axes to form a new feature which is called a S-STD feature. Fig. 2(a) and (b) show typical raw data of the accelerometer and gyroscope, respectively, captured in the same time interval. Fig. 2(c) and Fig. 2(d) show, respectively, the S-STD features of the 3-axis accelerometer and gyroscope data. It can be clearly seen that S-STD features are effective in describing the levels of motion. The S-STD values close to zero represent inactive activities, and large values indicate more active activities.
Figure 2.
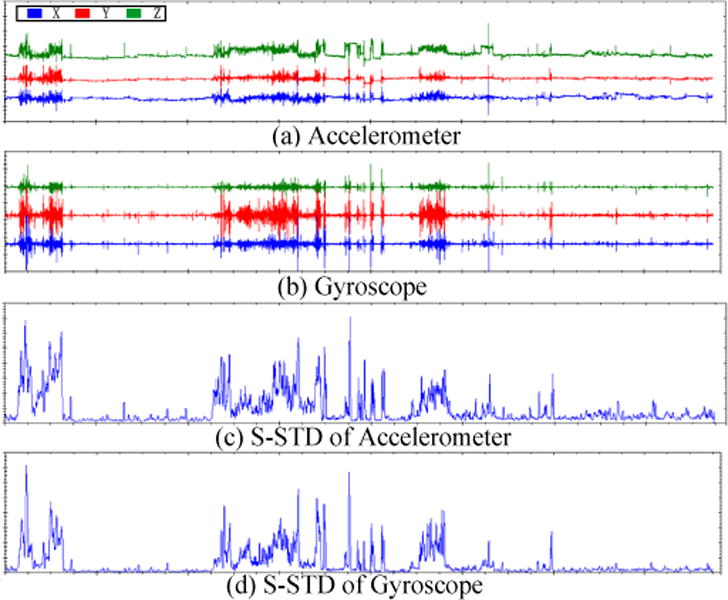
Accelerometer and gyroscope data
C. Motion Data Segmentation
In the first step of data processing, all motion data are divided into a set of segments using a threshold value. Three types of segments are defined according to their lengths: short segment (SS), long inactive segment (IS) and long active segment (AS) for the second step of data processing based on image features. The value of threshold Tm is determined experimentally which will be discussed in the experiment section.
The reason why we define these three segments is because different segment lengths are used in the second processing step. For example, SSs are considered insignificant segments which will be merged with long segments. For IS and AS, the degree of motion is an important factor to indicate whether two adjacent segments should be kept or combined. Detailed description will be provided in Section E.
D. Image Features Extraction
In the second step of data processing, image features are used to fine-tune the boundaries detected in the first step to achieve a higher accuracy. There are many image features to be selected, such as the scale-invariant feature transform (SIFT), HSV histogram, edge histogram, and color layer [14]. Since the frame rate of image data captured by the eButton is very low and the variations between adjacent images are large, many features suitable for a regular frame rate (e.g., 30 frames/second) are not be suitable in our case. We found that global color features could handle the low-rate data more effectively. The color histogram of the HSV channel is one of these features to distinguish different segments. Moreover, the HSV histogram can be calculated more rapidly than other features such as the SIFT and the Edge Histogram Descriptor (EHD). In order to reduce variance in the output, we compute the HSV histogram from a group of images instead of a single image according to Mi = min{|Si|, 100}, where |Si| is the number of images in the ith segment of the first-step segmentation results. Then, the mean of HSV histograms among Mi images is referred to the Segment-HSV feature of Si, denoted by S-HSV.
E. Image data Segmentation Step
Two image processing modules are designed in the second data processing step. Briefly, Image Processing Module I (IPM-I) is designed to determine whether there are new activities within a long segment, while IMP-II handles the cases where a single SS segment or multiple continuous SS segments are combined to form a new segment.
Image Processing Module I: In this module, all images belong to a long active or inactive segment according to the motion sensor data. However, for some cases, it is possible that more than one activities occur in this segment. For instance, after walking outside for a long time, a subject enters a mall for shopping. Walking outside and shopping are considered two different activities, but they are not differentiable from the motion sensor data.
In order to detect activities hidden in motion features, we equally cut the segment Si into sub segments from P1 to Pk in every 5 minutes, where k is the number of sub segments. Image feature distance between adjacent subsegments is calculated. If D (Pk, Pk−1) ≥ Thist, the boundary between two subsegments is marked as a new boundary, where D (Pk, Pk−1) is the distance between Pk and Pk−1, and Thist is a threshold set experimentally as described in Section III.
Image Processing Module II: Our segmentation goal in this module is to help subject recall major events during the day, rather than short and insignificant events. When the duration of SS segments is less than threshold Td, for both Si−1 and Si+1, there are two conditions: (1) if one label is AS and the other label is IS, segment Si will be merged with the AS segment; (2) If the labels of Si−1 and Si+1 are the same, the image feature distance between Si−1 and Si+1 is calculated. If D (Si−1, Si+1) ≥ Thist, Si will be merged with Si−1, otherwise Si−1, Si and Si+1 will be combined into one single segment.
When the duration of continuous SS segments is equal to or greater than threshold Td, We will determine which segments will be merged based on the similarity measure between the current and previous/next segments. If the current segment is determined to be different from any of the neighboring segments, it is denoted as one independent segment. Otherwise, it is combined with one neighboring segment. Specifically, we calculate image feature distance D(Si−1,si) and D(Si+1,si) according to the following criteria:
Once all segments are processed, the final segmentation results are obtained and presented to the user for manual identification of the activity within each segment.
III. EXPERIMENTS
A. Datasets
In our experiments, a total of twelve-day data were recorded from six human subjects, including weekdays and weekends. For each subject, two days of data were selected according to the completeness of the datasets. All subjects were not asked to modify their usual daily activities and the data were captured under free-living conditions. The duration of each selected dataset was longer than ten hours. Each sequence consisted of gyroscope data, accelerometer data, and more than 10,000 images.
All six subjects reviewed their own test data and marked activity boundaries manually as the ground truth. To evaluate the performance of the proposed method, the following measures were utilized:
| (1) |
where Nc is the number of boundaries in the ground truth, Nm is the number of missing boundaries, and Nf is the number of false boundaries. F1 is a performance measure widely utilized in pattern recognition and information retrieval fields. It is the harmonic mean of both recall and precision [15].
B. Threshold determination
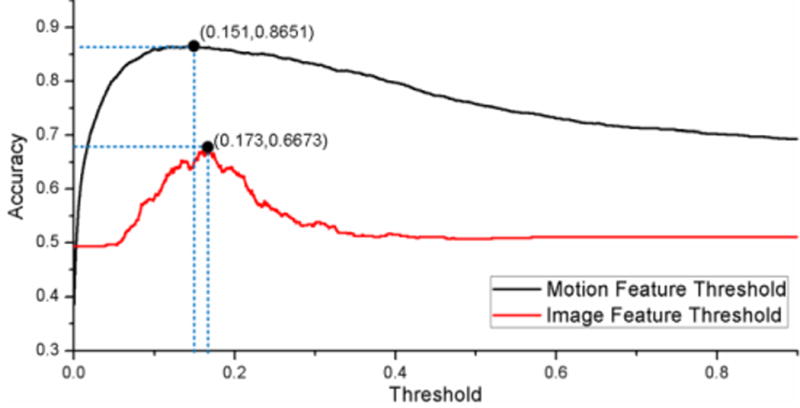
Two thresholds, including Tm for the motion feature and Thist for the image feature, are important parameters distinguishing boundaries of activities. These parameters were determined by the following empirical means. Since we have large amounts of data recorded, we utilized ten days of data to manually classify between active and inactive activities. Then, the accuracies under different threshold values were calculated using the manual classification result as the gold standard. The top curve in Fig. 3 shows the accuracy in terms of S-STD computed from the gyroscope data versus the threshold value. It can be observed that Tm equal to 0.151 provides the best performance.
Figure 3.
Accuracies based on motion and image features versus thresholds
Similarly, in the image feature case, we determined threshold Thist by manually segmenting the same ten days of data into activity sequences. Two sets of similarities were calculated. Firstly, each single segment was equally divided into two sub-segments, and the similarity between these two sub-segments was calculated to form the first set. Next, similarities between adjacent segments were calculated and grouped into the second set. The threshold which best separates these two sets was determined to be Thist. The bottom curve in Fig. 3 shows the accuracy under different threshold values. It can be observed that, when Thist equals to 0.173, the accuracy is the highest (66.73%).
C. Test on different motion sensor features
In our experiments, the features computed from different types of motion sensors were compared in order to demonstrate which sensor or sensor combination provides the most information. Table I shows the F1 values defined in (1) computed using different motion sensors. In this table, GYR and ACC denote, respectively, the motion data acquired by the gyroscope and accelerometer. DER denotes a different feature proposed in [4] which is a combination of derivatives along three axes of acceleration, smoothed by a Gaussian filter using a window function. From Table I, the F1 value of S-STD of the gyroscope data provides the best results. Besides the S-STD of the gyroscope, DER of the accelerometer also provides good results. It is thus concluded that both the gyroscope and accelerometer data are suitable choices to characterize motion in the recorded daily activity.
TABLE I.
PERFORMANCE ON DDIFFERENT MOTION FEATURES
| Recall | Precision | F1 | |
|---|---|---|---|
| GYR+DER | 0.63 | 0.76 | 0.69 |
| ACC+(S-STD) | 0.67 | 0.71 | 0.69 |
| ACC+DER | 0.76 | 0.67 | 0.72 |
| GYR+(S-STD) | 0.82 | 0.69 | 0.75 |
D. Test on Different window Sizes and Overlaps
The effects of different data sampling window sizes and their overlaps were evaluated in our experiments. The windows sizes tested were 16, 32, and 64 seconds, and the overlaps tested were 0%, 50% and 75%. Our results are shown in Table II. It can be observed that the 50% overlap and the 32 second window size performed the best among all choices. It can also be observed that the cases of a small window with any overlap and any window without overlap both yield poor performance. It may be explained that the noise effect may be responsible for the performance reduction in these cases. As seen from Table II, for the 64-second window case, the result is slightly inferior to that of the 32-second window. This may be caused by the loss of some detail information due to the excessive large window size.
TABLE II.
PERFORMANCE ON DIFFERENT WINDOW SIZES AND OVERLAPS
| Length(s) | Overlap | Recall | Precision | F1 |
|---|---|---|---|---|
| 16 | 75% | 0.73 | 0.57 | 0.64 |
| 16 | 50% | 0.75 | 0.62 | 0.68 |
| 64 | 0% | 0.72 | 0.65 | 0.68 |
| 16 | 0% | 0.77 | 0.63 | 0.69 |
| 32 | 0% | 0.76 | 0.69 | 0.72 |
| 64 | 50% | 0.79 | 0.68 | 0.73 |
| 64 | 75% | 0.8 | 0.68 | 0.74 |
| 32 | 75% | 0.79 | 0.69 | 0.74 |
| 32 | 50% | 0.82 | 0.69 | 0.75 |
E. Evaluation between single sensor and proposed method
Finally, we conducted an experiment to compare our method with the methods using a single type of sensor data (gyroscope data or the image data). Fig. 4 presents F1 curves of the three methods with respect to twelve days of data (horizontal axis). It can be seen that our method provides the best result. Although our method examines both types of data, its computational cost is still low because the image processing procedure is performed only using a small portion of the image data in the neighborhood of candidate activity boundaries.
Figure 4.
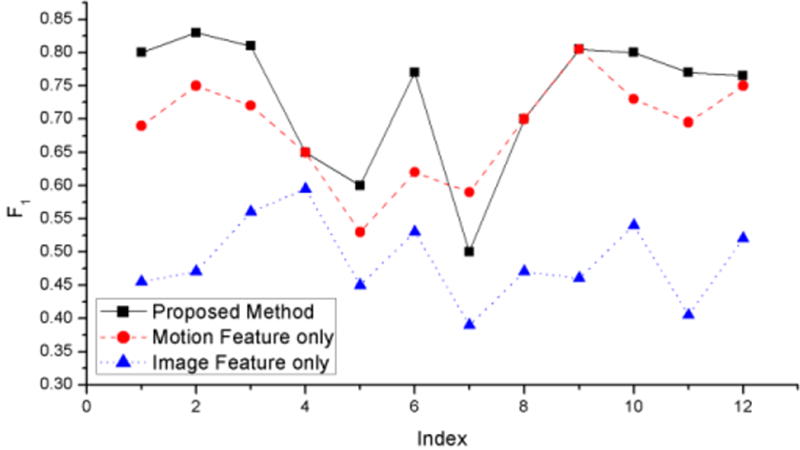
Performance comparison of using combined features and a single feaure
IV. CONCLUSION
In this paper, a two-step method for multi-sensor data segmentation has been proposed. In this method, the S-STD feature of the gyroscope is first extracted to generate a set of candidate boundaries. Then, the Segment-HSV feature is utilized to fine-tune the result in the neighborhood of candidate boundaries to enhance performance. Using the proposed method, the multi-sensor daily life data recorded by a wearable device can be automatically segmented into a relatively small set of activities, which greatly reduces the task of activity recognition which is currently conducted manually. Automatic daily event recognition algorithms are currently being studied by our and other research groups.
Footnotes
This work was supported by National Institutes of Health Grants No. R01CA165255 and U01HL91736 of the United States, and the National Key Basic Research Program No. 2010CB735903 of China.
Contributor Information
Zhen Li, Email: lizhen0130@gmail.com, Zhen Li is with Dept. of Computer Science and Technology, Ocean University of China, Qingdao, China and Dept. of Neurosurgery, University of Pittsburgh, Pittsburgh, PA, USA.
Zhiqiang Wei, Email: weizhiqiang@ouc.edu.cn, Zhiqiang Wei is with Dept. of Computer Science and Technology, Ocean University of China, Qingdao, China.
Wenyan Jia, Email: wej6@pitt.edu, Wenyan Jia is with Dept. of Neurosurgery, University of Pittsburgh, Pittsburgh, PA, USA.
References
- 1.Gyllensten IC, Bonomi AG. Identifying Types of Physical Activity with a Single Accelerometer: Evaluating Laboratory-trained Algorithms in Daily Life. IEEE Trans on Biomedical Engineering. 2011;58(9):2656–2663. doi: 10.1109/TBME.2011.2160723. [DOI] [PubMed] [Google Scholar]
- 2.Zhang T, Tang W, Sazonov ES. IEEE International Conference on Engineering in Medicine and Biology Society. 2012. Classification of posture and activities by using decision trees; pp. 4353–4356. [DOI] [PubMed] [Google Scholar]
- 3.Tong K, Granat MH. A practical gait analysis system using gyroscopes. Medical Engineering & Physics. 1999;21(2):87–94. doi: 10.1016/s1350-4533(99)00030-2. [DOI] [PubMed] [Google Scholar]
- 4.Doherty AR, Smeaton AF, Lee K, Ellis DP. RIAO 2007 - Large-Scale Semantic Access to Content (Text, Image, Video and Sound) 2007. Multimodal segmentation of lifelog data. [Google Scholar]
- 5.Sun M, Fernstorm J, Jia W, Hackworth SA, Yao N, Li Y, Li C, Fernstrom MH, Sclabassi RJ. A wearable electronic system for objective dietary assessment. Journal of the American Dietetic Association. 2010;110:45–47. doi: 10.1016/j.jada.2009.10.013. [DOI] [PMC free article] [PubMed] [Google Scholar]
- 6.eButton description. Available: http://www.lcn.pitt.edu/ebutton/
- 7.Browne P, Smeaton AF, Murphy N, O’Connor N, Marlow S, Berrut C. Proc Irish Machine Vision and Image Processing Conference. 2000. Evaluation and combining digital video shot boundary detection algorithms; pp. 108–114. [Google Scholar]
- 8.Grana C, Cucchiara R. Linear transition detection as a unified shot detection approach. IEEE Trans on Circuits System for Video Technol. 2007;17(4):483–489. [Google Scholar]
- 9.Rasheed Z, Shah M. Scene detection in hollywood movies and TV shows. Proc IEEE International Conference on Computer Vision and Pattern Recognition. 2003;2:343–348. [Google Scholar]
- 10.Cernekova Z, Pitas I, Nikou C. Information theory-based shot cut/fade detection and video summarization. IEEE Trans on Circuits and Systems for Video Technology. 2006;16(1):82–91. [Google Scholar]
- 11.Tavanapong W, Zhou J. Shot clustering techniques for story browsing. IEEE Trans on Multimedia. 2004;6(4):517–526. [Google Scholar]
- 12.Feng H, Fang W, Liu S, Fang Y. A new general framework for shot boundary detection based on SVM. Proc International Conference on Neural Networks and Brain. 2005;2:1112–1117. [Google Scholar]
- 13.Khan AM, Lee Y, Lee SY, Kim T. A triaxial accelerometer-based physical-activity recognition via augmented-signal features and a hierarchical recognizer. IEEE Trans on Information Technology in Biomedicine. 2010;14(5):1166–1172. doi: 10.1109/TITB.2010.2051955. [DOI] [PubMed] [Google Scholar]
- 14.Chang S, Sikora T, Purl A. Overview of the MPEG-7 standard. IEEE Trans on Circuits and Systems for Video Technology. 2001;11(6):688–695. [Google Scholar]
- 15.Powers DMW. Evaluation: from precision, recall and F-factor to ROC, informedness, markedness & correlation. Journal of Machine Learning Technologies. 2011;2(1):37–63. [Google Scholar]