

Abstract
Mouse visual cortex is subdivided into multiple distinct, hierarchically organized areas that are interconnected through feedforward (FF) and feedback (FB) pathways. The principal synaptic targets of FF and FB axons that reciprocally interconnect primary visual cortex (V1) with the higher lateromedial extrastriate area (LM) are pyramidal cells (Pyr) and parvalbumin (PV)-expressing GABAergic interneurons. Recordings in slices of mouse visual cortex have shown that layer 2/3 Pyr cells receive excitatory monosynaptic FF and FB inputs, which are opposed by disynaptic inhibition. Most notably, inhibition is stronger in the FF than FB pathway, suggesting pathway-specific organization of feedforward inhibition (FFI). To explore the hypothesis that this difference is due to diverse pathway-specific strengths of the inputs to PV neurons we have performed subcellular Channelrhodopsin-2-assisted circuit mapping in slices of mouse visual cortex. Whole-cell patch-clamp recordings were obtained from retrobead-labeled FFV1→LM- and FBLM→V1-projecting Pyr cells, as well as from tdTomato-expressing PV neurons. The results show that the FFV1→LM pathway provides on average 3.7-fold stronger depolarizing input to layer 2/3 inhibitory PV neurons than to neighboring excitatory Pyr cells. In the FBLM→V1 pathway, depolarizing inputs to layer 2/3 PV neurons and Pyr cells were balanced. Balanced inputs were also found in the FFV1→LM pathway to layer 5 PV neurons and Pyr cells, whereas FBLM→V1 inputs to layer 5 were biased toward Pyr cells. The findings indicate that FFI in FFV1→LM and FBLM→V1 circuits are organized in a pathway- and lamina-specific fashion.
Introduction
It has been known for decades that primate visual cortex contains multiple functionally specialized areas (Felleman and Van Essen, 1991). Several years ago a similar organization was proposed for rodent visual cortex (Wagor et al., 1980; Montero, 1993), but it was only recently that visuotopic maps became available for mouse visual cortex (Wang and Burkhalter, 2007). Several studies have since shown that the mapped parcels have distinct connections and response properties, suggesting that the subdivisions represent separate visual areas (Andermann et al., 2011; Marshel et al., 2011; Wang et al., 2011, 2012). Among the distinctive attributes, receptive field size was found to be larger in extrastriate areas than in V1. This indicates that neurons in higher areas integrate inputs across larger parts of the visual field, suggesting convergence of inputs and representation of visual information in areas at multiple levels (Wang and Burkhalter, 2007). Connections between areas can be classified as feedforward (FF) and feedback (FB), according to the laminar projection patterns (Coogan and Burkhalter, 1993; Dong et al., 2004a). This led us to propose that rodent visual cortex is a processing hierarchy in which FF connections carry information from lower to higher areas, whereas FB connections return top-down influences to lower areas (Coogan and Burkhalter, 1993).
Studies in rodents have shown that FF and FB connections synapse onto pyramidal (Pyr) cells and parvalbumin (PV)-expressing interneurons (Gonchar and Burkhalter, 1999, 2003). Recordings in slices of mouse visual cortex have further shown that FF and FB inputs activate layer 2/3 Pyr cells by direct excitation, which is opposed by disynaptic feedforward inhibition (FFI) from excitation of GABAergic interneurons (Shao and Burkhalter, 1996; Dong et al., 2004b). This organization resembles the findings from whole-cell recordings of synaptically connected pairs of excitatory and fast spiking neurons in mouse barrel cortex, which showed that thalamocortical excitation is opposed by FFI (Cruikshank et al., 2007).
The strength of FFI is a key determinant of the timing of neuronal processing where it is important for the selection of coincident sensory inputs and for the effective propagation of impulses to downstream targets (Bruno, 2011). Although recordings from layer 2/3 Pyr cells suggest that FF inputs from V1 to the higher area, lateromedial extrastriate (LM), generate stronger disynaptic inhibition than the returning FB inputs (Dong et al., 2004b), it is not known whether inputs to PV neurons are stronger than to Pyr cells. To address this question, we have used subcellular Channelrhodopsin-2-assisted circuit mapping (sCRACM; Petreanu et al., 2009) and whole-cell recordings from PV neurons, as well as FFV1→LM- and FBLM →V1-projecting Pyr cells, to determine the relative strengths of FFV1→LM and FBLM→V1 inputs. Here, we show that FFV1→LM inputs to layer 2/3 PV neurons are 3.7-fold stronger than to Pyr cells, whereas FBLM→V1 inputs to layer 2/3 and layer 5 PV neurons and Pyr cells are balanced. FBLM→V1 inputs to layer 5 Pyr cells are stronger than to PV neurons. Together, these results suggest that FFI is pathway and layer specific, poised to modulate interareal synchronization in network-specific fashion.
Materials and Methods
All experimental procedures were approved by the Institutional Animal Care and Use Committee at Washington University and conformed to the National Institutes of Health guidelines.
Animals.
Experiments were performed in male and female wild-type C57BL/6J and PV-Cre (Hippenmeyer et al., 2005; Jax: 008069) × Ai9 reporter mice (Jax: 007905), harboring the loxP-flanked STOP cassette, which prevented the transcription of the tdTomato protein driven by the chicken β-actin (CAG) promoter (Madisen et al., 2010). The crossing produced Cre-mediated recombination, which resulted in the expression of red fluorescent tdTomato labeling in the subset of PV-positive GABAergic neurons (Gonchar et al., 2007).
Labeling of FF and FB connections.
Fifteen to 21-d-old mice were anesthetized intraperitoneally with a mixture of ketamine/xylazine (20 mg/kg/3 mg/kg) and secured in a stereotaxic apparatus. Intracerebral tracer injections were made with glass pipettes (tip diameter 20 μm) connected to a Nanoject II Injector (Drummond). Injections were performed stereotaxically into V1 (2.9 mm lateral of midline, 0.85 mm anterior of transverse sinus [TS]) and the higher visual area LM (4.0 mm lateral of midline, 1.4 mm anterior of TS), 0.3 and 0.5 mm below the pial surface, to assure uniform labeling throughout the thickness of cortex. To simultaneously label axon terminals of neurons with outgoing projections including the cells of origin of returning connections, we injected a 3:1 suspension of viral vector (AAV2/1.CAG.ChR2-Venus.WPRE.SV40; Vector Core) mixed with rhodamine-labeled microspheres (retrobeads; LumaFluor; Katz et al., 1984). The total volume of AAV2/1/retrobead mixture at each depth was 46 nl. Successful injections resulted in the simultaneous expression of Channelrhodopsin-2 (ChR2) in terminals of outgoing axons (FFV1→LM, FBLM→V1) and retrobead-labeled neurons (FBLM→V1, FFV1→LM) of the returning connections at overlapping sites.
Identification of V1 and LM.
With the ultimate goal to identify V1 and LM in coronal slices, we first determined the locations of virus/retrobead injections in flatmounted sections, a format that allows easy identification of visual cortical areas (Wang and Burkhalter, 2007). Injections were made at postnatal day 16 at representations of the upper visual field in the posterior half of V1 and LM (for coordinates see above), respectively (Wang et al., 2011). In the same mice we also retrogradely labeled the callosal connections by multiple pressure injections (Picospritzer; Parker-Hannafin; glass pipettes; tip diameter 20 μm) of bisbenzimide (Sigma; 5% in H2O) into the contralateral occipital cortex. After 21 d survival, mice were overdosed with ketamine/xylazine, perfused through the heart with PBS, pH 7.4, followed by 1% paraformaldehyde (PFA) in 0.1 m phosphate buffer (PB). Virus-injected hemispheres were flatmounted (Wang et al., 2012), postfixed in 4% PFA in PB, and cryoprotected in 30% sucrose. Frozen sections were cut at 40 μm in the tangential plane. Sections were mounted onto glass slides and imaged under a fluorescence microscope equipped with a CCD camera (CoolSnap; Roper). A second set of virus/retrobead-injected mice was used to study the laminar organization of FFV1→LM and FBLM→V1 connections in coronal sections. Layers were revealed by counterstaining Nissl substance with NeuroTrace 435/455 (Invitrogen). The V1/LM border was revealed by immunostaining with an antibody against the muscarinic type 2 acetylcholine receptor (m2AChR: MAB367; Millipore) visualized with Alexa Fluor 647-labeled secondary antibody (A21247; Invitrogen).
Slice preparation.
Brain slices were prepared from 35- to 38-d-old virus/retrobead-injected tdTomato-PV mice. Animals were overdosed with isoflurane, transcardially perfused with 10 ml of ice-cold oxygenated 95% O2/5% CO2 dissection solution containing the following (in mm): 110 choline chloride, 25 NaHCO3, 25 d-glucose, 11.6 sodium ascorbate, 7 MgCl2, 3.1 sodium pyruvate, 2.5 KCl, 1.25 NaH2PO4, 0.5 CaCl2, pH 7.4, 290–300 mOsm. The brain was quickly removed from the skull, transferred to a moist filter paper, blocked, and mounted rostral side down with instant brush-on Krazy Glue (Elmer's) onto the specimen plate of a Vibratome (Leica VT1200). Coronal brain slices from the occipital pole were cut (speed 0.14 mm/s, amplitude 1.1 mm, 85 Hz) at 350 μm in ice-cold dissection solution. The second, third, and fourth slices (counted from the occipital pole) were transferred to an incubation chamber filled with oxygenated artificial CSF (ACSF) containing the following (in mm): 125 NaCl2, 2.5 KCl, 1.25 NaH2PO4, 25 NaHCO3, 2.0 CaCl2, 1.0 MgCl2, and 25 d-glucose at 37°C. After 30–40 min, slices were transferred to a holding chamber in which they were maintained in oxygenated ACSF at room temperature (22°C) for the duration of the experiment (4–5 h).
Electrophysiology and dendritic morphology.
Recordings were performed in a submersion chamber (Warner RC22-C) mounted on the fixed stage of a modified upright microscope (Nikon Eclipse FN1). Slices were superfused (1.5 ml/min) with recirculating oxygenated ACSF at 22°C. To assess the viability of each slice, we first performed whole-cell current-clamp recordings in ACSF. We next added tetrodotoxin (1 μm), 4-aminopyridine (4-AP; 100 μm) and 3-((R)-2-carboxypiperazin-4-yl)-propyl-l-phosphonic acid (CPP; 5 μm; Tocris Bioscience) to the bath to block action potentials, fast repolarizing potassium currents, and NMDA receptor-mediated excitatory postsynaptic responses, respectively (Petreanu et al., 2009). Whole-cell recordings were obtained with borosilicate pipettes (resistance 4–6 MΩ) and an Axopatch 700B amplifier (Molecular Devices). The pipette solution contained the following (in mm): 128 potassium gluconate, 4 MgCl2, 10 HEPES, 1 EGTA, 4 Na2ATP, 0.4 Na2GTP, 10 sodium phosphocreatine, 3 sodium l-ascorbate, 0.02 Alexa-594 (Invitrogen), and 3 mg/ml biocytin, pH 7.25, 290 mOsm. Neurons centered within the ChR2-expressing projection column across layers 1–6 of V1 or LM, were selected for recording. Recordings were made 50–120 μm below the surface of the slice. Pyr cells and PV neurons were selected by shape under DIC-IR illumination and/or under fluorescence optics by the labeling with retrobeads or the expression of tdTomato. For reconstruction of dendritic arbors, neurons were filled with Alexa Fluor 594 hydrazide and biocytin. Alexa fluorescence was imaged with a CCD camera (Retiga-2000DC; Qimaging). Biocytin was visualized post hoc after fixing slices in 4% PFA, quenching of endogenous peroxidases with 1% H2O2, and incubation in avidin and biotinylated horse radish peroxidase (Vectastain ABC Elite) in the presence of diaminobenzidine (DAB). The DAB reaction product was intensified with AgNO3 and HAuCl2 (Jiang et al., 1993). Biocytin-filled neurons were reconstructed with a 40× oil objective (1.3 NA) using Neurolucida (MicroBrightField). For sCRACM mapping, EPSCs were recorded under voltage clamp at a holding potential of −70 mV. Access resistance was always <30 MΩ and the resting membrane potentials were <−55 mV. Both parameters were stable during recordings. Unstable recordings were excluded from analysis. Data were acquired using Ephus software (Suter et al., 2010).
Photostimulation.
Photostimulation was performed with a blue laser (473 nm; CrystaLaser) and beam position was controlled by galvanometer scanners (Cambridge Scanning). The laser light passed through an air objective (4× PlanApo, NA 0.2; Nikon), which at 0.25 mW formed a beam at half maximal intensity with a diameter of ∼20 μm in the specimen plane. The durations and intensities of the light pulses were controlled with a Pockels cell (ConOptics) and a shutter (LS6, Uniblitz). Because the proportion and labeling intensity of ChR2-expressing axons varied across slices and animals, the laser power (0.1–1 mW) was adjusted in every slice to evoke EPSCsCRACM (EPSCs recorded by subcellular ChR2-assisted circuit mapping) in Pyr cells with maximal amplitudes of 50–150 pA. The laser power was constant for all recordings made in a vertical column across layers 1–6 of a single slice. Recordings were performed from pairs of nearby Pyr cells and PV neurons in layers 2/3 and 5. Each trial consisted of 100 ms baseline, followed by the photostimulus (1–2 ms) and 300 ms of response. Photostimulation was performed in an 8 × 16 grid in which individual points were spaced 50 μm apart and the grid was aligned to the pial surface with the long axis perpendicular to the layers. The stimulation sequence was pseudorandom allowing maximal intervals between nearby stimulation sites. sCRACM maps for each neurons were repeated three to five times for each neuron.
Data analysis
EPSCsCRACM amplitude.
The amplitude of significant responses was >6 times the SD of the baseline. Individual pixel values of sCRACM maps were computed from the mean EPSCsCRACM amplitude in a 75 ms response window after the photostimulus. For each neuron, maps were averaged across three to five repetitions. These averages represent synaptic charge transfer. Because the responses were dominated by the current amplitude and small long-lasting currents were negligible, we have adopted the simplification introduced by Petreanu et al. (2009) and represent responses in pA instead of Coulomb. The charge value for each pixel in a 75 ms window was calculated using custom MATLAB software. As EPSCsCRACM are measured at the soma, which for layer 5 Pyr is several hundred micrometers proximal of inputs to distal dendrites, we compensated for electrotonic filtering by estimating the dendritic attenuation of the synaptic conductance (g) using the equation (Petreanu et al., 2009):
 |
where r(x, y) is the distance from the soma of the photostimulation site, and λ = 270 μm is the space constant estimated in rat layer 5 Pyr (Williams and Mitchell, 2008). To display the compensated magnitudes and spatial distributions of FFV1→LM and FBLM→V1 inputs to Pyr cells and PV neurons, maps from individual slices for each cell class were peak normalized within individual slices and averaged across different slices. Comparisons of inputs to Pyr cells and PV neurons were made by plotting the average responses from pairs (≤100 μm apart) of Pyr cells and PV neurons within layers 2/3 and 5 of the same slice. FFV1→LM and FBLM→V1 to Pyr cells and PV neurons recorded in the same layer and same slice were plotted against each other and the relative strengths of inputs were assessed by the mean slope from zero. Significance (p < 0.05) was assessed with the Wilcoxon signed-rank test.
Subcellular distribution of inputs.
To determine the subcellular distribution and laminar pattern of FFV1→LM and FBLM→V1 inputs to Pyr cells and PV neurons, we measured the vertical distance of the soma from the pial surface. To assess the subcellular distribution of FFV1→LM and FBLM→V1 inputs to Pyr cells and PV neurons we determined the maximal response and location across three repeats for each cell. We then scaled the mean responses, recorded by stimulating vertically and tangentially displaced sites, to the peak response. Relative response amplitudes were then plotted as functions of the vertical distance from the pial surface and tangential distance from the soma. The t test was used for statistical comparisons; the variability of mean responses is indicated by SEM.
Results
Identification of FF and FB connections between V1 and LM
We have shown previously that V1 projects to multiple areas of extrastriate cortex (Wang and Burkhalter, 2007). Three of these areas, posterior (P), LM, and anterolateral (AL), adjoin the lateral border of V1, but only LM and V1 are of interest here. In coronal slices used for sCRACM, V1 was readily distinguished from lateral extrastriate cortex (V2L of Franklin and Paxinos, 2007) by its heavy myelination (Dong et al., 2004b). LM resides in posterior V2L, but lacks obvious distinguishing features in coronal slices. However, in flatmounted cortex, LM can easily be distinguished from AL as an area in the posterior half of the acallosal zone lateral to V1 (Wang et al., 2011). To demonstrate this, we traced the connections from the upper visual field representation of V1 to LM, AL, and laterointermediate (LI) with ChR2, and retrogradely labeled the callosal landmarks with bisbenzimide. The results showed a large acallosal zone next to a callosally connected strip at the lateral border of V1 (Fig. 1A). Within the acallosal zone, we found three distinct ChR2-expressing clusters of axon terminals, representing the projections from V1 to LM, AL, and LI. The largest and most intensely labeled cluster in the posterior/medial quadrant of the acallosal zone represented inputs to LM (Fig. 1A; Wang and Burkhalter, 2007). LM differs from V1 by its 46-fold weaker input from the lateral geniculate nucleus (Sanderson et al., 1991). More importantly for the study here, FFV1→LM and FBLM→V1 inputs show distinctive laminar patterns, indicating that LM is hierarchically higher than V1 (Coogan and Burkhalter, 1993; Dong et al., 2004a; Fig. 1C,D). ChR2 injections into the upper visual field representation of LM-labeled FBLM→V1 connections at the topographically corresponding location of V1 (Fig. 1B). Together, these results show that the upper field representations of LM, AL, and LI occupy distinct regions within the acallosal zone, indicating that ChR2 injections at a posteromedial location label area-specific FB connections to V1. We then used this topographic information for assigning injections/projections to LM in coronal slices in which LM cannot be easily distinguished from AL. In coronal slices, ChR2-expressing FFV1→LM projections terminated most densely in layers 2/3 and 5, whereas inputs to layers 1 and 6 were extremely sparse (Fig. 1C). Because injections were made in tdTomato-PV mice, the same slice also contained red fluorescent PVs distributed across layers 2–6 (Fig. 1C). FBLM→V1 projections were strongest in layer 1, the bottom half of layer 5 and layer 6 (Fig. 1D). Much weaker FBLM→V1 inputs were found in layer 2/3 and the superficial half of layer 5. FBLM→V1 inputs to layer 4 were extremely sparse. Although for sCRACM experiments in tdTomato-PV mice, FFV1→LM and FBLM→V1 projections were traced with ChR2 and retrobeads, for clarity, we show here an example of ChR2-expressing FBLM→V1 projections in a wild-type mouse in which FFV1→LM-projecting Pyr cells were labeled with red fluorescent retrobeads. It is important to note that punctate red retrobeads in Pyr cells were readily distinguished from the uniform distribution of the red tdTomato protein in PV neurons (Fig. 1C,D, insets). Similar to previous findings, FFV1→LM-projecting Pyr cells were slightly more numerous in superficial layers (Fig. 1D; Coogan and Burkhalter, 1988). No obvious laminar differences were found in the density of FBLM→V1-projecting Pyr cells (data not shown).
Figure 1.
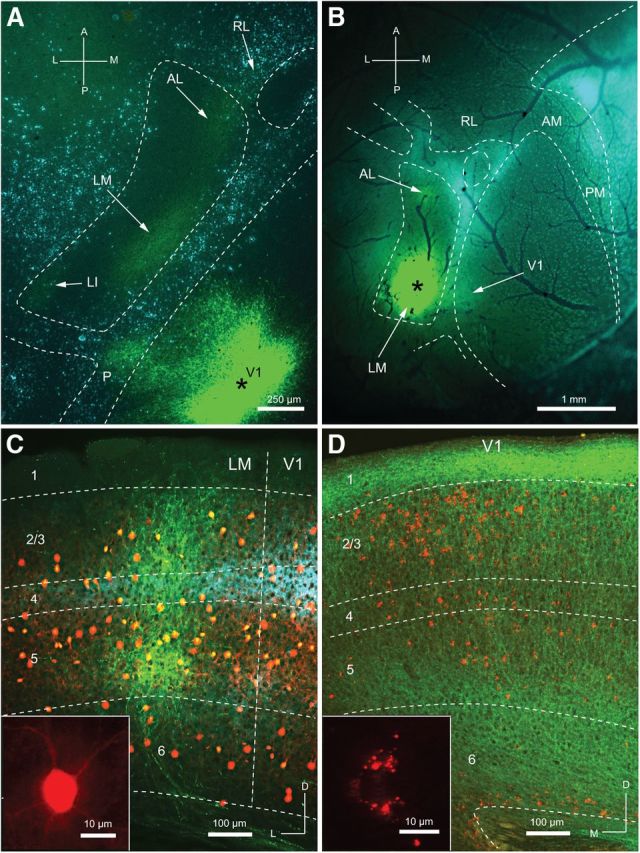
ChR2 expression in FF and FB pathways between V1 and LM. A, Section through layer 2/3 of flattened cerebral cortex showing ChR2 expressing FF connections from V1 to areas LM, AL, and LI. The asterisk marks the AAV2/1.CAG.ChR2-Venus.WPRE.SV40 injection site in V1. Arrows indicate ChR2-expressing terminal fields in LM, AL, and LI. Blue labeling represents callosally projecting neurons marked by retrograde transport of bisbenzimide from the opposite hemisphere. The dashed lines outline callosally connected cortex. Notice that areas LM, AL, and LI are contained in the large acallosal region lateral to V1. B, In situ image of ChR2 expression after AAV injection into LM (asterisk). Arrows indicate weakly labeled projections to V1 and AL. Blue labeling, outlined by the dashed lines, indicates callosally connected cortex. Dark branches represent blood vessels on the surface of the cortex. C, Coronal section showing ChR2-expressing FFV1→LM projection (green) terminating in layers 2/3, 4, and 5 of LM. Red cell bodies in layer 2–6 represent tdTomato-expressing PV neurons (yellow indicates overlap with ChR2-expressing fibers). Blue immunostaining represents m2AChR expression. Notice that the m2AChR-labeled band in layers 3 and 4 is wider in V1 than LM. The transition coincides with the V1/LM border. The inset shows uniform expression of tdTomato in a PV neuron. D, Coronal section showing ChR2-expressing FBLM→V1 projection (green) terminating most densely in layers 1, deep 5, and 6. Weaker projections terminate in layers 2/3, 4, and superficial 5. Retrobead-labeled neurons represent FFV1→LM-projecting Pyr cells. The inset shows the distinctive punctate pattern of retrobead labeling in layer 2/3 Pyr cells. A, anterior; M, medial; P, posterior; L, lateral; D, dorsal; RL, rostrolateral area; AM, anteromedial area; PM, posteromedial area.
Physiological identification of Pyr cells and PV neurons
For whole-cell recordings in slices, retrobead-labeled FFV1→LM- and FBLM→V1-projecting Pyr cells were identified by the punctate red fluorescent labeling of the cytoplasm (Fig. 2A,B). Current-clamp recordings of action potentials evoked in response to depolarizing current steps were obtained from layer 2/3 and layer 5 Pyr cells (Fig. 2C). In Pyr cells, the action potentials were broad, after hyperpolarizing potentials were shallow and spike frequency showed pronounced adaptation, consistent with the regular spiking phenotype of Pyr cells (Table 1; McCormick et al., 1985). Depolarizing current injections into tdTomato-expressing PV neurons produced narrow action potentials, deep afterhyperpolarizations, and nonadapting spike trains (Fig. 2D–F), consistent with fast spiking properties (Table 1; Ascoli et al., 2008). We found no significant differences in the intrinsic membrane properties of layer 2/3 Pyr cells and PV neurons in V1 and LM.
Figure 2.

Identification of Pyr cells and PV neurons in slices of visual cortex. Differential interference contrast image of Pyr cell (A) and PV neuron (D) with recording pipette (arrow) filled with Alexa 594 and biocytin (B, E). Current-clamp recording from retrobead-labeled FFV1→LM-projecting Pyr cell (B) shows that a depolarizing current step evokes an adapting (regular spiking) train of action potentials (C). Recording from a tdTomato-expressing PV neuron shows a nonadapting (fast spiking) train of spikes (F).
Table 1.
Intrinsic physiological properties of Pyr cells and PV neurons in layer 2/3 of V1 and LM
| V1 |
LM |
|||
|---|---|---|---|---|
| PyrV1→LM n = 14 |
PV n = 14 |
PyrLM→V1 n = 13 |
PV n = 19 |
|
| RMP (mV) | −72 ± 2 | −71 ± 2 | −74 ± 3 | −70 ± 2 |
| Rin (MΩ) | 157 ± 5 | 209 ± 7 | 163 ± 3 | 226 ± 4 |
| Cm (F/cm2) | 76 ± 3 | 23 ± 6 | 72 ± 3 | 26 ± 9 |
| APth (mV) | −43 ± 2 | −44 ± 1 | −44 ± 2 | −39 ± 2 |
| APhw (ms) | 2 ± 0.1 | 1 ± 0.1 | 2 ± 0.1 | 1 ± 0.2 |
| AHP (mV) | −3 ± 1 | −14 ± 2 | −2 ± 0.1 | −14 ± 1 |
| Spikeadaptation | 2 ± 1 | 1 ± 0.1 | 2 ± 0.1 | 1 ± 0.1 |
RMP, resting membrane potential; Rin, input resistance; Cm, capacitance; APth, action potential threshold; APhw, action potential half-width at half maximal amplitude; AHP, afterhyperpolarization; Spikeadaptation, spike adaptation expressed as ratio of first/last interspike interval.
Mapping FF and FB inputs to Pyr cells and PV neurons in layers 2/3 and 5
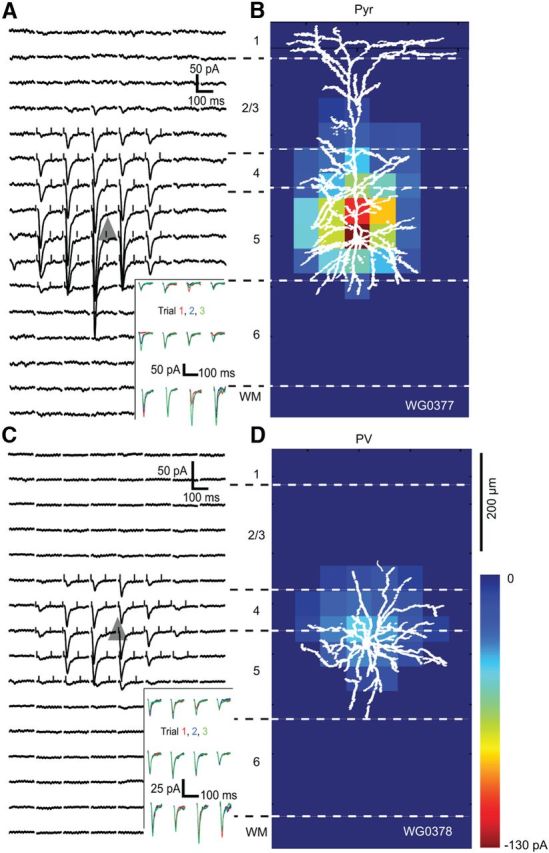
We performed sCRACM to determine and compare the strengths of FFV1→LM and FBLM→V1 inputs to retrobead-labeled FBLM→V1- and FFV1→LM-projecting Pyr cells and tdTomato-expressing PV neurons. Because the density of FFV1→LM and FBLM→V1 projections, as well as the strength of ChR2 expression, varied between mice and slices, we limited between-cell comparisons to Pyr cells and PV neurons that were centered in the ChR2-expressing projection and located within the same layer. For example, in the case illustrated in Figure 3 we expressed ChR2 in the FBLM→V1 pathway, whose axon terminal density profile is shown in Figure 8D. We then stimulated the ChR2-expressing axon terminals in a coronal slice by delivering laser pulses on a 8 × 16 grid (blue dots) and recorded EPSCsCRACM from four Pyr cells (white, gray, black) and two PV neurons (red). All recorded cells were filled with biocytin and the dendritic trees were reconstructed. For between-cell comparisons of FBLM→V1 inputs to Pyr cells and PV neurons, we used two pairs, one in layer 2/3 (white Pyr, red PV) the other in layer 5 (black Pyr, red PV). Two additional Pyr cells were recorded in layers 4 and 6 but were discarded because they lacked PV partners in the same layer. Similar recordings from Pyr-PV pairs were performed in the FFV1→LM pathway, whose density profile of ChR2-labeld axons is shown in Figure 8A. No effort was made to determine whether Pyr-PV pairs were synaptically connected.
Figure 3.
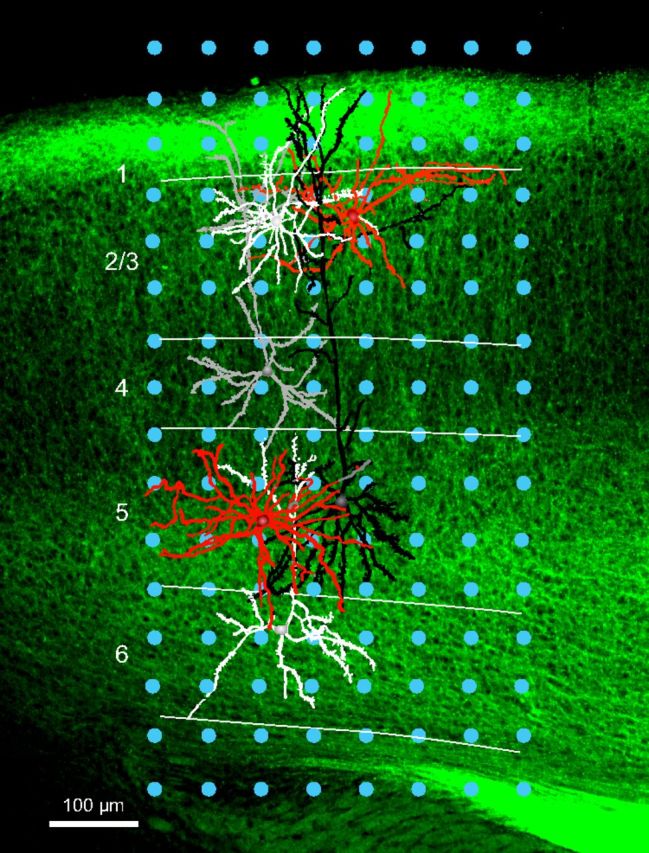
sCRACM in pairs of Pyr cells and PV neurons. Coronal slice through V1, showing ChR2-expressing FBLM→V1 axon terminations (green). Blue dots indicate the 8–16 grid (50 μm spacing) in which laser photostimuli were applied. Whole-cell patch-clamp recordings were obtained from FFV1→LM-projecting Pyr cells in layers 2/3 (white), 4 (gray), 5 (black), and 6 (white) as well as in PV neurons (red) of layers 2/3 and 5. Pyr cells and PV neurons were filled with biocytin, dendrites were reconstructed and overlaid with the fluorescent image of the slice. EPSCsCRACM of pairs of Pyr and PV neurons recorded in the same layer (i.e., 2/3, 5) were used to compare the strengths of FBLM→V1 inputs.
Figure 8.
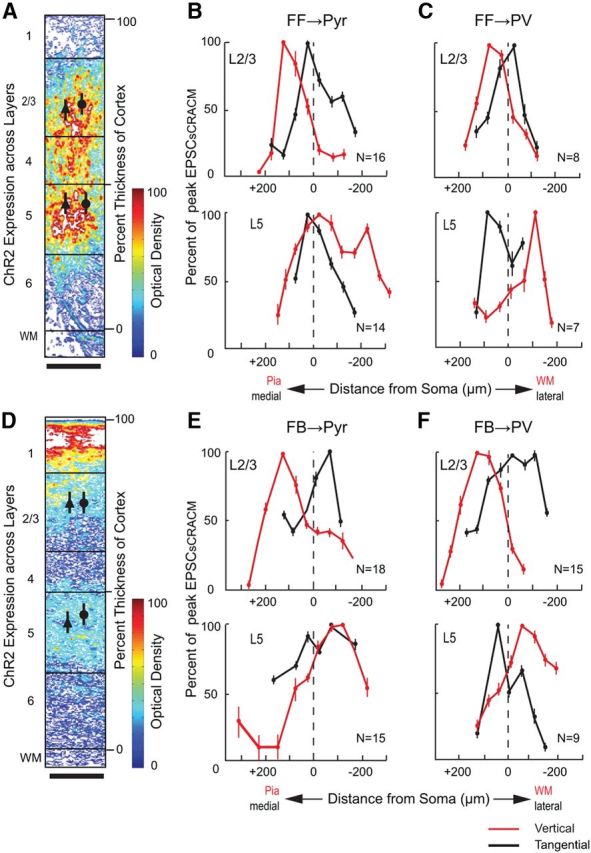
Vertical and horizontal extent of FFV1→LM and FBLM→V1 inputs to Pyr cells and PV neurons in layer 2/3 and 5. Optical density of ChR2-expressing FFV1→ LM (A) and FBLM→ V1 (D) inputs to different layers of V1 and LM, respectively. Mean (±SEM) EPSCsCRACM (scaled to peak response within layer), evoked by FFV1→LM and FBLM→V1 input to layer 2/3 and 5 Pyr cells (B, E) and PVs (C, F). Red lines indicate responses at different vertical locations. Stippled line indicates the location of the soma. Positive distances indicate sites approaching to the pia, negative distances point toward white matter (WM). Black lines indicate responses at different locations of the tangential plane. Positive indicates medial and negative indicates lateral. Scale bars: A, D, 100 μm.
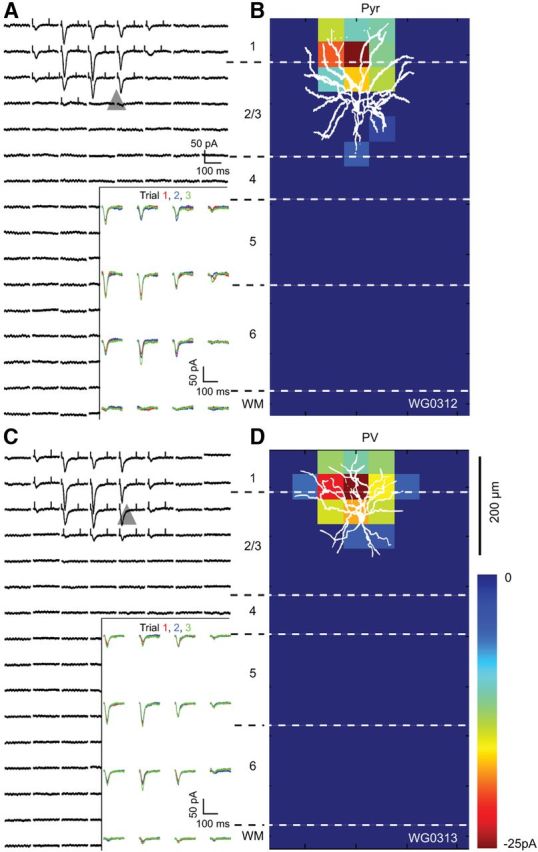
FFV1→LM input
Layer 2/3
Representative maps of EPSCsCRACM, generated by stimulation of FFV1→LM inputs to Pyr cells and PV neurons, are shown in Figure 4. Inputs to a FBLM→V1-projecting Pyr cells in layer 2/3 were distributed across a horizontally elongated 250 × 200 μm field in which the optimal EPSCsCRACM were clustered around the soma (triangle) and smaller responses originated from stimulations at more distal locations (Fig. 4A). The amplitudes and dynamics of EPSCsCRACM were highly reproducible across multiple consecutive trials (Fig. 4A, inset). Figure 4B shows a map of the average FFV1→LM input strength to a biocytin-filled layer 2/3 Pyr cell, in which EPSCsCRACM from matching locations were averaged across trials and displayed as pixel values. It is evident that the extent of the apical region of the dendritic tree closely matched the map of FFV1→LM inputs. The overlap across the basal arbor was slightly less extensive, suggesting that FFV1→LM inputs to basal dendrites are less effective than inputs to apical branches. A similar subcellular distribution was found for the population of layer 2/3 Pyr cells (located 225 ± 35 μm below the pial surface; Fig. 8A) whose mean FFV1→LM inputs 120 μm superficial to the soma, were significantly stronger than the inputs 100 μm below the soma (p < 0.01, t test; Fig. 8B). In the tangential plane, FF inputs to layer 2/3 Pyr cells were symmetrical about the cell body (Fig. 8B).
Figure 4.
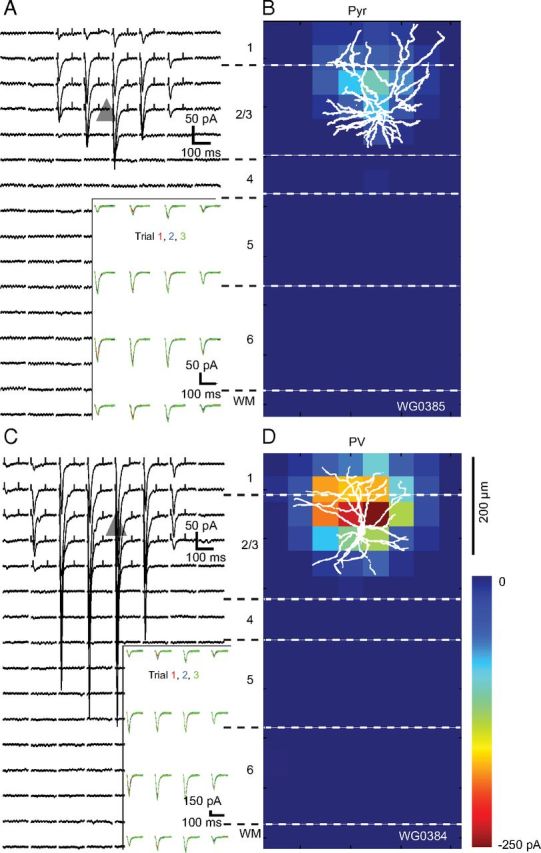
EPSCsCRACM maps of an FFV1→LM input to a pair of Pyr and PV neurons recorded in layer 2/3 of LM of the same slice. A, Whole-cell patch-clamp recordings of EPSCsCRACM from a retrobead-labeled FBLM→V1-projecting Pyr cell whose soma is represented by the gray triangle. Each trace corresponds to a response evoked by a laser photostimulus delivered to ChR2-expressing FFV1→LM axon terminals at specific locations of an 8 × 16 grid (50 μm spacing) aligned to the surface of cortex and extending across layers 1–6. Inset shows consecutive EPSCsCRACM, demonstrating that responses were reproducible across multiple trials. Ticks at the beginning and end of the traces indicate the window used for calculating the pixel values shown in the heat map shown in B. B, Heat map of FFV1→LM inputs to Pyr cell shown in A. The pixel values are proportional to the strength of synaptic input at a given location. The overlay of the biocytin-filled Pyr cell shows that the distribution of synaptic inputs largely coincides with the dendritic arbor. C, EPSCsCRACM map of FFV1→LM input to a nearby layer 2/3 PV neuron. Inset shows that responses were consistent across multiple trials. D, Shows the heat map of FFV1→LM responses from PV neuron, whose dendritic tree is well matched to the synaptically active region. Notice that FFV1→LM inputs to PV neuron are stronger than to the FBLM→V1-projecting Pyr cell.
Recordings of EPSCsCRACM in the same slice from a paired, layer 2/3 PV (mean vertical/horizontal separation: 15 ± 4/45 ± 7 μm) are shown in Figure 4C and D. Compared with FFV1→LM inputs to the nearby Pyr cell the peak responses measured in PV neurons were approximately threefold larger. In addition, inputs to PV neurons were strong across a wider radius of the dendritic arbor. Even in distal dendrites, responses matched the amplitude of peak inputs to Pyr cells (Fig. 4C,D). FFV1→LM inputs to PV dendrites at the layer 1/2 border were stronger than to basal dendrites in the lower half of layer 2/3. Similar results were found in the distribution of the mean FFV1→LM input to a group of PV neurons (located 210 ± 35 μm below pia; Fig. 8A) in which the inputs superficial to the soma were significantly (p < 0.05) stronger than below the soma (Fig. 8C).
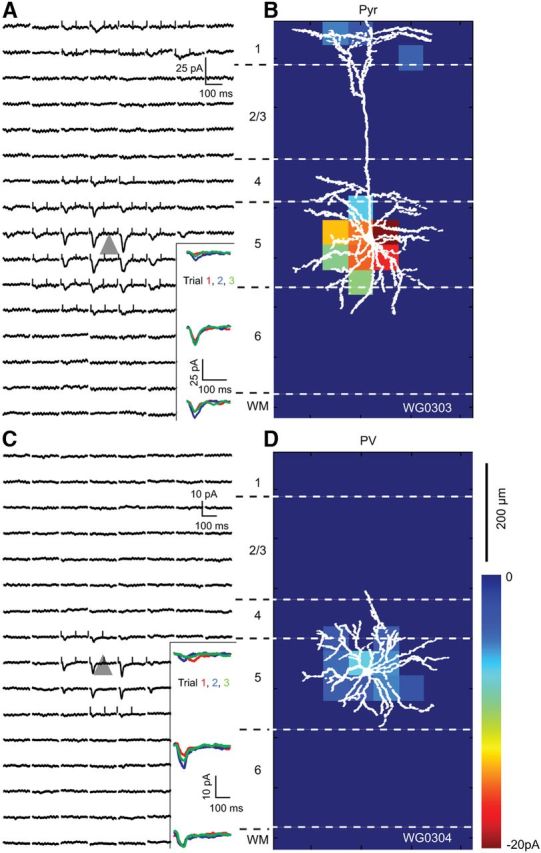
Layer 5
In sharp contrast to layer 2/3, the relative strength of FFV1→LM input to layer 5 Pyr cells and PVs was more balanced. In fact, in many cases inputs were clearly biased toward Pyr cells (Fig. 5A–D). Most FFV1→LM inputs to FBLM→V1-projecting Pyr cells activated basal and perisomatic dendrites in layers 4 and 5 (Fig. 5A,B). Inputs to apical dendrites were weak in layer 2/3 or absent in layer 1. This distribution was representative for the population of layer 5 Pyr cells (430 ± 45 μm below pia), which showed significantly (p < 0.05) stronger FFV1→LM inputs to basal than apical dendrites (Fig. 8B). In the tangential plane, FFV1→LM inputs to layer 5 Pyr cells were symmetrical about the cell body (Fig. 8B).
Figure 5.
EPSCsCRACM maps of an FFV1→LM input to a pair of Pyr and PV neurons recorded in layer 5 of LM of the same slice. A, Whole-cell patch-clamp recordings of EPSCsCRACM from a retrobead-labeled FBLM→V1-projecting layer 5 Pyr cell whose soma is represented by the gray triangle. Each trace corresponds to a response evoked by a laser photostimulus delivered to ChR2-expressing FFV1→LM axon terminals at specific locations of an 8 × 16 grid (50 μm spacing) aligned to the surface of cortex and extending across layers 1–6. Inset shows consecutive EPSCsCRACM, demonstrating that responses were reproducible across multiple trials. Ticks at the beginning and end of the traces indicate the window used for calculating the pixel values shown in the heat map shown in B. B, Heat map of FFV1→LM inputs to Pyr cell shown in A. The pixel values are proportional to the strength of synaptic input at a given location. The overlay of the biocytin-filled Pyr cell shows that the distribution of synaptic inputs largely coincides with the basal dendritic tree. There are no inputs to the apical tuft in layer 1, consistent with the paucity of ChR2-expressing FFV1→LM projections (Fig. 1C). C, EPSCsCRACM map of FFV1→LM input to a nearby layer 5 PV neuron. Inset shows that responses were consistent across multiple trials. D, Shows the heat map of FFV1→LM responses from PV neuron, whose dendritic tree is well matched to the synaptically active region. Notice that FFV1→LM inputs to PV neuron are weaker than to Pyr cell.
In many cases FFV1→LM inputs to layer 5 PVs were weaker than inputs to layer 5 FBLM→V1-projecting Pyr cells (Fig. 5C,D). On average, though, the strengths of FFV1→LM inputs to layer 5 Pyr cells and PVs were similar (Fig. 9B). FFV1→LM inputs to layer 5 PV neurons (420 ± 40 μm below pia; mean vertical 7 ± 15 μm/horizontal 29 ± 15 μm from Pyr) were radially symmetric and strongest within ∼100 μm of the soma (Fig. 8C).
Figure 9.

Balance of FFV1→LM input strength to FBLM→V1-projecting Pyr cells and PV neurons. A, Comparison of FFV1→LM input (summed pixels of significant EPSCsCRACM) to pairs of layer 2/3 Pyr cells and PVs recorded in same slice from nine mice. Red lines in A and B represent the mean slope from zero. B, Comparison of FFV1→LM input (summed pixels of significant EPSCsCRACM) to pairs of layer 5 Pyr cells and PVs recorded in same slice from 10 mice. C, Relative size of FFV1→LM input to PVs and Pyr neurons in layers 2/3 and 5. Errror bars indicate SEM.
FBLM→V1 input
Layer 2/3
Figure 6, A–D, shows representative examples of EPSCsCRACM elicited by photostimulation of FBLM→V1 inputs to a Pyr-PV pair (mean vertical/horizontal separation: 5 ± 10/37 ± 11 μm) in superficial layer 2/3. FBLM→V1 inputs to the FFV1→LM-projecting Pyr cell were strongest near the soma (Fig. 6A,B). Unlike FFV1→LM inputs, FBLM→V1 inputs to layer 2/3 FFV1→LM-projecting Pyr cells were strong even in the most superficial parts of layer 1 (Figs. 4B, 6B). The strong input from layer 1 was confirmed in the mean FBLM→V1 response of a group of layer 2/3 FFV1→LM-projecting Pyr cells (located 195 ± 45 μm below pia; Fig. 8D), which showed that inputs were stronger (p < 0.05) 200 μm superficial to the soma (corresponding to layer 1) than to basal dendrites and threefold larger (p < 0.05) than FFV1→LM inputs (Fig. 8B,E). FBLM→V1 inputs to basal dendrites evoked little or no responses (Fig. 6C). The decay in the mean response to inputs below the soma was less dramatic (Fig. 8E).
Figure 6.
EPSCsCRACM maps of an FBLM→V1 input to a pair of Pyr and PV neurons recorded in layer 2/3 of V1 of the same slice. A, Whole-cell patch-clamp recordings of EPSCsCRACM from a retrobead-labeled FFV1→LM-projecting Pyr cell, whose soma is represented by the gray triangle. Each trace corresponds to a response evoked by a laser photostimulus delivered to ChR2-expressing FF axon terminals at specific locations of an 8 × 16 grid (50 μm spacing) aligned to the surface of cortex and extending across layers 1–6. Inset shows consecutive EPSCsCRACM, demonstrating that responses are reproducible across multiple trials. Ticks at the beginning and end of the traces indicate the window used for calculating the pixel values shown in the heat map (B). B, Heat map of FBLM→V1 inputs to Pyr cell shown in A. The pixel values are proportional to the strength of synaptic input at a given location. Overlay of the FBLM→V1 input map with the biocytin-filled Pyr cell, showing that the distribution of inputs coincides mainly with the ascending dendritic arbor. C, EPSCsCRACM map of FBLM→V1 input to layer 2/3 PV neuron. Inset shows that responses are consistent across multiple trials. D, Represents the heat map of FBLM→V1 responses from PV neuron, whose dendritic tree overlaps with the synaptically active region. Notice that FBLM→V1 inputs to PV neuron and Pyr cell are similar.
Unlike in the FFV1→LM pathway in which inputs to layer 2/3 PV neurons dominated responses in Pyr cells (Fig. 4), the strength of FBLM→V1 connections to PV neurons and Pyr cells were similar suggesting more balanced inputs to excitatory and inhibitory neurons (Fig. 6B,D). FBLM→V1 inputs to PV neurons were strongly biased toward dendrites in superficial parts of layer 2/3 including layer 1 and produced only weak responses in basal dendrites (Fig. 6D). A similarly asymmetrical distribution of inputs (p < 0.01) was found in a group of layer 2/3 PV neurons (located 195 ± 14 μm below pia; Fig. 8D,F). Consistent with the preference of FBLM→V1 inputs for layers 1/2, the mean relative response 200 μm superficial to the soma was threefold stronger (p < 0.05) in the FBLM→V1 than the FFV1→LM pathway (Fig. 8C,F).
Layer 5
Figure 7, A and B, show a representative example of FBLM→V1 input to a layer 5 FFV1→LM-projecting Pyr cell. The overall strength of FBLM→V1 inputs was weak and similar to FBLM→V1 to layer 2/3 Pyr (Fig. 6A). The subcellular distribution of responses was strongly biased toward basal dendrites near the cell body, whereas distal inputs were confined to layer 1. A similar pattern was observed in the group average of layer 5 Pyr cells (located 495 ± 50 μm below pia) in which inputs to proximal dendrites were significantly (p < 0.01) stronger than to the apical tuft in layer 1, 300 μm distal to the soma (Fig. 8E). Qualitatively this synaptic input pattern is consistent with the laminar organization of ChR2-expressing FBLM→V1 projections (Fig. 1D). However it is important to note that although the projection is much stronger in layer 1 than 5, the strength of synaptic input is weaker in layer 1 than 5. The likely reason for this mismatch is electrotonic filtering of layer 1 inputs recorded in the distant soma of layer 5 Pyr cells.
Figure 7.
EPSCsCRACM maps of an FBLM→V1 input to a pair of Pyr and PV neurons recorded in layer 5 of LM of the same slice. A, Whole-cell patch-clamp recordings of EPSCsCRACM from a retrobead-labeled FFV1→LM-projecting Pyr cell whose soma is represented by the gray triangle. Each trace corresponds to a response evoked by a laser photostimulus delivered to ChR2-expressing FFV1→LM axon terminals at specific locations of an 8 × 16 grid (50 μm spacing) aligned to the surface of cortex and extending across layers 1–6. Inset shows consecutive EPSCsCRACM, demonstrating that responses were reproducible across multiple trials. Ticks at the beginning and end of the traces indicate the window used for calculating the pixel values shown in the heat map shown in B. B, Heat map of FBLM→V1 inputs to Pyr cell shown in A. The pixel values are proportional to the strength of synaptic input at a given location. The overlay of the biocytin-filled Pyr cell shows that the distribution of synaptic inputs coincides with the basal dendrites in layer 5 and apical dendrites in layer 1. The synaptic inputs to layer 1 are consistent with dense ChR2-expressing FBLM→V1 projections to layer 1 (Fig. 1D). C, EPSCsCRACM map of FBLM→V1 input to a nearby layer 5 PV neuron. Inset shows that responses were consistent across multiple trials. D, Shows the heat map of FBLM→V1 responses from PV neuron, whose dendritic tree is well matched to the synaptically active region. Notice that FBLM→V1 inputs to PV neuron are weaker than to Pyr cell.
Compared with FBLM→V1 inputs to layer 5 Pyr, FBLM→V1 inputs to layer 5 PVs were weak and largely confined to the dendritic arbor within layer 5 (Fig. 7C,D). A similar input pattern was observed in the group average of layer 5 PVs (located 465 ± 45 from pia; mean vertical/horizontal separation from Pyr cell: 22 ± 10/33 ± 11 μm; Fig. 7D), demonstrating that inputs derive from the deep layer portion of the FBLM→V1 projection (Fig. 1D).
Layer 4
Recordings from layer 4 Pyr cells and PV were incomplete. However, results from two cell pairs in the FFV1→LM pathway indicate strong inputs to Pyr cells and PVs, which were biased 3.5:1 toward PVs. In contrast, FBLM→V1 inputs to Pyr and PV were weak and of approximately equal strength.
Balance of FF and FB inputs to Pyr cells and PV neurons
Recordings from pairs of layer 2/3 Pyr cells and PV neurons showed that FFV1→LM inputs to PV neurons dominate inputs to FBLM→V1-projecting Pyr cells, whereas FBLM→V1 inputs to PV neurons and FFV1→LM1-projecting Pyr cells were more balanced (Figs. 4, 6). Direct comparisons of the relative strengths of FFV1→LM and FBLM→V1 inputs across multiple pairs of Pyr cells and PV neurons confirmed these impressions. These comparisons were performed by summing the pixels of significant EPSCsCRACM (>6× SD) of Pyr cells and nearby PVs and plotting the relative strengths of the responses.
FFV1→LM inputs to layer 2/3 were compared in 18 pairs of FBLM→V1-projecting Pyr cells and PV neurons in nine different slices from nine mice. In the vast majority of pairs, we found that FFV1→LM inputs to layer 2/3 PV neurons were larger and on average 3.7-fold stronger than FFV1→LM inputs to layer 2/3 FBLM→V1-projecting Pyr cells (Fig. 9A,C), a difference that is highly significant (p < 0.02). In sharp contrast, recordings from 22 Pyr-PV pairs in layer 5 (in 10 slices from 10 mice) showed that FFV1→LM inputs to PV neurons and FBLM→V1-projecting Pyr cells were more balanced and not significantly different from each other (p = 0.15; Fig. 9B). The mean ratio of FF inputs to layer 5 PV neurons and Pyr cells was 1.5 (Fig. 9C).
FBLM→V1 inputs to layer 2/3 were compared in 2/3 Pyr-PV pairs in10 slices from 10 mice. Unlike in the FFV1→LM pathway, we found that FBLM→V1 inputs to layer 2/3 PV neurons and FFV1→LM-projecting Pyr cells were approximately equal (Fig. 10A). Although the mean FBLM→V1 input to PV neurons was slightly stronger than in Pyr cells, the difference was not statistically significant (p > 0.66). In layer 5, we recorded FBLM→V1 inputs to 17 Pyr-PV pairs in eight slices from eight mice. Interestingly, we found that FBLM→V1 inputs to layer 5 FFV1→LM-projecting Pyr cells were on average 2.7-fold stronger than inputs to PV neurons (p < 0.008; Fig. 10B,C). It is important to note that the bias toward Pyr cells was observed despite the potential underestimation of layer 1 inputs to layer 5 Pyr cells.
Figure 10.

Balance of FBLM→V1 input strength to FFV1→LM-projecting Pyr cells and PV neurons. A, Comparison of FBLM→V1 input (summed pixels of significant EPSCsCRACM) to pairs of layer 2/3 Pyr cells and PV neurons recorded in same slice from 10 mice. Red lines in A and B represent the mean slope from zero. B, Comparison of FBLM→V1 input (summed pixels of significant EPSCsCRACM) to pairs of layer 5 Pyr cells and PV neurons recorded in same slice from eight mice. C, Relative size of FBLM→V1 input to PV neurons and Pyr cells in layers 2/3 and 5. Error bars indicate SEM.
Discussion
We have found that the FFV1→LM pathway provides 3.7-fold stronger depolarizing input to layer 2/3 inhibitory PV neurons than to neighboring excitatory Pyr cells. In contrast, in the returning FBLM→V1 pathway, depolarizing inputs to layer 2/3 PV neurons and Pyr cells were balanced. Balanced inputs were also found in the FFV1→LM pathway to layer 5 PV neurons and Pyr cells, whereas FB inputs to layer 5 were biased 2.7-fold toward Pyr cells. These findings indicate that the E/I balance of FFI in FFV1→LM and FBLM→V1 circuits are pathway and lamina specific. As a result, strong inhibitory opposition to FF inputs narrows the integration window of convergent inputs, selects for coincident impulses, strengthens the reliability of activation of downstream areas, and increases the range over which spike rates are able to represent an increasing number of inputs across progressively higher levels of the cortical hierarchy (Shadlen and Newsome, 1998). In contrast, weak inhibitory opposition to FB excitation broadens the integration window of convergent inputs and increases the probability rather than the timing of responses. Whether this asymmetry applies to all FF and FB connections across the cortical hierarchy is a topic for future studies.
Target neurons of synaptic FF and FB inputs
Layer 2/3
Interareal FF and FB connections in rodent cerebral cortex are formed by glutamatergic Pyr cells without significant contributions from GABAergic neurons (McDonald and Burkhalter, 1993; Caputi et al., 2013). In rat, both pathways originate from layers 2–6 with a bias for superficial layers (Johnson and Burkhalter, 1994). Pyr cells in layers 2–6 fall into distinct populations of intracortically and subcortically projecting neurons (Burkhalter and Charles, 1990; Callaway and Wiser, 1996; Briggs and Callaway, 2005). All of these neurons have local axon collaterals, but only intracortically projecting cells have area-specific connections through which they can be retrobead labeled from V1 and LM (Wang and Burkhalter, 2005; Berezovskii et al., 2011; Petrof et al., 2012; but see Ueta et al., 2013). It is these FFV1→LM- and FBLM→V1-projecting Pyr cells whose synaptic inputs we have studied here.
FF and FB projections between V1and LM distribute inputs across layers 1–6. However, FF inputs to layer 4 are >3-fold more numerous than FB inputs, whereas FB inputs to layer 1 are sixfold stronger than FF inputs (Dong et al., 2004a). In contrast, FF and FB inputs to layers 2/3, 5, and 6 are similar (Dong et al., 2004a). FF and FB inputs to layer 2/3 of rat V1 and LM synapse mainly onto spines of Pyr cells (Johnson and Burkhalter, 1996). In the FBLM→V1 pathway most of these are FFV1→LM-projecting Pyr cells (Johnson and Burkhalter, 1997). Similarly, FF inputs preferentially synapse onto FBLM→V1-projecting Pyr cells. The remaining ∼13% of FF and FB inputs to layer 2/3 contact GABAergic neurons, of which 98% express PV (Gonchar and Burkhalter, 1999). Two percent of inputs go to calretinin- and somatostatin-expressing cells, which is a heterogeneous population of interneurons (Gonchar and Burkhalter, 2003; Gonchar et al., 2007). These data support the assertion that we have stimulated monosynaptic FF and FB inputs to PV neurons, as well as to FBLM→V1- and FFV1→LM-projecting Pyr cells.
We have found that monosynaptic inputs to layer 2/3 PV neurons are 3.7-fold stronger in the FF than FB pathway. This physiological difference fits the threefold higher density of FF than FB terminals (Dong et al., 2004a). However, FF and FB inputs to PV neurons are quantitatively similar (Gonchar and Burkhalter, 2003), suggesting that the physiological pathway-specific difference of inputs to PV neurons may be due to the more proximal location of FF synapses on the dendritic tree (Gonchar and Burkhalter, 1999; Yamashita et al., 2003). In addition, FF synapses onto PV dendrites are larger, contain more mitochondria, and are packed with docked vesicles (Gonchar and Burkhalter, 1999). In contrast, FF and FB synapses onto Pyr cells are structurally similar (Gonchar and Burkhalter, 1999). These observations support the idea that FF synapses onto PV neurons are more efficacious than FB synapses. Previous studies in the thalamocortical system have shown powerful inputs to putative PV neurons (Cruikshank et al., 2007) mediated by distinct glutamate receptors (Hull et al., 2009), suggesting that strong FFI may be a property of FF pathways.
Layer 5
Unlike FF inputs to layer 2/3, FF and FB inputs to layer 5 Pyr cells and PVs were balanced. This is because inputs to PVs are weaker, whereas inputs to layer 5 Pyr cells are similar to those in layer 2/3 (Figs. 9A, 10A). From the strength of FB projections to layer 1 one might expect an even stronger bias for Pyr cells. In fact although we did not significantly truncate distal dendrites and compensated for electrotonic filtering (Petreanu et al., 2009), the mismatch between projection weight and of synaptic inputs to distal and basal dendrites suggests that we have underestimated distal inputs to layer 5 Pyr cells. In the absence of opposing inhibition from PV neurons, FF and FB inputs may more readily depolarize layer 5 Pyr cells, enabling backpropagation of spikes and association of FF and FB with thalamic inputs in dendrites of layers 1/2 (Sherman, 2012; Larkum, 2013).
FFI circuit in FF and FB pathways
Our findings that FF inputs to PV neurons are stronger than FB inputs to PV neurons are supported by recordings from layer 2/3 Pyr cells in mouse visual cortex showing that, in the FF pathway, monosynaptic EPSCs are opposed by bigger disynaptic IPSCs than in the FB pathway (Dong et al., 2004b). These results suggest that in FF and FB pathways Pyr cells and PV neurons receive shared excitatory inputs and Pyr cells receive disynaptic input from PVs. Although FF and FB connections terminate on multiple types of GABAergic neurons the inputs strongly favor PV neurons (Gonchar and Burkhalter, 2003). PV neurons are connected with high probability to Pyr cells (Gonchar and Burkhalter, 1999; Yoshimura and Callaway, 2005; Avermann et al., 2012) and are, therefore, the most likely source of disynaptic FFI of layer 2/3 Pyr cells (Dong et al., 2004b). How inputs to PV neurons differentially affect FFI of Pyr cells in FF and FB pathways is not known. However, recordings in rat V1 suggest that different amounts of inhibition result from different subnetwork organizations (Yoshimura and Callaway, 2005; but see Packer and Yuste, 2011). Specifically, layer 2/3 Pyr cells that are reciprocally connected with fast spiking (putative PVs) cells, which share FF input from layer 4, receive sixfold larger IPSCs than Pyr cells that receive unidirectional inputs from PV neurons and lack common inputs. Thus, it is possible that FFI in the FF pathway employs a subnetwork with shared inputs to reciprocally connected Pyr cells and PV neurons that generates strong inhibition in Pyr cells. In contrast, weaker inhibition generated by FF inputs to layer 5 and FB input to layers 2/3 and 5 may result from interactions within subnetworks in which PV neurons lack excitatory inputs from neighboring Pyr cells.
Functional implications
Our results suggest that FF inputs elicit more powerful FFI than FB inputs. Strong FFI in the thalamocortical pathway was shown to shorten the window for firing spikes in cortical neurons (Gabernet et al., 2005; Cruikshank et al., 2007, 2010). As a result, correlated firing in downstream targets, i.e., area LM, may increase due to temporally coincident afferent input from V1, which may enhance stimulus detection (Alonso et al., 1996; Kremkow et al., 2010). In contrast to the synchronizing effects of PV neuron activation (Cardin et al., 2009; but see Sippy and Yuste, 2013), weak FFI in FB pathways may favor the transmission of asynchronous spikes and influence response probability, rather than timing (Kremkow et al., 2010). Studies in monkey visual cortex have shown that FB influences increase the firing rate of neurons in lower areas (McAdams and Maunsell, 1999). Moreover, attentional FB was shown to decorrelate firing across populations of neurons, improving the sensitivity for discriminating changes in stimulus orientation (Cohen and Maunsell, 2009).
A challenge for neurons in highly interconnected cortical networks is to remain sensitive to a wide range of attributes and strengths of inputs without saturating spike output (Shadlen and Newsome, 1998). Pouille et al. (2009) have proposed a mechanism involving input normalization by FFI that expands the dynamic range over which populations of neurons respond to variable strengths of afferent inputs. In V1 and LM, neurons respond to multiple visual features with up to tenfold changes in instantaneous firing rate (Niell and Stryker, 2008; Gao et al., 2010; Andermann et al., 2011; Marshel et al., 2011). The strong FFI we have found in FF connections is well suited to signal transient events, generate correlated responses in downstream areas, and counteract saturation of responses to multidimensional inputs. Unlike FF processing, FB effects of attention increase firing rates independent of stimulus contrast mainly in the later phase of the response (Lee and Maunsell, 2010), suggesting that FB influences act slowly (Domenici et al., 1995) and over a narrow dynamic range, which is consistent with proportionally weak scaling by less powerful FFI in the FB pathway.
Footnotes
This work was supported by National Eye Institute grants RO1 EY016184, RO1EY20525, and RO1EY022090 and the McDonnell Center for Systems Neuroscience. We thank Karel Svoboda, Tianyi Mao, and Leopoldo Petreanu for their generous support, advice, and hands-on training in sCRACM. Thanks also to Tim O'Connor and Hyun Kim for assistance with programming. Thanks to Katia Valkova for excellent assistance with histology. Thanks to Charles Anderson, Dennis Barbour, Enquan Gao, Zhongsheng Guo, Tim Holy, and Zhiguang Xu for technical advice. Finally, many thanks to Rinaldo D'Souza for his comments on this manuscript.
References
- Alonso JM, Usrey WM, Reid RC. Precisely correlated firing in cells of the lateral geniculate nucleus. Nature. 1996;383:815–819. doi: 10.1038/383815a0. [DOI] [PubMed] [Google Scholar]
- Andermann ML, Kerlin AM, Roumis DK, Glickfeld LL, Reid RC. Functional specialization of mouse higher visual cortical areas. Neuron. 2011;72:1025–1039. doi: 10.1016/j.neuron.2011.11.013. [DOI] [PMC free article] [PubMed] [Google Scholar]
- Ascoli GA, Alonso-Nanclares L, Anderson SA, Barrionuevo G, Benavides-Piccone R, Burkhalter A, Buzsáki G, Cauli B, DeFelipe J, Fairén A, Feldmayer D, Fishell G, Frégnac Y, Freund TF, Gardener D, Gardener EP, Goldberg JH, Helmsteadter M, Hestrin S, Karube F, et al. Petilla terminology: nomenclature of features of GABAergic interneurons of the cerebral cortex. Nat Rev Neurosci. 2008;9:557–568. doi: 10.1038/nrn2402. [DOI] [PMC free article] [PubMed] [Google Scholar]
- Avermann M, Tomm C, Mateo C, Gerstner W, Petersen CC. Microcircuits of excitatory and inhibitory neurons in layer 2/3 of mouse barrel cortex. J Neurophysiol. 2012;107:3116–3134. doi: 10.1152/jn.00917.2011. [DOI] [PubMed] [Google Scholar]
- Berezovskii VK, Nassi JJ, Born RT. Segregation of feedforward and feedback projections in mouse visual cortex. J Comp Neurol. 2011;519:3672–3683. doi: 10.1002/cne.22675. [DOI] [PMC free article] [PubMed] [Google Scholar]
- Briggs F, Callaway EM. Laminar pattern of local excitatory input to layer 5 neurons in macaque primary visual cortex. Cereb Cortex. 2005;15:479–488. doi: 10.1093/cercor/bhh154. [DOI] [PMC free article] [PubMed] [Google Scholar]
- Bruno RM. Synchrony in sensation. Curr Opin Neurobiol. 2011;21:701–708. doi: 10.1016/j.conb.2011.06.003. [DOI] [PMC free article] [PubMed] [Google Scholar]
- Burkhalter A, Charles V. Organization of local axon collaterals of efferent projection neurons in rats visual cortex. J Comp Neurol. 1990;302:920–934. doi: 10.1002/cne.903020417. [DOI] [PubMed] [Google Scholar]
- Callaway EM, Wiser AK. Contributions of individual layer 2–5 spiny neurons to local circuits in macaque primary visual cortex. Vis Neurosci. 1996;13:907–922. doi: 10.1017/S0952523800009159. [DOI] [PubMed] [Google Scholar]
- Caputi A, Melzer S, Michael M, Monyer H. The long and short of GABAergic neurons. Curr Opin Neurobiol. 2013;23:179–186. doi: 10.1016/j.conb.2013.01.021. [DOI] [PubMed] [Google Scholar]
- Cardin JA, Carlén M, Meletis K, Knoblich U, Zhang F, Deisseroth K, Tsai LH, Moore CI. Driving fast-spiking cells induces gamma rhythm and controls sensory responses. Nature. 2009;459:663–667. doi: 10.1038/nature08002. [DOI] [PMC free article] [PubMed] [Google Scholar]
- Cohen MR, Maunsell JH. Attention improves performance primarily by reducing interneuronal correlations. Nat Neurosci. 2009;12:1594–1600. doi: 10.1038/nn.2439. [DOI] [PMC free article] [PubMed] [Google Scholar]
- Coogan TA, Burkhalter A. Sequential development of connections between striate and extrastriate visual cortical areas in the rat. J Comp Neurol. 1988;278:242–252. doi: 10.1002/cne.902780207. [DOI] [PubMed] [Google Scholar]
- Coogan TA, Burkhalter A. Hierarchical organization of areas in rat visual cortex. J Neurosci. 1993;13:3749–3772. doi: 10.1523/JNEUROSCI.13-09-03749.1993. [DOI] [PMC free article] [PubMed] [Google Scholar]
- Cruikshank SJ, Lewis TJ, Connors BW. Synaptic basis for intense thalamocortical activation of feedforward inhibitory cells in neocortex. Nat Neurosci. 2007;10:462–468. doi: 10.1038/nn1861. [DOI] [PubMed] [Google Scholar]
- Cruikshank SJ, Urabe H, Nurmikko AV, Connors BW. Pathway-specific feedforward circuits between thalamus and neocortex revealed by selective optical stimulation of axons. Neuron. 2010;65:230–245. doi: 10.1016/j.neuron.2009.12.025. [DOI] [PMC free article] [PubMed] [Google Scholar]
- Domenici L, Harding GW, Burkhalter A. Patterns of synaptic activity in forward and feedback pathways within rat visual cortex. J Neurophysiol. 1995;74:2649–2664. doi: 10.1152/jn.1995.74.6.2649. [DOI] [PubMed] [Google Scholar]
- Dong H, Wang Q, Valkova K, Gonchar Y, Burkhalter A. Experience-dependent development of feedforward and feedback circuits between lower and higher areas of mouse visual cortex. Vis Res. 2004a;44:3389–3400. doi: 10.1016/j.visres.2004.09.007. [DOI] [PubMed] [Google Scholar]
- Dong H, Shao Z, Nerbonne JM, Burkhalter A. Differential depression of inhibitory synaptic responses in feedforward and feedback circuits between different areas of mouse visual cortex. J Comp Neurol. 2004b;475:361–373. doi: 10.1002/cne.20164. [DOI] [PubMed] [Google Scholar]
- Felleman DJ, Van Essen DC. Distributed hierarchical processing in the primate cerebral cortex. Cereb Cortex. 1991;1:1–47. doi: 10.1093/cercor/1.1.1. [DOI] [PubMed] [Google Scholar]
- Franklin KBJ, Paxinos G. The mouse brain in stereotaxic coordinates. Ed 3. San Diego: Academic; 2007. [Google Scholar]
- Gabernet L, Jadhav SP, Feldman DE, Carandini M, Scanziani M. Somatosensory integration controlled by dynamic thalamocortical feed-forward inhibition. Neuron. 2005;48:315–327. doi: 10.1016/j.neuron.2005.09.022. [DOI] [PubMed] [Google Scholar]
- Gao E, DeAngelis GC, Burkhalter A. Parallel input channels to mouse primary visual cortex. J Neurosci. 2010;30:5912–5926. doi: 10.1523/JNEUROSCI.6456-09.2010. [DOI] [PMC free article] [PubMed] [Google Scholar]
- Gonchar Y, Burkhalter A. Differential subcellular localization of forward and feedback interareal inputs to parvalbumin expressing GABAergic neurons in rat visual cortex. J Comp Neurol. 1999;406:346–360. doi: 10.1002/(SICI)1096-9861(19990412)406:3<346::AID-CNE4>3.0.CO%3B2-E. [DOI] [PubMed] [Google Scholar]
- Gonchar Y, Burkhalter A. Distinct GABAergic targets of feedforward and feedback connections between lower and higher areas of rat visual cortex. J Neurosci. 2003;23:10904–10912. doi: 10.1523/JNEUROSCI.23-34-10904.2003. [DOI] [PMC free article] [PubMed] [Google Scholar]
- Gonchar Y, Wang Q, Burkhalter A. Multiple distinct subtypes of GABAergic neurons in mouse visual cortex identified by triple immunostaining. Front Neuroanat. 2007;1:3. doi: 10.3389/neuro.05.003.2007. [DOI] [PMC free article] [PubMed] [Google Scholar]
- Hippenmeyer S, Vrieseling E, Sigrist M, Portmann T, Laengle C, Ladle DR, Arber S. A developmental switch in the response of DRD neurons to ETS transcription factor signaling. PLoS Biol. 2005;3:e159. doi: 10.1371/journal.pbio.0030159. [DOI] [PMC free article] [PubMed] [Google Scholar]
- Hull C, Isaacson JS, Scanziani M. Postsynaptic mechanisms govern the differential excitation of cortical neurons by thalamic inputs. J Neurosci. 2009;29:9127–9136. doi: 10.1523/JNEUROSCI.5971-08.2009. [DOI] [PMC free article] [PubMed] [Google Scholar]
- Jiang X, Johnson RR, Burkhalter A. Visualization of dendritic morphology of cortical projection neurons by retrograde axonal tracing. J Neurosci Methods. 1993;50:45–60. doi: 10.1016/0165-0270(93)90055-V. [DOI] [PubMed] [Google Scholar]
- Johnson RR, Burkhalter A. Evidence for excitatory amino acid neurotransmitters in forward and feedback corticocortical pathways within rat visual cortex. Eur J Neurosci. 1994;6:272–286. doi: 10.1111/j.1460-9568.1994.tb00270.x. [DOI] [PubMed] [Google Scholar]
- Johnson RR, Burkhalter A. Microcircuitry of forward and feedback connections within rat visual cortex. J Comp Neurol. 1996;368:383–398. doi: 10.1002/(SICI)1096-9861(19960506)368:3<383::AID-CNE5>3.0.CO%3B2-1. [DOI] [PubMed] [Google Scholar]
- Johnson RR, Burkhalter A. A polysynaptic feedback circuit in rat visual cortex. J Neurosci. 1997;17:7129–7140. doi: 10.1523/JNEUROSCI.17-18-07129.1997. [DOI] [PMC free article] [PubMed] [Google Scholar]
- Katz LC, Burkhalter A, Dreyer WJ. Fluorescent latex microspheres as a retrograde marker for in vivo and in vitro studies of visual cortex. Nature. 1984;310:498–500. doi: 10.1038/310498a0. [DOI] [PubMed] [Google Scholar]
- Kremkow J, Perrinet LU, Masson GS, Aertsen A. Functional consequences of correlated excitatory and inhibitory conductances in cortical networks. J Comput Neurosci. 2010;28:579–594. doi: 10.1007/s10827-010-0240-9. [DOI] [PubMed] [Google Scholar]
- Larkum M. A cellular mechanisms for cortical associations: an organizing principle for the cerebral cortex. Trends Neurosci. 2013;36:141–151. doi: 10.1016/j.tins.2012.11.006. [DOI] [PubMed] [Google Scholar]
- Lee J, Maunsell JH. The effect of attention on neuronal responses to high and low contrast stimuli. J Neurophysiol. 2010;104:960–971. doi: 10.1152/jn.01019.2009. [DOI] [PMC free article] [PubMed] [Google Scholar]
- Madisen L, Zwingman TA, Sunkin SM, Oh SW, Zariwala HA, Gu H, Ng LL, Palmiter RD, Hawrylycz MJ, Jones AR, Lein ES, Zeng H. A robust high-throughput Cre reporting and characterization system for the whole muse brain. Nat Neurosci. 2010;13:133–140. doi: 10.1038/nn.2467. [DOI] [PMC free article] [PubMed] [Google Scholar]
- Marshel JH, Garrett ME, Nauhaus I, Callaway EM. Functional specialization of seven mouse visual cortical areas. Neuron. 2011;72:1040–1054. doi: 10.1016/j.neuron.2011.12.004. [DOI] [PMC free article] [PubMed] [Google Scholar]
- McAdams CJ, Maunsell JH. Effects if attention on the reliability of individual neurons in monkey visual cortex. Neuron. 1999;23:765–773. doi: 10.1016/S0896-6273(01)80034-9. [DOI] [PubMed] [Google Scholar]
- McCormick DA, Connors BW, Lighthall JW, Prince DA. Comparative electrophysiology of pyramidal and sparsely spiny stellate neurons of the neocortex. J Neurophysiol. 1985;54:782–806. doi: 10.1152/jn.1985.54.4.782. [DOI] [PubMed] [Google Scholar]
- McDonald CT, Burkhalter A. Organization of long-range inhibitory connections within rat visual cortex. J Neurosci. 1993;13:768–781. doi: 10.1523/JNEUROSCI.13-02-00768.1993. [DOI] [PMC free article] [PubMed] [Google Scholar]
- Montero VM. Retinotopy of cortical connections between the striate cortex and extrastriate visual areas in the rat. Exp Brain Res. 1993;94:1–15. doi: 10.1007/BF00230466. [DOI] [PubMed] [Google Scholar]
- Niell CM, Stryker MP. Highly selective receptive fields in mouse visual cortex. J Neurosci. 2008;28:7520–7536. doi: 10.1523/JNEUROSCI.0623-08.2008. [DOI] [PMC free article] [PubMed] [Google Scholar]
- Packer AM, Yuste R. Dense, unspecific connectivity of neocortical parvalbumin-positive interneurons: a canonical microcircuit for inhibition? J Neurosci. 2011;31:13260–13271. doi: 10.1523/JNEUROSCI.3131-11.2011. [DOI] [PMC free article] [PubMed] [Google Scholar]
- Petreanu L, Mao T, Sternson SM, Svoboda K. The subcellular organization of neocortical excitatory connections. Nature. 2009;457:1142–1145. doi: 10.1038/nature07709. [DOI] [PMC free article] [PubMed] [Google Scholar]
- Petrof I, Viaene AN, Sherman SM. Two populations of corticothalamic and interareal corticocortical cells in the subgranular layers of the mouse primary sensory cortices. J Comp Neurol. 2012;520:1678–1686. doi: 10.1002/cne.23006. [DOI] [PMC free article] [PubMed] [Google Scholar]
- Pouille F, Marin-Burgin A, Adesnik H, Atallah BV, Scanziani M. Input normalization by global feedforward inhibition expands cortical dynamic range. Nat Neurosci. 2009;12:1577–1585. doi: 10.1038/nn.2441. [DOI] [PubMed] [Google Scholar]
- Sanderson KJ, Dreher B, Gayer N. Prosencephalic connections of striate and extrastriate areas of rat visual cortex. Exp Brain Res. 1991;85:324–334. doi: 10.1007/BF00229410. [DOI] [PubMed] [Google Scholar]
- Shadlen MN, Newsome WT. The variable discharge of cortical neurons: implications for connectivity, computation, and information coding. J Neurosci. 1998;18:3870–3896. doi: 10.1523/JNEUROSCI.18-10-03870.1998. [DOI] [PMC free article] [PubMed] [Google Scholar]
- Shao Z, Burkhalter A. Differential balance of excitation and inhibition in forward and feedback circuits of rat visual cortex. J Neurosci. 1996;16:7353–7365. doi: 10.1523/JNEUROSCI.16-22-07353.1996. [DOI] [PMC free article] [PubMed] [Google Scholar]
- Sherman SM. Thalamocortical interactions. Curr Opin Neurobiol. 2012;22:575–579. doi: 10.1016/j.conb.2012.03.005. [DOI] [PMC free article] [PubMed] [Google Scholar]
- Sippy T, Yuste R. Decorrelating action of inhibition in neocortical networks. J Neurosci. 2013;33:9813–9830. doi: 10.1523/JNEUROSCI.4579-12.2013. [DOI] [PMC free article] [PubMed] [Google Scholar]
- Suter BA, O'Connor T, Iyer V, Petreanu LT, Hooks BM, Kiritani T, Svoboda K, Shepherd GM. Ephus: multipurpose data acquisition software for neuroscience experiments. Front Neural Circuits. 2010;4:100. doi: 10.3389/fncir.2010.00100. [DOI] [PMC free article] [PubMed] [Google Scholar]
- Ueta Y, Otsuka T, Morishima M, Ushimaru M, Kawaguchi Y. Multiple layer 5 pyramidal cell subtypes relay cortical feedback from secondary to primary motor areas in rats. Cereb Cortex. 2013 doi: 10.1093/cercor/bht088. doi: 10.1093/cercor/bht088. Advance online publication. Retrieved April 3, 2013. [DOI] [PubMed] [Google Scholar]
- Wagor E, Mangini NJ, Pearlman AL. Retinotopic organization of striate and extrastriate visual cortex in the mouse. J Comp Neurol. 1980;193:187–202. doi: 10.1002/cne.901930113. [DOI] [PubMed] [Google Scholar]
- Wang Q, Burkhalter A. Separate output streams from V1 to higher areas of mouse visual cortex. Soc Neurosci Abstr. 2005;31:854.1. [Google Scholar]
- Wang Q, Burkhalter A. Area map of mouse visual cortex. J Comp Neurol. 2007;502:339–357. doi: 10.1002/cne.21286. [DOI] [PubMed] [Google Scholar]
- Wang Q, Gao E, Burkhalter A. Gateways of ventral and dorsal streams in mouse visual cortex. J Neurosci. 2011;31:1905–1918. doi: 10.1523/JNEUROSCI.3488-10.2011. [DOI] [PMC free article] [PubMed] [Google Scholar]
- Wang Q, Sporns O, Burkhalter A. Network analysis of corticocortical connections reveals ventral and dorsal processing stream in mouse visual cortex. J Neurosci. 2012;32:4386–4399. doi: 10.1523/JNEUROSCI.6063-11.2012. [DOI] [PMC free article] [PubMed] [Google Scholar]
- Williams SR, Mitchell SJ. Direct measurements of somatic voltage clamp errors in central neurons. Nat Neurosci. 2008;11:790–798. doi: 10.1038/nn.2137. [DOI] [PubMed] [Google Scholar]
- Yamashita A, Valkova K, Gonchar Y, Burkhalter A. Rearrangement of synaptic connections with inhibitory neurons in developing mouse. J Comp Neurol. 2003;464:426–437. doi: 10.1002/cne.10810. [DOI] [PubMed] [Google Scholar]
- Yoshimura Y, Callaway EM. Fine-scale specificity of cortical networks depends on inhibitory cell type and connectivity. Nat Neurosci. 2005;8:1552–1559. doi: 10.1038/nn1565. [DOI] [PubMed] [Google Scholar]