

Abstract
Astrocytes in hippocampal slices can dynamically regulate synaptic transmission in a process mediated by increases in intracellular Ca2+. However, it is debated whether astrocytic Ca2+ signals result in release of glutamate. We here compared astrocytic Ca2+ signaling triggered by agonist exposure versus photolysis side by side. Using transgenic mice in which astrocytes selectively express the MrgA1 receptor, we found that receptor-mediated astrocytic Ca2+ signaling consistently triggered neuronal hyperpolarization and decreased the frequency of miniature excitatory postsynaptic currents (EPSCs). In contrast, photolysis of caged Ca2+ (o-nitrophenyl–EGTA) in astrocytes led to neuronal depolarization and increased the frequency of mEPSCs through a metabotropic glutamate receptor-mediated pathway. Analysis of transgenic mice in which astrocytic vesicular release is suppressed (dominant-negative SNARE mice) and pharmacological manipulations suggested that glutamate is primarily released by opening of anion channels rather than exocytosis. Combined, these studies show that photolysis but not by agonists induced astrocytic Ca2+ signaling triggers glutamate release.
Introduction
It has been nearly two decades since the supportive cells of the brain, astrocytes, were first shown to play an active role in neurotransmission. The initial evidence for an active role of astrocytes in synaptic regulation were collected in cocultures and showed that astrocytes have the ability to transmit Ca2+ signals to neurons (Nedergaard, 1994; Parpura et al., 1994). Additional analysis of semi-intact tissue supported and extended the original findings by demonstrating that astrocytes can modulate synaptic activity (Araque et al., 1998; Kang et al., 1998). It is by now well established that astrocytes display increases in cytosolic Ca2+ in response to synaptic transmission and in turn modulate neural activity in hippocampal slices prepared from young rodents (Rusakov et al., 2011). The majority of studies so far have concluded that the release of gliotransmitters, and in particular glutamate, constitutes the primary mechanism by which astrocytes regulate the activity of excitatory and inhibitory synapses in hippocampal slices (Kang et al., 1998; Halassa et al., 2009). Glutamate released by astrocytes triggers coordinated Ca2+ responses in CA1 neurons (Fellin et al., 2004; Sun et al., 2013), increases the frequency of EPSPs (Fiacco and McCarthy, 2004), and decreases synaptic failure in response to minimal stimulation of Schaeffer collaterals (Navarrete and Araque, 2010). However, in recent years, controversies have emerged because studies based on astrocytic-specific gene manipulations have questioned whether gliotransmitters are released in response to agonist-induced Ca2+ signaling. Using a transgenic approach, McCarthy and colleagues showed that Ca2+ signaling triggered by activation of receptors exclusively expressed by astrocytes did not affect short- or long-term synaptic plasticity (Agulhon et al., 2008, 2010; Fiacco et al., 2009). Experimental evidence for gliotransmitter release was primarily based on studies using photolysis of caged Ca2+ or IP3, and these studies additionally showed that astrocytic glutamate release can modulate excitatory or inhibitory transmission by activation of mGluR or kainate receptors (Fellin et al., 2004; Fiacco and McCarthy, 2004; Liu et al., 2004; Navarrete and Araque, 2010). However, one concern is that photolysis of caged Ca2+ or IP3 directly increases intracellular free Ca2+, bypassing the Gq-coupled intracellular signaling pathways normally activated by agonist exposure (Takano et al., 2006).
To our knowledge, no previous studies have directly compared the effect of Ca2+ signaling evoked by agonist-induced receptor activation versus photolysis of caged Ca2+. We here evaluated the two stimulation paradigms side by side and took advantage of transgenic approaches to selectively induce astrocytic Ca2+ increases or inhibit gliotransmitter release. The analysis confirmed that photolysis of caged Ca2+ triggers release of glutamate, which transiently enhances excitatory transmission. In contrast, agonist-induced Ca2+ signaling did not evoke detectable glutamate release but was instead linked to a reduction of extracellular K+ and suppression of mEPSCs. Thus, these observations question the physiological relevance of Ca2+ signaling evoked by photolysis of caged compounds.
Materials and Methods
Slice preparation and electrophysiology.
Unless otherwise noted, hippocampal slices were prepared from 18- to 21-d-old C57BL/6 (Charles River Laboratories) or the transgenic colonies including MrgA1 (Agulhon et al., 2010), glutamate transporter 1–EGFP (Regan et al., 2007), or dominant-negative SNARE (dnSNARE) (Pascual et al., 2005) mice of either sex. All the transgenic mice were on C57BL/6 background and breed according to the original reports. To prevent expression of dnSNARE during embryogenesis or later development, dnSNARE mice were bred in the presence of doxycycline (Dox; Sigma-Aldrich) in drinking water (100 μg/ml). The expression of the EGFP reporter in dnSNARE pups (absent when Dox was added and present when Dox was removed from the drinking water) was evaluated before recordings. All animal procedures followed National Institute of Health guidelines and were approved by the Institution of Animal Care and Use Committee of University of Rochester.
The pups were anesthetized in a closed chamber with isoflurane (3%) and decapitated. The brains were rapidly removed and immersed in ice-cold cutting solution that contained the following (in mm): 230 sucrose, 2.5 KCl, 0.5 CaCl2, 10 MgCl2, 26 NaHCO3, 1.25 NaH2PO4, and 10 glucose, pH 7.2–7.4. Hippocampal slices (400 μm) were cut using a vibratome (Vibratome) and transferred to oxygenated artificial CSF (aCSF) that contained the following (in mm): 126 NaCl, 4 KCl, 2 CaCl2, 1 MgCl2, 26 NaHCO3, 1.25 NaH2PO4, and 10 glucose, pH 7.2–7.4 (osmolarity, 310 mOsm). Slices were incubated in aCSF for 1–5 h at room temperature before recording. Experiments were performed at room temperature (21–23°C). During the recordings, the slices were placed in a perfusion chamber and superfused with aCSF gassed with 5% CO2 and 95% O2 at room temperature. Cells were visualized with a 40× water-immersion objective and differential inference contrast optics (BX51WI; Olympus). Patch electrodes were fabricated from filament thin-walled glass (TW150F-4; WPI) on a vertical puller (Micro Forge MF830; Narishige), and resistance of the pipette is ∼6–9 mΩ with the intracellular pipette solution added. The pipette solution contained the following (in mm): 140 K-gluconate, 5 Na-phosphocreatine, 2 MgCl2, 10 HEPES, 4 Mg-ATP, and 0.3 Na-GTP, pH adjusted to 7.2 with KOH. With these solutions, the mEPSCs reversed at ∼0 mV. Voltage clamp was used to record mEPSCs, which were isolated by adding 0.5 μm TTX and 10 μm bicuculline to the bath solution and maintained a holding potential of −70 mV. The junction potential between the patch pipette and bath solution was zeroed before forming a gigaseal. Patches with seal resistances of <1 GΩ were rejected. Data were low-pass filtered at 2 kHz and digitized at 10 kHz with a Digidata 1440 interface controlled by pClamp Software (Molecular Devices). Membrane potentials were recorded under current clamp (I = 0) using an Axopatch MultiClamp 700B amplifier (Molecular Devices). Comparisons were done using the “averaged frequency and amplitude” in the “Event Statistics” option of Clampfit. One averaged frequency/amplitude was treated as one experiment in the statistical analysis. Thirty-second recordings were analyzed 1 min before and after application of the drugs in one slice, and the averaged frequency and amplitude were calculated.
Ca2+ imaging and photolysis of o-nitrophenyl--EGTA.
After recovering for 30 min at room temperature, slices were incubated at 30–32°C for 60 min in aCSF containing rhod-2 AM (5 μm) and 0.02–0.04% pluronic F-127, in either the presence or absence of o-nitrophenyl–EGTA (NP-EGTA) AM (10 μm). For dual-patch experiments, rhod-2 tetrapotassium (100 μm) and NP-EGTA (100 μm) were added to the pipette solution. A custom-built microscope attached to titanium:sapphire laser (Tsunami/Millennium; SpectraPhysics) and scanning box (FV300; Olympus) using FluoView software (Olympus) and 40× objective (0.8 numerical aperture; Olympus) was used in all experiments (Rusakov et al., 2011). The excitation wavelength was fixed at 820 nm, whereas two-channel detection of emission was achieved by a 565 nm dichroic mirror (Chroma Technology) and two external photomultiplier tubes. A 525/50 bandpass filter (Chroma Technology) was used to detect GFP emission wavelength, and a 620/60 bandpass filter (Chroma Technology) was used to detect rhod-2 signals. Relative changes in rhod-2 signaling were quantified using FluoView software. Time-lapse images of astrocytic Ca2+ signaling were recorded every second. The amplitude (percentage increase of fluorescence from baseline) was obtained by selecting highest intensities in the time-lapse images. Duration was measured as the time of each cell in the field from 10% of the rise of intensity until the intensity returns to 10% the baseline. Velocity was obtained from the distance of each cell in the field to the location of pipette tip or laser pulses and the time of fluorescence increase. For each slice, we measured four to nine cells in the field with various distance from the stimulation site and obtained an average number to represent the response of the slice. An ultraviolet (UV) laser of 355 nm (diode-pumped solid-state laser) was focused through the 40× water-immersion objective to an optical spot of 4 μm diameter. A mechanical shutter (Uniblitz model D122) was used to control the duration of the UV photoflash. A red spot from a weak 635 nm diode laser, which is visible under infrared differential interference contrast microscopy and under laser-scanning fluorescence microscopy when enabled, was coupled with the UV laser beam to guide the positioning of the photolysis in the field. To trigger Ca2+ elevation in astrocytes, two UV-laser pulses (30 μs length, 10 μs interval, 30 mW, 4 μm beam diameter) were delivered to the targeted astrocyte in stratum radiatum. A direct comparison of Ca2+ waves induced by photolysis of caged Ca2+ loaded by addition to the bath (NP-EGTA AM) or by addition to the patch pipette solution (NP-EGTA) showed that the two loading procedures triggered comparable astrocytic Ca2+ increases.
Fabrication and calibration of K+-sensitive microelectrodes.
To detect K+ changes in the extracellular space, ion-sensitive microelectrodes were fabricated from double-barreled pipette glass (PB150F-6; WPI) pulled to a tip of <3 μm with a vertical puller (Micro Forge MF830; Narishige). The pipette was silanized by dimethylsilane (Fluka, Sigma) loaded with a 100–150 μm column of valinomycin-based K+ ion-exchanger resin (potassium ionophore 1-cocktail B; Fluka, Sigma), and backfilled with 150 mm KCl. The reference barrel was filled with HEPES-buffered 150 mm NaCl solution, pH 7.4. The pipette was connected to head stages of an Axoprobe 700B amplifier (Molecular Devices). Electrodes were calibrated in 1–6 mm K+ in aCSF before and after experiments. The recording pipette was located ∼100 μm below the surface of the slice. The electrodes used in experiments typically displayed voltage responses of 5–6 mV per millimolar increase in K+ concentrations in the concentration range studied. In selected experiments, single-barrel pipettes were used in combination with a reference electrode located ∼10 μm away.
Statistics.
All results are reported as mean ± SEM, and significance was determined by t test or one-way ANOVA with Bonferroni's post hoc multiple comparison test. For repeated measures, the paired t test was used.
Results
Agonist-induced astrocytic Ca2+ signaling triggers a transient suppression of mEPSCs
To selectively stimulate astrocytes, we first prepared hippocampal slices from 18- to 21-d-old MrgA1+ mice (C57BL/6). In these mice, the Gq-linked MrgA1 receptor is expressed under control of the GFAP promoter (Agulhon et al., 2010). The slices were loaded with the Ca2+ indicator rhod-2 AM (5 μm, 30 min), and the MrgA1 receptor agonist Phe-Met-Arg-Phe-NH2 amide (FMRF) (15 μm) was delivered within the field of view by a micropipette. FMRF evoked a wave of Ca2+ increase that included essentially all astrocytes within a radius of ∼150 μm from the pipette (Fig. 1A,B). The average increase in Ca2+ evoked by FMRF was 79.9 ± 2.8% (n = 9), the average duration of Ca2+ increases was 72.9 ± 2.5 s (n = 9), and the Ca2+ increases spread in a wave-like pattern from the tip of the injection pipette with an average velocity of 15.8 ± 2.3 μm/s (n = 5; Fig. 1C). Microinjection of aCSF (vehicle) in slices prepared from MrgA1+ pups or FMRF in slices prepared from wild-type pups not expressing MrgA1 receptors did not evoke significant Ca2+ increases (n = 5–6, p = 0.22 for aCSF on MrgA1+; p = 0.62 for FMRF on wild type, paired t test; Fig. 1C). In addition, these manipulations did not significantly change the frequency or amplitude of mEPSCs in neighboring neurons (Wang et al., 2012b). Endogenous agonists that primarily, but not selectively, activate astrocytic Gq-linked receptors, including ATP (30 μm) and the proteolytic-activated receptor 1 (PAR1) agonist Thr-Phe-Leu-Leu-Arg-NH2 amide (TFLLR) (30 μm), also induced Ca2+ increases in astrocytes (Fig. 1C).
Figure 1.

Agonist-induced astrocytic Ca2+ signaling decreases mEPSCs. A, Time series of intracellular Ca2+ increase (arrows) induced by a microinjection of FMRF (15 μm) by a glass pipette (white dotted line), in a hippocampal slice loaded with rhod-2 AM (5 μm, 30 min). Scale bar, 50 μm. The pseudocolor scale displays relative changes in rhod-2 emission. B, Traces of relative changes in rhod-2 emission as a function of time after agonist exposure. The color coding of the traces matches the colored arrows in A. C, Comparison of agonist (15 μm FMRF, 30 μm ATP, or 10 μm TFLLR)-induced Ca2+ increase (p > 0.5, one-way ANOVA), duration (p = 0.13, one-way ANOVA), and velocity (p = 0.382, one-way ANOVA, n = 4–9 slices). D, A representative recording of a CA1 hippocampal neuron shows that FMRF (15 μm) decreased the frequency of mEPSCs. Expanded timescale traces before and after FMRF delivery (blue shaded) are displayed below. Bottom trace depicts changes in neuronal membrane potential in response to FMRF-induced astrocytic Ca2+ signaling recorded in current clamp. VC, Voltage clamp. E, Cumulative probabilities of amplitude and interevent interval from D. F, Summary histogram of the effects of FMRF, ATP, or TFLLR on the amplitude and frequency of mEPSCs (*p < 0.05, paired t test before and after agonist application for each group). Right panel shows the effects of FMRF, ATP, and TFLLR on membrane potentials of neighboring neurons.
In accordance with previous reports (Agulhon et al., 2008, 2010), FMRF-induced astrocytic Ca2+ signaling did not significantly change the frequency or amplitude of mEPSC in neighboring neurons when we voltage clamped neurons close to the surface of the slice (Wang et al., 2012b). However, if recordings were obtained from neurons positioned deeper in the slice (70–100 μm), FMRF transiently suppressed excitatory transmission (Fig. 1D), as evident in the cumulative distribution of EPSC amplitude and frequency (Fig. 1E), which were plotted from 30 s recordings before and after application of FMRF. The frequency of mEPSCs fell to 59.7 ± 4.9% of baseline, whereas the amplitude of mEPSCs remained unchanged (p = 0.14, n = 5, paired t test; Fig. 1F). The input resistance did not change either (p = 0.80, n = 5, paired t test). We reported previously that Ca2+ signaling in astrocytes is linked to increased activity of the Na+/K+-ATPase, resulting in a reduction of extracellular K+ (Wang et al., 2012a,b). We here found that agonist-induced astrocytic Ca2+ signaling consistently hyperpolarized the nearby CA1 pyramidal neurons (Fig. 1F), likely contributing to the transient suppression of the frequency of mEPSCs. Endogenous agonists, including ATP and the PAR1 receptor agonist TFLLR, similarly decreased the frequency of mEPSCs in neighboring neurons (Fig. 1F). These endogenous agonists primarily, but not exclusively, increase Ca2+ in target astrocytes.
Photolysis of caged Ca2+ triggers glutamate release and enhances the frequency of mEPSCs
Numerous studies have shown that photolysis of caged IP3 or caged Ca2+ enhanced spontaneous excitatory activity, detected as an increase in the frequency of mEPSCs (Kang et al., 1998; Fiacco and McCarthy, 2004; Liu et al., 2004). To directly compare the effect of astrocytic Ca2+ signaling evoked by photolysis of caged compounds to that evoked by agonist exposure, we loaded hippocampal slices with rhod-2 AM and caged Ca2+ (NP-EGTA AM, 10 μm). Photolysis induced an initial increase in Ca2+ in the astrocytes targeted by an ultraviolet (UV) beam, which subsequently spread as a wave, engaging neighboring astrocytes (Fig. 2A,B). The amplitude of increases in rhod-2 fluorescence evoked by photolysis of NP-EGTA was directly comparable with those induced by FMRF (Figs. 1C, 2B,C). The duration of FMRF-induced Ca2+ increases in MrgA1+ mice did not differ significantly from photolysis-induced Ca2+ signaling (compare Figs. 1C, 2C). The average increase in Ca2+ was 75.1 ± 2.7% (n = 7), the average duration of Ca2+ increases was 75.9 ± 2.3 s (n = 7; Fig. 2C), and the Ca2+ increases spread in a wave-like pattern from the tip of the injection pipette with an average velocity of 7.6 ± 1.6 μm/s (n = 7; Fig. 2C). The metabotropic glutamate receptor antagonists 2-methyl-6-(phenylethynyl) pyridine (MPEP; 20 μm) and 1-aminoindan-1,5-dicarboxylic acid (AIDA; 50 μm) did not significantly affect astrocytic Ca2+ signaling (n = 5–7, p > 0.1, t test; Fig. 2C). Interestingly, photolysis of caged Ca2+ increased frequency of mEPSCs (Fig. 2D), as evident in the cumulative distribution of EPSCs (Fig. 2E). The frequency of mEPSCs were increased by 106.6 ± 15.1% (n = 6, p < 0.001, paired t test), whereas the amplitude did not exhibit significant changes (n = 6, p = 0.11, paired t test; Fig. 2F). Current-clamp recording revealed that neurons located near the astrocyte exposed to photolysis displayed a minor depolarization (Fig. 2F). MPEP and AIDA had little effects on neuronal depolarization (n = 4–5, p > 0.05, Bonferroni's test; Fig. 2F). Instead, an NMDA receptor antagonist (APV; 50 μm) and an AMPA receptor antagonist (CNQX; 20 μm) significantly suppressed photolysis-induced neuronal depolarization (n = 5, p < 0.05, Bonferroni's test). Combined, these observations indicate that glutamate released in response to photolysis of caged Ca2+ in astrocytes increases the frequency of mEPSCs by activation of mGluRs. Thus, NMDA/AMPA receptor-mediated neuronal depolarization may result from a combination of astrocytic glutamate release, increases in extracellular K+, and potentiation of excitatory activity.
Figure 2.

Astrocytic Ca2+ signaling evoked by photolysis enhances mEPSCs. A, Time series of intracellular Ca2+ increase (arrows) induced by UV photolysis (2 pulses, 30 μs length, 10 μs interval, 30 mW, beam diameter of 4 μm, the position is indicated in the 2nd frame), in a hippocampal slice loaded with NP-EGTA AM (10 μm) and rhod-2 AM (5 μm). Scale bar, 50 μm. The pseudocolor scale displays relative changes in rhod-2 emission. B, Traces of fluorescence changes in rhod-2 emission as a function of time after photolysis of NP-EGTA. The color coding of the traces matches the colored arrows in A. C, Comparison of Ca2+ amplitude and duration of astrocytic Ca2+ increases induced by photolysis in the presence and absence of the mGluR antagonists MPEP (10 μm) and AIDA (10 μm; p > 0.05, t tests, n = 5–7). D, A representative recording of a CA1 pyramidal neuron shows that photolysis of NP-EGTA in a nearby astrocyte increased the frequency of mEPSCs of a neighboring neuron. Expanded timescale traces before and after photolysis (red shaded) are displayed below. Bottom trace depicts changes in neuronal membrane potential in response to astrocytic Ca2+ signaling evoked by photolysis of NP-EGTA. E, Cumulative probability of amplitude and interevent intervals from recordings in D. F, Histograms comparing the effect of photolysis of NP-EGTA in astrocytes on the amplitude and frequency of mEPSCs in the absence and presence of the mGluR blocker MPEP and AIDA (*p < 0.05, paired t test before and after photolysis for each group; #p < 0.05, t test; n = 5–10). Right panel shows the effect of photolysis of NP-EGTA on the membrane potential of a nearby neurons (<50 μm) in the absence and presence of the mGluR blockers MPEP and AIDA or in the absence and presence of the NMDA receptor antagonists AP-5 (50 μm) and CNQX (20 μm; *p < 0.05, paired t test; #p < 0.05, one-way ANOVA with Bonferroni's test comparing different bath conditions; n = 4–5).
Photolysis of caged Ca2+ triggers efflux of cytosolic glutamate via anion channels
Astrocytic Ca2+ signaling has been linked previously to glutamate release via volume-sensitive and Ca2+-activated anion channels (Takano et al., 2005; Park et al., 2009; Woo et al., 2012) or by exocytosis of glutamate-containing vesicles (Pascual et al., 2005; Tian et al., 2005). Glutamate is a small anion (molecular weight, 146 Da) that, similar to other small intracellular compounds, can pass through a variety of membrane channels (Nedergaard et al., 2002). To test whether cytosolic glutamate is released from astrocytes in response to photolysis of caged Ca2+, we next enzymatically depleted the intracellular pool of glutamate by adding glutamate–pyruvate transaminase (GPT; 100 U/L) and sodium pyruvate (1 mm) to the pipette solution used to patch astrocytes. GPT catalyzed the transamination of glutamate and pyruvate to ketoglutarate and alanine (l-alanine + ketoglutarate → (GPT) → pyruvate + l-glutamate; Fig. 3A; Matthews et al., 2003). Caged Ca2+ NP-EGTA (potassium salt, 2 mm) was also added to the pipette solution together with rhod-2 potassium (100 μm). We allowed the pipette solution to fully exchange with the astrocyte cytosol (detected by intracellular diffusion of rhod-2). Dual patch recordings were used to assess responses in neighboring neurons. Ca2+ increases in astrocytes were not inhibited by GPT and/or pyruvate in the pipette solution (n = 5–6, p = 0.22, ANOVA; Fig. 3B). We found that photolysis had no effect on the mEPSCs when GPT and pyruvate were added to the astrocytic pipette solution (Fig. 3A,C). As a control, pyruvate was removed from the pipette solution to prevent GPT from deaminating glutamate to ketoglutarate (Fig. 3A). We found that GPT failed to inhibit the photolysis-induced potentiation of mEPSCs when pyruvate was omitted (Fig. 3C). We also assessed whether anion channels are involved in photolysis-induced astrocytic glutamate release by bath application of the anion channel inhibitor 5-nitro-2-(phenylpropylamino)-benzoate (NPPB). Interestingly, NPPB (50 μm) reduced photolysis-induced potentiation of mEPSC from 191.2 ± 17.4 to 117.4 ± 15.0% (n = 5, p < 0.05, Bonferroni's test; Fig. 3C). NPPB also attenuated photolysis-induced neuronal depolarization from 1.58 ± 0.11 to 0.43 ± 0.12 mV (n = 4–5, p < 0.05, Bonferroni's test; Fig. 3C). Moreover, another anion channel inhibitor, 4,4′-diisothiocyano-2,2′-stilbenedisulfonic acid (DIDS; 5 μm) also blocked the photolysis-induced potentiating mEPSCs (n = 5, p < 0.05, Bonferroni's test; Fig. 3C). Combined, this analysis shows that cytosolic glutamate is released via opening of anion channels in response to photolysis of caged Ca2+.
Figure 3.

Photolysis of caged Ca2+ triggers efflux of cytosolic glutamate via anion channels. A, Schematic drawing depicts that depletion of intracellular glutamate by addition of GPT and pyruvate to the pipette solution eliminates cytosolic glutamate (right). Representative traces of mEPSCs in a CA1 pyramidal neuron recorded during photolysis of NP-EGTA in a nearby astrocyte in which GPT and pyruvate was added to the patch pipette solution (left). B, Schematic drawing showing that addition of GPT, but not pyruvate (Pyru), to the pipette solution does not eliminates cytosolic glutamate (right). Representative traces of mEPSCs in a CA1 pyramidal neuron recorded during photolysis of NP-EGTA in a nearby astrocyte after addition of GPT, but not pyruvate, to the pipette solution (left). C, Histograms comparing the effects of addition of vehicle, GPT (100 U/L) and sodium pyruvate (1 mm), GPT alone, NPPB (50 μm), and DIDS (5 μm) to the pipette patching astrocytes on the amplitude of mEPSCs (p > 0.05, paired t test and one-way ANOVA; n = 5), frequency of mEPSCs (*p < 0.05, paired t test before and after photolysis for each group; #p < 0.01, one-way ANOVA with Bonferroni's test, comparing different pipette conditions; n = 5), and membrane potential changes (*p < 0.05, paired t test before and after photolysis for each group; #p < 0.05, one-way ANOVA with Bonferroni's test comparing different pipette conditions; n = 4–5) in CA1 neurons induced by a photolysis in neighboring astrocytes. D, Representative traces of recordings of mEPSCs in a pyramidal CA1 neuron in response to photolysis of NP-EGTA in a nearby astrocyte in a slice prepared from dnSNARE mice (−Dox indicates not receiving Dox). E, Histogram comparing the effects of photolysis of NP-EGTA in astrocytes on the amplitude (*p < 0.05, paired t test before and after photolysis for each group; #p < 0.05, t test comparing dnSNARE mice with or without Dox water; n = 5–6), frequency (*p < 0.05, paired t test before and after photolysis for each group; n = 5–6) of mEPSCs, and membrane potentials of neighboring neurons (*p < 0.05, paired t test before and after photolysis for each group; n = 5–6) in nearby neurons in slices prepared from +Dox (with Dox) and −Dox (without Dox).
Next, to establish the role of vesicular release in astrocytic glutamate release, the experiments were repeated in slices prepared from dnSNARE mice (Pascual et al., 2005). In dnSNARE transgenic mice, vesicular release is blocked by expression of a dnSNARE domain in GFAP-expressing astrocytes. However, inhibition of vesicular release in astrocytes did not suppress photolysis-induced glutamate release. Slices prepared from dnSNARE mice not receiving Dox, and thereby not expressing the dnSNARE domain, exhibited an increase in the frequency of mEPSCs and a membrane depolarization that were directly comparable with slices prepared from dnSNARE mice treated with Dox (Fig. 3D,E).
It was a surprise that photolysis of caged Ca2+ triggered depolarization of nearby neurons, because agonist exposure consistently was linked to neuronal hyperpolarization (compare Figs. 1F, 2F, 3E). Previous studies have shown that agonist-induced hyperpolarization is a result of astrocytic Ca2+-dependent K+ uptake that transiently decreases extracellular K+ (Wang et al., 2012b). We critically assessed this observation by combining measurements of astrocytic membrane potential with recordings of extracellular K+ using ion-sensitive microelectrodes (Fig. 4A). All agonists analyzed, including FMRF, ATP, and TFLLR, reduced extracellular K+ and hyperpolarized astrocytes (Fig. 4B,C). We next asked whether extracellular K+ increases when astrocytes are activated by photolysis based on the observation that neurons depolarize in response to photolysis (Fig. 3E). Unfortunately, the K+ ionophore valinomycin used for fabrication of K+ microelectrodes was highly sensitive to UV light and lost its K+ selectivity following photolysis. Instead, we recorded astrocytic membrane potential, which closely follows the extracellular K+ concentration (Rusakov et al., 2011; Wang et al., 2012b). We first correlated astrocytic membrane potential with the extracellular K+ concentration, by successively changing bath K+ concentration (Fig. 4D). This analysis showed that astrocytic membrane potentials were a linear function of extracellular K+ (n = 65, y = 3.9x, R2 = 0.955; Fig. 4E), as expected for a cell type whose membrane permeability is almost entirely determined by K+ channels (Rusakov et al., 2011; Wang et al., 2012b). We next recorded the membrane potential of an astrocyte neighboring the astrocyte targeted by the UV beam (∼50 μm). Photolysis of NP-EGTA induced a transient increase in astrocytic membrane potential averaging 1.87 ± 0.17 mV (n = 7; Fig. 4F,G). Based on the correlation between extracellular K+ and astrocytic membrane potential (Fig. 4E), we calculated that photolysis of NP-EGTA is linked to an increase in extracellular K+, averaging 0.48 ± 0.04 mm (n = 7; Fig. 4G). What triggers the increase in extracellular K+? We speculated that photolysis-induced astrocytic glutamate release triggers neuronal depolarization by activation of NMDA/AMPA receptors. Addition of APV (50 μm) and CNQX (20 μm) or the anion channel blocker NPPB significantly reduced photolysis-induced increases in membrane potential and thereby the calculated increase in extracellular K+, consistent with the notion that photolysis glutamate release (n = 5, p < 0.05, Bonferroni's test; Fig. 4F,G). We also analyzed the effect of photolysis of caged Ca2+ in slices prepared from dnSNARE transgenic mice. Suppressing astrocytic exocytosis had little effect on photolysis-induced depolarization. The membrane potentials of nearby astrocytes increased by 1.6 ± 0.3 and 1.7 ± 0.2 mV, corresponding to an increase in the calculated extracellular K+ by 0.41 ± 0.06 and 0.42 ± 0.05 mm, respectively, in slices prepared from dnSNARE mice with and without Dox in the drinking water (n = 5, p > 0.05, Bonferroni's test; Fig. 4G).
Figure 4.
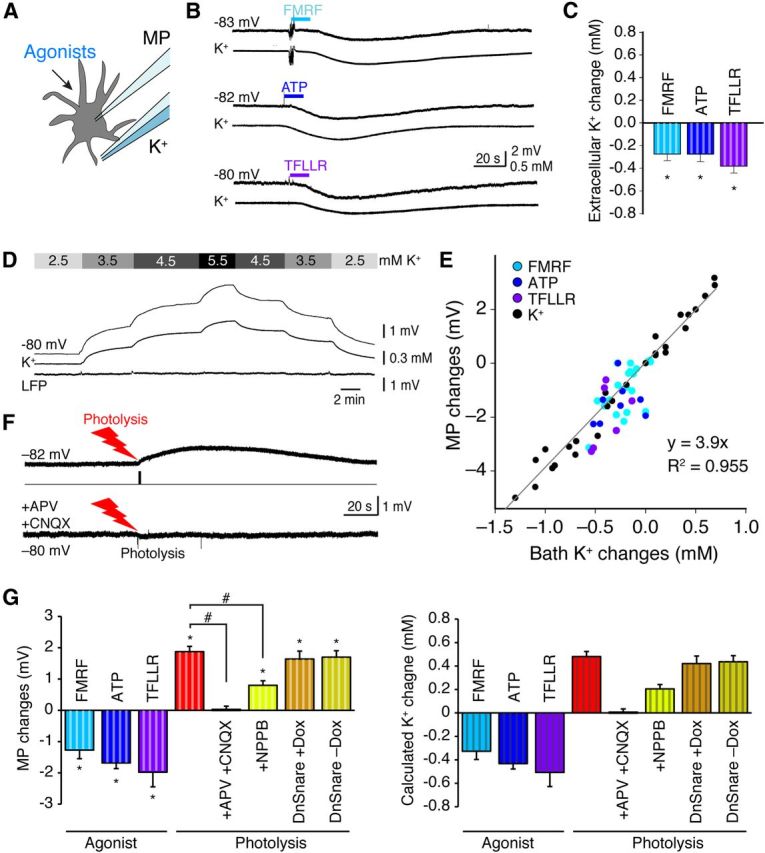
Effects of agonists versus photolysis on extracellular K+. A, A diagram showing that the effects of agonist exposure on astrocytic membrane potential (MP) and extracellular K+ were recorded simultaneously. B, Representative traces show hyperpolarization of astrocytes concomitant with a decrease in extracellular K+, after application of the agonists FMRF (15 μm), ATP (30 μm), or TFLLR (10 μm) in hippocampal slices. C, Histogram depicts reductions in extracellular K+ induced by an application of FMRF, ATP, or TFLLR (*p < 0.05, paired t test before and after agonist application for each group; n = 6–7). D, Combined recordings of astrocytic membrane potential and extracellular K+ (similar to A) in response to changes in bath K+. E, Scatter plots of changes in astrocytic membrane potential (MP, black dots) plotted as a function of extracellular K+ in response to changes in bath K+. Changes in MP and extracellular K+ in response to agonist exposure (FMRF, light blue; ATP, dark blue; and TFLLR, purple) are also plotted. (R2 = 0.955, n = 65). F, Representative traces showing the effect of photolysis of NP-EGTA on astrocytic membrane potential (top trace) and the effect of bath application of APV (50 μm) and CNQX (20 μm; bottom trace) in hippocampal slices. G, Histograms show the means ± SEM of membrane potential changes and calculated K+ changes based on data in E (*p < 0.05, paired t test before and after agonist or photolysis application for each group; #p < 0.01, one-way ANOVA, comparing agonists or comparing among different photolysis conditions; n = 5–7).
Combined, this analysis suggests that photolysis of caged Ca2+ triggers release of cytosolic glutamate by opening of anion channels rather than by vesicular release (Fig. 5). Moreover, pharmacological manipulations indicate that photolysis-induced astrocytic glutamate release activates both neuronal mGluRs and NMDA/AMPA receptors, resulting in a transient increase in extracellular K+, depolarization of both neurons and astrocytes, and an enhancement of excitatory activity (Fig. 5).
Figure 5.

Proposed models for agonists versus photolysis-induced astrocytic Ca2+-dependent modulation of excitatory transmission. A, Agonist-induced activation of astrocytic Gq-linked receptors triggers intracellular IP3 release and mobilization of Ca2+ from endoplasmic reticulum (ER). In turn, the Na+, Ca2+ exchanger (NCX) transports Ca2+ on the expense of Na+ influx. The increase in cytosolic Na+ activates the Na+, Na+/K+-ATPase, resulting in a decrease in extracellular K+, hyperpolarization of nearby neurons, and a transient decrease in frequency of mEPSC as shown previously (Wang et al., 2012b). B, Photolysis of caged Ca2+ triggers direct increases in Ca2+ as well as mobilization of intracellular Ca2+ stores (Li et al., 1998). In addition, glutamate-permeable anion channels are activated by either Ca2+ or changes in astrocytic volume, leading to glutamate release. Glutamate binds to postsynaptic mGluR5 and increases the frequency of mEPSCs. The increased excitatory activity leads to NMDA/AMPA receptor-mediated K+ efflux and neuronal depolarization. Glutamate released from astrocytes may also directly activate NMDA/AMPA receptors.
Discussion
The main purpose of this study was to compare how astrocytic Ca2+ signaling evoked by receptor activation versus photolysis of caged Ca2+ modulated spontaneous excitatory activity in nearby neurons. The analysis was prompted by controversies in the neuroglia signaling field, in which a large number of studies have shown that astrocytic Ca2+ signaling can trigger glutamate release, detected as slow NMDA receptor-mediated inward currents or as an mGluR5-dependent increase in mEPSC (Fellin et al., 2004; Fiacco and McCarthy, 2004). Most of these reports were based on photolysis of caged Ca2+ or IP3 (Fellin et al., 2004; Fiacco and McCarthy, 2004; Liu et al., 2004). Conversely, other studies stimulated astrocytes by agonists and found that Ca2+ signaling either has no effect on mEPSCs (Agulhon et al., 2008, 2010) or transiently suppresses mEPSCs (Wang et al., 2012b). Because most of the published data have been collected in hippocampal slices prepared from rodent pups, it is unlikely that regional differences of astrocytes can explain the discrepancies (Sun et al., 2013). We here directly compared the effect of the two stimulation paradigms (photolysis vs agonist exposure) on excitatory activity by continuous recordings of mEPSCs or membrane potential of CA1 hippocampal neurons. We show that astrocytic glutamate release is restricted to photolysis-evoked Ca2+ signaling and not induced by receptor activation. Receptor activation included an analysis of transgenic mice in which GFAP-expressing astrocytes selectively express the MrgA1 receptor, as well as two endogenous agonists (Fig. 1). Neither of these agonists induced glutamate release. Instead, agonist-induced Ca2+ signaling consistently reduced extracellular K+, resulting in a transient suppression of the frequency of mEPSCs when recordings were obtained from neurons located in a minimal depth of 70 μm from the surface of the slice.
The experiments using photolysis were designed to induce astrocytic Ca2+ increases that were comparable with agonist-induced Ca2+ signaling (compare Figs. 1A, 2A). Therefore, an open question is why caged Ca2 triggers glutamate release, whereas agonist exposure does not. To establish the mechanism of photolysis-induced glutamate release, we first enzymatically removed cytosolic glutamate in astrocytes. GPT, an enzyme that in the presence of pyruvate reversibly converts glutamate into α-ketoglutarate, was added to the pipette solution, in addition to pyruvate, NP-EGTA, and rhod-2. Subsequent photolysis showed that enzymatic depletion of cytosolic glutamate abrogated the photolysis-induced increases in mEPSCs. Moreover, the nonspecific anion channel inhibitors NPPB or DIDS blocked photolysis-induced glutamate release. Glutamate is a small anion present in the cytosol in low millimolar concentrations (Nedergaard and Verkhratsky, 2010), and a number of channels, including volume-sensitive channels, Ca2+-activated anion channels, P2X7 receptors, and connexin hemichannels, have been shown previously to be permeable to glutamate (Takano et al., 2005). Thus, our analysis suggests that photolysis of caged Ca2+ triggers the efflux of cytosolic glutamate through NPPB- and DIDS-sensitive anion channels. This conclusion was supported by the finding that glutamate release was not reduced in slices prepared from dnSNARE mice (Figs. 3D,E, 4G). In dnSNARE mice, vesicular release is inhibited by dominant-negative inhibition of the vesicular SNARE complex (Pascual et al., 2005). Yet, dnSNARE mice also displayed an enhancement of mEPSCs and depolarization in response to photolysis of caged Ca2+, indicating that Ca2+-dependent astrocytic glutamate is not dependent on vascular release (Figs. 3D,E, 4F,G). However, our analysis does not explain why glutamate-permeable anion channels are preferentially activated by photolysis of caged Ca2+. One possibility is that photolysis of caged Ca2+ bypasses intracellular signaling pathways that normally counteract the opening of Ca2+-activated Cl− channels (Woo et al., 2012). Another possibility is that photolysis induces astrocytic swelling that results in the opening of volume-sensitive anion channels and the release of osmolytes, including glutamate (Takano et al., 2005). Because the hippocampal slices were prepared from relatively old pups (18–21 d old), glutamate did not likely contribute to the spread of astrocytes Ca2+ waves. mGluR5 is developmentally regulated and not expressed in 3-week-old mice pups (Sun et al., 2013).
This analysis confirmed that photolysis of caged Ca2+ transiently enhanced excitatory transmission by triggering glutamate release (Nedergaard, 1994; Fiacco and McCarthy, 2004; Liu et al., 2004) and extended previous work by showing that astrocytic glutamate release may increase the frequency of mEPSCs by two connected mechanisms: (1) activation of neuronal mGluRs, which potentiated the activity of excitatory synapses (Naie and Manahan-Vaughan, 2004; Topolnik et al., 2006; Sun et al., 2013); and (2) local increases of extracellular K+ (Wang et al., 2012a,b). Conversely, agonist-induced astrocytic Ca2+ signaling consistently suppressed excitatory transmission by lowering extracellular K+ in slices prepared from rodent pups.
Footnotes
This work was supported by National Institutes of Health Grants NS075177 and MH099578.
The authors declare no competing financial interests.
References
- Agulhon C, Petravicz J, McMullen AB, Sweger EJ, Minton SK, Taves SR, Casper KB, Fiacco TA, McCarthy KD. What is the role of astrocyte calcium in neurophysiology? Neuron. 2008;59:932–946. doi: 10.1016/j.neuron.2008.09.004. [DOI] [PMC free article] [PubMed] [Google Scholar]
- Agulhon C, Fiacco TA, McCarthy KD. Hippocampal short- and long-term plasticity are not modulated by astrocyte Ca2+ signaling. Science. 2010;327:1250–1254. doi: 10.1126/science.1184821. [DOI] [PubMed] [Google Scholar]
- Araque A, Sanzgiri RP, Parpura V, Haydon PG. Calcium elevation in astrocytes causes an NMDA receptor-dependent increase in the frequency of miniature synaptic currents in cultured hippocampal neurons. J Neurosci. 1998;18:6822–6829. doi: 10.1523/JNEUROSCI.18-17-06822.1998. [DOI] [PMC free article] [PubMed] [Google Scholar]
- Fellin T, Pascual O, Gobbo S, Pozzan T, Haydon PG, Carmignoto G. Neuronal synchrony mediated by astrocytic glutamate through activation of extrasynaptic NMDA receptors. Neuron. 2004;43:729–743. doi: 10.1016/j.neuron.2004.08.011. [DOI] [PubMed] [Google Scholar]
- Fiacco TA, McCarthy KD. Intracellular astrocyte calcium waves in situ increase the frequency of spontaneous AMPA receptor currents in CA1 pyramidal neurons. J Neurosci. 2004;24:722–732. doi: 10.1523/JNEUROSCI.2859-03.2004. [DOI] [PMC free article] [PubMed] [Google Scholar]
- Fiacco TA, Agulhon C, McCarthy KD. Sorting out astrocyte physiology from pharmacology. Annu Rev Pharmacol Toxicol. 2009;49:151–174. doi: 10.1146/annurev.pharmtox.011008.145602. [DOI] [PubMed] [Google Scholar]
- Halassa MM, Fellin T, Haydon PG. Tripartite synapses: roles for astrocytic purines in the control of synaptic physiology and behavior. Neuropharmacology. 2009;57:343–346. doi: 10.1016/j.neuropharm.2009.06.031. [DOI] [PMC free article] [PubMed] [Google Scholar]
- Kang J, Jiang L, Goldman SA, Nedergaard M. Astrocyte-mediated potentiation of inhibitory synaptic transmission. Nat Neurosci. 1998;1:683–692. doi: 10.1038/3684. [DOI] [PubMed] [Google Scholar]
- Li W, Llopis J, Whitney M, Zlokarnik G, Tsien RY. Cell-permeant caged InsP3 ester shows that Ca2+ spike frequency can optimize gene expression. Nature. 1998;392:936–941. doi: 10.1038/31965. [DOI] [PubMed] [Google Scholar]
- Liu QS, Xu Q, Arcuino G, Kang J, Nedergaard M. Astrocyte-mediated activation of neuronal kainate receptors. Proc Natl Acad Sci U S A. 2004;101:3172–3177. doi: 10.1073/pnas.0306731101. [DOI] [PMC free article] [PubMed] [Google Scholar]
- Matthews CC, Zielke HR, Parks DA, Fishman PS. Glutamate-pyruvate transaminase protects against glutamate toxicity in hippocampal slices. Brain Res. 2003;978:59–64. doi: 10.1016/S0006-8993(03)02765-3. [DOI] [PubMed] [Google Scholar]
- Naie K, Manahan-Vaughan D. Regulation by metabotropic glutamate receptor 5 of LTP in the dentate gyrus of freely moving rats: relevance for learning and memory formation. Cereb Cortex. 2004;14:189–198. doi: 10.1093/cercor/bhg118. [DOI] [PubMed] [Google Scholar]
- Navarrete M, Araque A. Endocannabinoids potentiate synaptic transmission through stimulation of astrocytes. Neuron. 2010;68:113–126. doi: 10.1016/j.neuron.2010.08.043. [DOI] [PubMed] [Google Scholar]
- Nedergaard M. Direct signaling from astrocytes to neurons in cultures of mammalian brain cells. Science. 1994;263:1768–1771. doi: 10.1126/science.8134839. [DOI] [PubMed] [Google Scholar]
- Nedergaard M, Verkhratsky A. Calcium dyshomeostasis and pathological calcium signalling in neurological diseases. Cell Calcium. 2010;47:101–102. doi: 10.1016/j.ceca.2009.12.011. [DOI] [PMC free article] [PubMed] [Google Scholar]
- Nedergaard M, Takano T, Hansen AJ. Beyond the role of glutamate as a neurotransmitter. Nat Rev Neurosci. 2002;3:748–755. doi: 10.1038/nrn916. [DOI] [PubMed] [Google Scholar]
- Park H, Oh SJ, Han KS, Woo DH, Park H, Mannaioni G, Traynelis SF, Lee CJ. Bestrophin-1 encodes for the Ca2+-activated anion channel in hippocampal astrocytes. J Neurosci. 2009;29:13063–13073. doi: 10.1523/JNEUROSCI.3193-09.2009. [DOI] [PMC free article] [PubMed] [Google Scholar]
- Parpura V, Basarsky TA, Liu F, Jeftinija K, Jeftinija S, Haydon PG. Glutamate-mediated astrocyte-neuron signalling. Nature. 1994;369:744–747. doi: 10.1038/369744a0. [DOI] [PubMed] [Google Scholar]
- Pascual O, Casper KB, Kubera C, Zhang J, Revilla-Sanchez R, Sul JY, Takano H, Moss SJ, McCarthy K, Haydon PG. Astrocytic purinergic signaling coordinates synaptic networks. Science. 2005;310:113–116. doi: 10.1126/science.1116916. [DOI] [PubMed] [Google Scholar]
- Regan MR, Huang YH, Kim YS, Dykes-Hoberg MI, Jin L, Watkins AM, Bergles DE, Rothstein JD. Variations in promoter activity reveal a differential expression and physiology of glutamate transporters by glia in the developing and mature CNS. J Neurosci. 2007;27:6607–6619. doi: 10.1523/JNEUROSCI.0790-07.2007. [DOI] [PMC free article] [PubMed] [Google Scholar]
- Rusakov DA, Savtchenko LP, Zheng K, Henley JM. Shaping the synaptic signal: molecular mobility inside and outside the cleft. Trends Neurosci. 2011;34:359–369. doi: 10.1016/j.tins.2011.03.002. [DOI] [PMC free article] [PubMed] [Google Scholar]
- Sun W, McConnell E, Pare JF, Xu Q, Chen M, Peng W, Lovatt D, Han X, Smith Y, Nedergaard M. Glutamate-dependent neuroglial calcium signaling differs between young and adult brain. Science. 2013;339:197–200. doi: 10.1126/science.1226740. [DOI] [PMC free article] [PubMed] [Google Scholar]
- Takano T, Kang J, Jaiswal JK, Simon SM, Lin JH, Yu Y, Li Y, Yang J, Dienel G, Zielke HR, Nedergaard M. Receptor-mediated glutamate release from volume sensitive channels in astrocytes. Proc Natl Acad Sci U S A. 2005;102:16466–16471. doi: 10.1073/pnas.0506382102. [DOI] [PMC free article] [PubMed] [Google Scholar]
- Takano T, Tian GF, Peng W, Lou N, Libionka W, Han X, Nedergaard M. Astrocyte-mediated control of cerebral blood flow. Nat Neurosci. 2006;9:260–267. doi: 10.1038/nn1623. [DOI] [PubMed] [Google Scholar]
- Tian GF, Azmi H, Takano T, Xu Q, Peng W, Lin J, Oberheim N, Lou N, Wang X, Zielke HR, Kang J, Nedergaard M. An astrocytic basis of epilepsy. Nat Med. 2005;11:973–981. doi: 10.1038/nm1277. [DOI] [PMC free article] [PubMed] [Google Scholar]
- Topolnik L, Azzi M, Morin F, Kougioumoutzakis A, Lacaille JC. mGluR1/5 subtype-specific calcium signalling and induction of long-term potentiation in rat hippocampal oriens/alveus interneurones. J Physiol. 2006;575:115–131. doi: 10.1113/jphysiol.2006.112896. [DOI] [PMC free article] [PubMed] [Google Scholar]
- Wang F, Xu Q, Wang W, Takano T, Nedergaard M. Bergmann glia modulate cerebellar Purkinje cell bistability via Ca2+-dependent K+ uptake. Proc Natl Acad Sci U S A. 2012a;109:7911–7916. doi: 10.1073/pnas.1120380109. [DOI] [PMC free article] [PubMed] [Google Scholar]
- Wang F, Smith NA, Xu Q, Fujita T, Baba A, Matsuda T, Takano T, Bekar L, Nedergaard M. Astrocytes modulate neural network activity by Ca2+-dependent uptake of extracellular K+ Sci Signal. 2012b;5:ra26. doi: 10.1126/scisignal.2002334. [DOI] [PMC free article] [PubMed] [Google Scholar]
- Woo DH, Han KS, Shim JW, Yoon BE, Kim E, Bae JY, Oh SJ, Hwang EM, Marmorstein AD, Bae YC, Park JY, Lee CJ. TREK-1 and Best1 channels mediate fast and slow glutamate release in astrocytes upon GPCR activation. Cell. 2012;151:25–40. doi: 10.1016/j.cell.2012.09.005. [DOI] [PubMed] [Google Scholar]