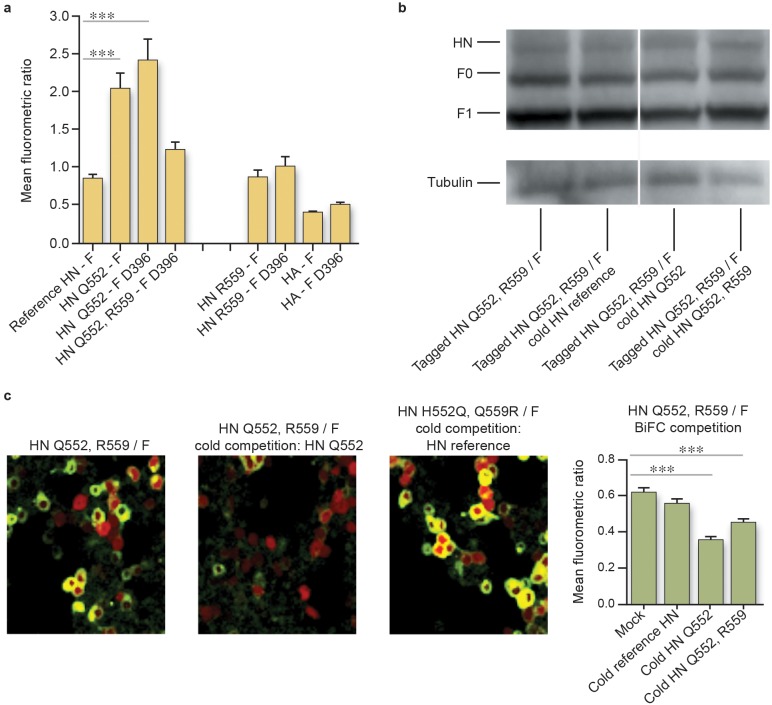
FIG 1 .
The strength of HN-F interaction for the lung-fit virus HPIV3-HNQ552/R559/FD396 is reduced relative to that of the parental virus (HPIV3-HNQ552/FG396) in 293T cells. (a) Cells were cotransfected with constructs encoding the indicated F fused to C-CFP and HN fused to N-Venus (or HA fused to N-Venus) and treated overnight with 10 mM zanamivir. One hour prior to confocal microscopy analysis, fresh 10 mM zanamivir and cycloheximide were added. Fluorescence (the mean fluorometric ratio) resulting from HN-F interaction was quantified. Values are means and standard errors of the means (SEM) from 4 to 7 separate experiments. ***, P < 0.001 (one-way analysis of variance). (b) In a competition assay, HNQ552/R559 N-Venus and F C-CFP were cotransfected with pCAGGS (mock), HNH552 pCAGGS (cold HNH552), HNQ552 (cold HNQ552), or HNQ552/R559 (cold HNQ552/R559) and treated overnight with 10 mM zanamivir. The expression levels of HN and F (in the uncleaved precursor form [F0] and the proteolytically cleaved form [F1]) are similar for each HN-F pair, as shown by Western blotting using tubulin (55 kDa) as a loading control. (c) Fluorescence (the mean fluorometric ratio) resulting from HN-F interaction in the competition assay was quantified as described for panel a. Representative fluorescence images of cotransfected 293T cells 20 h after transfection show HN-F interaction on the cell surface. Cells were also transfected with mCherry (red).

