

ABSTRACT
Of the three foot-and-mouth-disease virus SAT serotypes mainly confined to sub-Saharan Africa, SAT 2 is the strain most often recorded in domestic animals and has caused outbreaks in North Africa and the Middle East six times in the last 25 years, with three apparently separate events occurring in 2012. This study updates the picture of SAT 2 phylogenetics by using all available sequences for the VP1 section of the genome available at the time of writing and uses phylogeographic methods to trace the origin of all outbreaks occurring north of the Sahara since 1990 and identify patterns of spread among countries of endemicity. Transitions between different host species are also enumerated. Outbreaks in North Africa appear to have origins in countries immediately south of the Sahara, whereas those in the Middle East are more often from East Africa. The results of the analysis of spread within sub-Saharan Africa are consistent with it being driven by relatively short-distance movements of animals across national borders, and the analysis of host species transitions supports the role of the African buffalo (Syncerus caffer) as an important natural reservoir.
IMPORTANCE
Foot-and-mouth disease virus is a livestock pathogen of major economic importance, with seven distinct serotypes occurring globally. The SAT 2 serotype, endemic in sub-Saharan Africa, has caused a number of outbreaks in North Africa and the Middle East during the last decades, including three separate incidents in 2012. A comprehensive analysis of all available RNA sequences for SAT 2 has not been published for some years. In this work, we performed this analysis using all previously published sequences and 49 newly determined examples. We also used phylogenetic methods to infer the source country for all outbreaks occurring outside sub-Saharan Africa since 1990 and to reconstruct the spread of viral lineages between countries where it is endemic and movements between different host species.
Introduction
Foot-and-mouth disease (FMD) is a highly contagious disease of cloven-hoofed mammals caused by FMD virus (FMDV), a single-stranded RNA virus of the family Picornaviridae. Seven serotypes exist, two of which (O and A) are found almost worldwide. Another, type C, is more geographically restricted and has not been detected anywhere in the world since 2004, while the Asia-1 serotype is normally confined to southern Asia (1, 2). The remaining three serotypes are the three Southern African Territories (SAT) viruses, designated SAT 1, SAT 2, and SAT 3, the first two of which are endemic in countries of Africa south of the Sahara; outbreaks due to SAT 3 in domesticated livestock have been confined to a few countries in southern Africa. SAT 2, the focus of this study, is the SAT serotype most often recorded in domestic animals (3) and is widely distributed across the continent, having been identified as far west as Senegal, east as Ethiopia, and south as South Africa. It is further subclassified into 14 topotypes, designated I to XIV, defined as having 80% nucleotide identity in the VP1 coding region (4, 5).
SAT 2 has crossed the Sahara and caused outbreaks in North Africa and the Middle East on several occasions in recent years. Middle Eastern outbreaks occurred in North Yemen in 1990 (6) and in Saudi Arabia and Kuwait in 2000 (1). In North Africa, it appeared in Libya in 2003 after an apparent absence from the region for around 50 years (7). In 2012, outbreaks occurred in Egypt, the Palestinian Territories, Libya, and Bahrain (6). While it might be surmised that the occurrence of so many events in a single year might be the result of a single introduction that spread further once established north of the Sahara, Ahmed et al. (6) conducted a genetic study of the viruses involved and found that this did not appear to be the case. Although the bulk of the Egyptian and Palestinian isolates are closely related, those from Libya and Bahrain are of quite distinct lineages. The Bahraini virus is even of a different topotype. Furthermore, one of the samples obtained from Egypt proved to be yet another lineage, distinct from the others collected in the country during the epidemic. For the virus to escape from sub-Saharan Africa four times in 1 year is unprecedented, and it has been suggested that the political changes in the region from 2011 onwards (the “Arab Spring”) may have played a role (http://www.bbsrc.ac.uk/news/food-security/2012/120613-f-arab-spring-spread-of-animal-disease.aspx), as people and their animals were displaced by conflict or changing governments created new trading relationships and thus new pathways for pathogens to follow. For example, Kandeil et al. (8) note that cattle imports to Egypt from other countries in the Nile basin increased following the Egyptian revolution of 2011 due to improved political relationships between the governments involved.
The epidemiology of the SAT serotypes in sub-Saharan Africa is distinct from that for other serotypes in Africa and elsewhere in that there exists a wildlife reservoir in the form of African buffalo (Syncerus caffer) in areas where that species is present (9). The disease is very rarely symptomatic in buffalo, and animals can be persistently infected for a period of several years. Since eradication of all infected hosts is therefore not feasible, control has focused on vaccination and prevention of mixing between buffalo and livestock by means of fencing (9, 10). Where SAT serotype epidemics have occurred in locations in proximity to areas with buffalo populations, they have sometimes been linked to compromised fences (11). Since other wild mammals, such as impala (Aepyceros melampus) and other antelopes, are susceptible to FMDV, another cause for concern is the ability of these species to jump over fences and spread infection in that way (9).
It has been some time since the last published phylogenetic analyses of all known RNA sequences for SAT 2 (12). Since then, the number of available sequences has almost quadrupled, and information on viruses from a much wider range of locations has been added to nucleotide databases. Reclassification of SAT 2 topotypes has also occurred during that time (4, 5). Recently developed phylogenetic techniques enable analyses such as estimation of change in viral genetic diversity over time (13, 14) and the enumeration of historical changes of discrete character states, such as country of origin or host species, on the phylogenetic tree (15). This study aims to update the complete picture of SAT 2 phylogenetics to include all sequences available in 2013, including some previously unpublished, and to apply the new methods to examine the source of all recorded outbreaks occurring beyond sub-Saharan Africa since 1990, as well as movement patterns of lineages between countries where the virus is endemic and between host species.
RESULTS
The data.
All available sequences for the VP1 gene of SAT 2 serotype FMDV were downloaded from GenBank (http://www.ncbi.nlm.nih.gov/genbank/). There were a total of 201 records for distinct isolates available. An additional 49 previously unpublished sequences were also analyzed; information on the origins of these can be found in Table S1 in the supplemental material. This gives a total data set of 250 sequences. All sequences were 648 bp in length, with the exception of five West African examples (all of topotype VI), which were each 651 bp. Table 1 summarizes the data, and Table S2 gives more detailed information. Since all relevant sequences were sampled prior to the partition of Sudan in 2011, the country was treated as a single location state for this analysis. Two hundred fifteen sequences were from sub-Saharan countries, and the remaining 35 were from outbreaks in North Africa and the Middle East.
TABLE 1 .
Countries and dates of sampling for available FMDV SAT 2
| Country | No. of isolates | Date or date range (yr) |
|---|---|---|
| Angola | 1 | 1974 |
| Bahrain | 5 | 2012 |
| Botswana | 6 | 1977–1998 |
| Burundi | 2 | 1986–1991 |
| Cameroon | 3 | 2000–2005 |
| Côte d’Ivoire | 1 | 1990 |
| Democratic Republic of the Congo (or Zaire) | 2 | 1974–1982 |
| Egypt | 22 | 2012 |
| Eritrea | 3 | 1998 |
| Ethiopia | 25 | 1990–2010 |
| The Gambia | 2 | 1979 |
| Ghana | 2 | 1990–1991 |
| Kenya | 65 | 1957–2007 |
| Libya | 5 | 2003–2012 |
| Malawi | 1 | 1975 |
| Mozambique | 3 | 1970–1983 |
| Namibia (or South West Africa) | 4 | 1989–1998 |
| Niger | 1 | 2005 |
| Nigeria | 2 | 1975–2007 |
| North Yemen | 1 | 1990 |
| Palestinian Autonomous Territories | 1 | 2012 |
| Rwanda | 4 | 1996–2004 |
| Saudi Arabia | 1 | 2000 |
| Senegal | 5 | 1975–2009 |
| South Africa | 31 | 1959–2001 |
| Sudan (and South Sudan)a | 6 | 1977–2010 |
| Tanzania | 2 | 1975–1986 |
| Togo | 1 | 1990 |
| Uganda | 13 | 1975–2007 |
| Zambia (or Northern Rhodesia)b | 6 | 1948–1996 |
| Zimbabwe (or Rhodesia) | 24 | 1972–2003 |
| All sequences | 250 | 1948–2012 |
All isolates sampled before partition of country in 2011.
Isolate RHO/1/48, whose name suggests an origin in modern-day Zimbabwe, was in fact sampled in Northern Rhodesia, which is modern-day Zambia (see http://www.picornaviridae.com/aphthovirus/fmdv/fmd_history.htm).
Molecular clock and skyride analysis.
A Bayesian phylogenetic analysis was conducted with all 250 VP1 sequences, using the software program BEAST, prerelease version 1.8.0 (16). A relaxed lognormal molecular clock (17) and a Gaussian Markov random field (GMRF) Bayesian skyride tree prior (14) were used. The skyride is a highly parametric method that allows reconstruction of changes in viral population size over the timescale of the tree. Figure 1 is the maximum clade credibility (MCC) tree of this analysis, with branches colored by topotype. The year of the mean time of most recent common ancestor (TMRCA) for all sequences was 1881, with a 95% highest posterior density (HPD) interval from 1853 to 1907.
FIG 1 .

Maximum clade credibility tree of all sequences included in the data set. GenBank accession numbers and countries and dates of sampling are given at the tips; sequences isolated during epidemics in North Africa and the Middle East are in red. Branches are colored and labeled by topotype (I to XIV). Red diamonds indicate clades with a posterior probability of >0.9 (within topotypes, they are omitted for all nodes except for the common ancestor of the topotype).
The estimated parameters of the molecular clock were a mean of 2.45 × 10⁻³ substitutions per site per year (95% HPD: 1.82 × 10⁻³, 3.17 × 10⁻³) and a standard deviation of 0.90 (0.72, 1.09). The reconstructed skyride plot can be seen in Fig. 2. Genetic diversity peaked around 1965 and then began to decline, at a rate that increased around 1995.
FIG 2 .
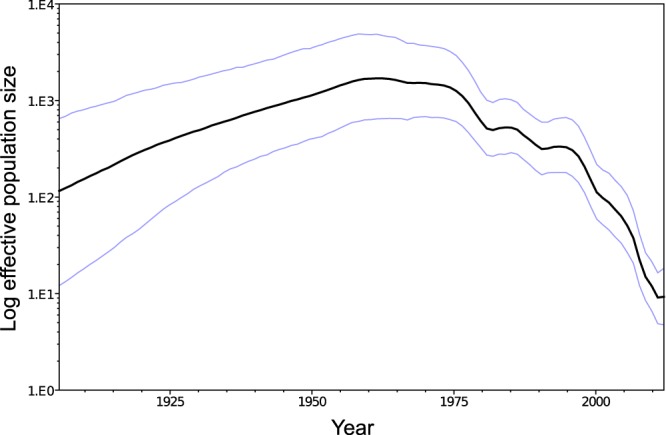
GMRF Bayesian skyride plot of log effective population size against calendar time. Blue lines are the boundaries of the 95% highest posterior density interval.
Phylogeography.
In order to explore the origins of the outbreaks outside sub-Saharan Africa, the Monte Carlo Markov chain (MCMC) output from the previous section was used as the set of trees for a discrete-traits phylogeography analysis (15) using the Markov jumps method to reconstruct movements between countries (18). Figure 3 displays the MCC tree, with branches colored by location of sampling for tips and highest posterior probability location for internal nodes. For clarity, sub-Saharan countries have been grouped by United Nations (UN) region.
FIG 3 .

Maximum clade credibility tree of all sequences; branches are colored by UN region within sub-Saharan Africa or red for outbreaks in other areas. Roman numerals and black diamonds indicate nodes representing the common ancestor of each topotype or, where only one sequence was available for that topotype, the tip corresponding to that sequence.
Figure 4 gives the posterior distributions for the country of origin of each North African and Middle Eastern epidemic occurring since 2000. In a previous analysis of the Egyptian sequences from 2012, Ahmed et al. (6) determined that the isolate EGY/2/2012 (designated strain Alx-12) was most likely the result of a separate introduction to the other sequences from this outbreak (strain Ghb-12). As a result, we examined the origins of these two lineages separately. The possibility that any other epidemic might be the result of multiple introductions was considered, but no such history was reconstructed in any sampled MCMC state. Kenya was overwhelmingly the most likely origin for the 2012 Bahraini virus (posterior probability, 0.89), as was Cameroon for the Ghb-12 lineage of the 2012 Egypt/Palestine outbreak (posterior probability, 0.81). Results were less decisive for the other five outbreaks, with no origin having a posterior probability of more than 0.6. In particular, while the Egyptian Alx-12 lineage appeared most likely to be a descendant of a Sudanese isolate (posterior probability, 0.6), it was also closely related to the virus from 2000 in Saudi Arabia (posterior probability, 0.21). Notably, there was practically no suggestion that any of the 2012 outbreaks were the direct descendants of each other.
FIG 4 .

Posterior probability distributions for the countries or epidemic states that were the origins of reconstructed Markov jumps seeding SAT 2 outbreaks in North African and the Middle East, 2000 to 2012. Only origins with a posterior probability of 0.02 or more are shown individually.
A second phylogeography analysis was conducted by restricting the data set to only the 215 sequences from sub-Saharan Africa, in order to identify patterns of movement within the continent. The map in Fig. 5 displays supported nonzero rates of transition (Bayes factor [BF] > 3) between countries of endemicity. Most identified links were across a shared land border; longer-distance links were usually in cases where there were intervening countries from which samples were not available. Longer links also tended to have lower BF support.
FIG 5 .

Map of Africa demonstrating links between countries with Bayes factor (BF) support of >3 identified from the BSSVS analysis. Countries are colored by number of sequences available from that location; links are colored by BF value.
Host species analysis.
A final discrete-traits analysis was performed to investigate transitions between different host species for the virus. Only 169 sequences had an identified host, which was S. caffer in 28 cases, domestic cattle in 130, A. melampus in 10, and a pig in 1. The latter was excluded because a single example was unlikely to be adequate for the purpose of investigating the sources of infections in pigs. Figure 6 shows the MCC tree. Branches are colored by host; clades representing topotypes are annotated with a diamond. The most likely root state (the host species of the common ancestor of all known SAT 2 isolates) was S. caffer, with a posterior probability of 0.53.
FIG 6 .
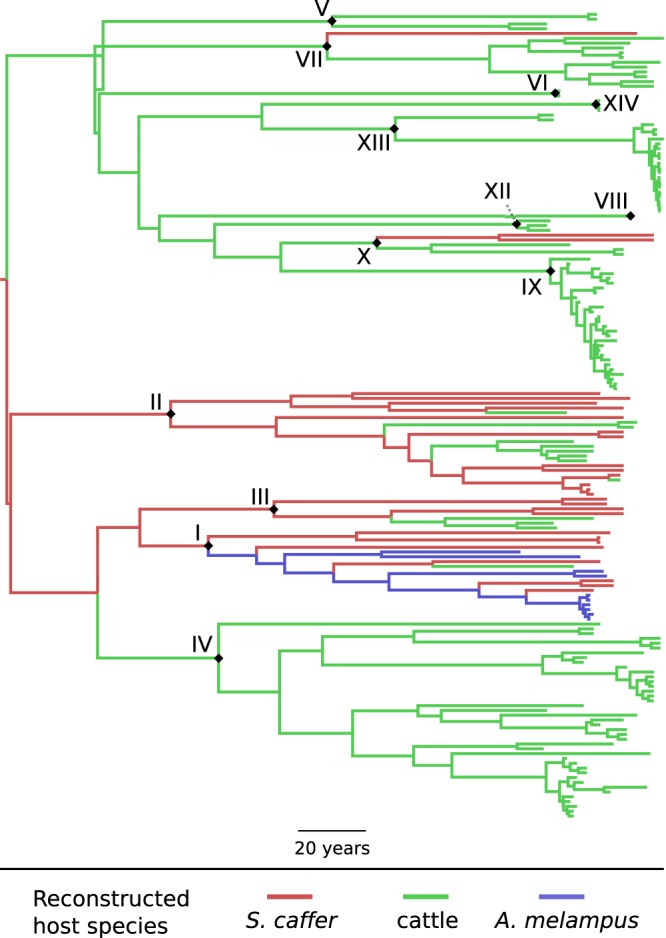
Maximum clade credibility tree of 168 sequences colored by reconstructed host species. Branches are colored by host. Roman numerals and black diamonds indicate nodes representing the common ancestor of each topotype or, where only one sequence was available for that topotype, the tip corresponding to that sequence.
Table 2 summarizes the results of a Markov jumps analysis for changes of host species. The median number of jumps across all trees in the posterior are given for each pair of hosts, along with the posterior probability that the total number of such transitions was nonzero. The median number was nonzero in all cases except transitions from cattle to A. melampus, but the only type of transition for which there was 95% support for at least one such jump occurring was from S. caffer to cattle.
TABLE 2 .
Median (across all trees in the posterior sample) numbers of reconstructed Markov jumps between each pair of species in the host species analysisa
| Origin | No. of jumps to destination |
||
|---|---|---|---|
| S. caffer | Cattle | A. melampus | |
| S. caffer | 10 (1.00) | 3 (0.85) | |
| Cattle | 5 (0.94) | 0 (0.48) | |
| A. melampus | 6 (0.88) | 1 (0.53) | |
This posterior sample of trees is summarized in Fig. 6. Numbers in parentheses are posterior probabilities for at least one such jump having occurred since the time of the common ancestor of the 168 isolates.
DISCUSSION
This work has applied recently developed phylogenetic methods to the VP1 gene sequences of all SAT 2 isolates available at the time of writing. It has some limitations, largely imposed by the nature of the available data. The sampling is effectively opportunistic and markedly unbalanced, and the exact effect of this on the discrete-trait inference methods used here for both geography and host species is unclear and warrants investigation in its own right. This makes the results of the host species analysis in particular somewhat incomplete, first because very few countries have available sequences from both cattle and wild animals and second because no sequences at all are available from sheep or goats, despite the hypothesis that they play an important role in the maintenance of FMDV populations (19). In addition, use of simply the country of origin as a location state gives coarse resolution; a lack of links between locations may be simply the result of a lack of sampling in areas sufficiently close to the relevant borders, but restricting to only those sequences where more-detailed location information is available would have greatly decreased the size of the data set.
The VP1 segment was used simply because it has been the most commonly sequenced section of the genome, but use of a larger part would be more suitable and is now more viable in the era of next-generation sequencing. At present, there are eight available sequences for the full SAT 2 genome, and an additional seven for the full coding region (polyprotein gene). While recombination within the structural protein region (VP1 to VP3) appears to be rare, and thus it should not be a cause of concern in interpreting this analysis, it is widespread in other parts of the genome (20, 21). This likely renders a naive whole-genome phylogenetic approach inadvisable. Indeed, van Rensburg et al. (22) found that the leader and 3C proteinases of SAT FMDVs displayed branching patterns very different from those of VP1, and it is this recombination that likely explains the findings by Yoon et al. (23) and Lewis-Rogers et al. (24) that when a full-genome analysis is performed, the SAT strains do not form separate clades. However, while the entire genome may not be a good subject for analysis, future work could use the whole structural protein region, rather than just VP1.
The estimated substitution rate of 2.45 × 10⁻³ substitutions per site per year is very similar to the 2.48 × 10⁻³ given by Tully et al. (25) for their analysis of the VP1 segment of all FMDV serotypes but considerably higher than their specific estimate for SAT 2 of 1.07 × 10⁻³, and the 95% HPD interval of 4.90 × 10⁻⁶ to 1.14 × 10⁻³ given there does not overlap the one found here. That estimate, however, is very imprecise compared to the results for all other serotypes in the same paper, and the data set of 32 sequences used by the authors was also much smaller than ours, covering only 10 of the 14 topotypes. The lower substitution rate estimate in that paper naturally corresponded to an earlier estimated TMRCA of the year 1777, with a 95% HPD interval from 1747 to 1913, also very different from the estimate here, although in this case the HPD interval does overlap ours. Yoon et al. (23) also estimated a lower overall substitution rate (1.46 × 10⁻³) for all serotypes, but this analysis was of the full genome, ignoring recombination, and a different rate might be expected. This paper also estimated a much earlier TMRCA for SAT 2 in 1615, with the 95% HPD interval from 1324 to 1866, slightly overlapping ours.
The decline in genetic diversity of FMDV in the latter part of the 20th century has previously been noted by Yoon et al. (23), whose analysis of all seven serotypes also identifies a peak in the middle of the century and a faster decline starting around 2000. A similar peak was also identified by Tully et al. (25), although their analysis suggests a subsequent sharp increase in the last years of the century. A potential explanation for the midcentury decline is the vaccination and fencing measures that have been put in place over the past decades in southern Africa in order to prevent the infection of cattle by wild animals (9, 10). The steeper decline observed starting in the mid-1990s may be a sampling artifact due to the inclusion of a disproportionate number of sequences from comparatively well-sampled epidemics with dates from this time period, since the increased number of coalescent events associated with such data might lead to artificially low estimates of the effective population size. Alternatively, it could reflect a genuine decrease in diversity, possibly due to improving farming practices.
Since FMDV in Africa is presumably generally spread overland by animal movements, the inference of a particular country as the origin of a particular epidemic in this analysis should not be interpreted as it being the last country in which the lineage was present before the start of the epidemic; for example, no strain could have moved directly in this way from Cameroon to Egypt or Libya for the obvious reason that there are intervening countries on any route between them. Instead, this analysis provides a probability distribution of the location of the most-recent ancestor of the outbreak strain that can be identified from the available data; no conclusions can be drawn regarding the route that might have been taken to get from one country to the other. In particular, the wide distribution of topotype VII, from Nigeria to Eritrea, has previously been noted by Bronsvoort et al. (26) and is thought to be the result of extremely long distance cattle movements which are known to occur between Cameroon and Sudan. Thus, although the origins for the Libya 2003 and Ghb-12 outbreaks are suggested to be Cameroon, the lineages could well have first made their way east to Sudan before crossing the Sahara, with Sudan not being identified as their origin because strains more closely related to them than to known Sudanese isolates have never been sampled in that country.
Three separate SAT 2 outbreaks in North Africa and the Middle East in a single year, 9 years after the last such recorded event, might seem unlikely to be independent events, but the evidence here adds further weight to the suggestion (6) that these were not the result of a single introduction and that the concurrence is due to coincidence or to regional circumstances that have made such events more likely. If the latter, this situation may not be particular to SAT 2: a new serotype A virus with a probable origin in sub-Saharan Africa was also discovered in Egypt in 2012 (http://www.wrlfmd.org/fmd_genotyping/2012/WRLFMD-2012-00011%20A%20Egypt%202010-2012.pdf), although whether this was a genuinely new introduction in the very recent past seems an open question, given the fairly frequent occurrence of serotype A in the country (27, 28).
The two topotype IV outbreaks, North Yemen 1990 and Bahrain 2012, were determined to have Kenya or (in the former case) Ethiopia as likely origins. The Bahraini isolates came from cattle that had been recently imported from Saudi Arabia (http://www.promedmail.org/direct.php?id=20120507.1125683). It is unlikely that these strains arrived in the Middle East directly from Kenya by sea; Di Nardo et al. (29) describe cattle movement patterns in the region and did not identify such exports. They do, however, identify imports to Yemen and Saudi Arabia from Somalia, a country whose SAT 2 strains have never been sequenced. Type O FMDV outbreaks in Yemen have previously been traced to cattle from eastern Kenya and Ethiopia traded through markets in Somalia (29), so this would seem the most obvious explanation. Identification of which SAT 2 topotypes are in fact present in Somalia would help confirm this. If the 1990 outbreak originated in Ethiopia, then another possible export route would go through Djibouti.
The Alx-12 strain identified in Egypt is genetically distinct from Ghb-12, and the Markov jumps reconstruction suggests that the most likely origin country was Sudan but that it could also be descended from the 2000 Saudi outbreak. Since it is highly unlikely that both Alx-12 and Ghb-12 were the product of a single viral lineage arriving in Egypt, it seems most probable that there was indeed a fourth 2012 viral escape of this serotype from sub-Saharan Africa. While we did identify different most-likely countries of origin for the two strains, this does not rule out the introductions being the result of the import of the same group of infected animals from Sudan, since the Ghb-12 lineage, originating in Cameroon, may have traveled east on its route to Egypt. If there were indeed two separate introduction events, the cause might be the increase in cattle imports to Egypt identified by Kandeil et al. (8).
The close relationship of Alx-12 to the Saudi strain does suggest another possibility, however: that this lineage may have been present but undetected in North Africa and the Middle East since 2000 or even earlier, its detection in 2012 being the result of the increased surveillance connected to the Ghb-12 outbreak. Since other FMDV serotypes are endemic in these areas (1, 30), it is plausible that it was overlooked. In this scenario the virus persisted in the region following the 2000 outbreak or even was present before that. If true, then the virus is likely to have been maintained in sheep or goats, species in which clinical disease is less likely to be apparent (19). Sheep populations have previously been implicated in maintaining FMDV in these areas (30, 31). Further viral samples from the area and from other countries where topotype VII is present would be required to clarify the picture. A question that also arises is why, in this case, the Ghb-12 introduction would cause a rapidly spreading epidemic and disease control emergency while the existing presence of Alx-12 did not.
Aside from the clear difference between Alx-12 and Ghb-12, there was no suggestion that any other outbreak was the result of multiple introductions, and no lineage of the 2012 outbreak was suggested to be the source of any of the others.
It is generally accepted that FMDV is spread locally in Africa by movements of both livestock and wild animals (that it is frequently subclinical in wild S. caffer is considered a major challenge to control of the disease [32–35]). The phylogeographical analysis within countries of endemicity presented here lends some formal support to this hypothesis, since movements over large distances were rarely indicated except where there were intervening countries from which no samples were available, and where such links were suggested, the Bayes factor support was usually on the low side (as in the links from Malawi to Kenya and from Mozambique to Namibia). Investigation into whether the long-distance links between Cameroon and Nigeria and more distant countries to both the west and the east are genuine would require sequences from intervening nations, which are currently unavailable for the full VP1 gene. However, as mentioned above, the close relationship between sequences from Cameroon and samples from Eritrea and the 2000 Saudi outbreak were previously noted by Bronsvoort et al. (26), who point out that cattle are indeed traded directly from Sudan to Cameroon and could have carried the virus over this distance. At the time, no sequences from Sudan or the Central African Republic were available, so the authors acknowledged that they were unable to conclusively demonstrate this. The picture remains patchy, but this analysis does include Sudanese sequences, and links from Cameroon to both Eritrea and Sudan are supported, providing some further evidence for this hypothesis.
Because of the geographical distribution of the available sequences, much more information is available for countries in eastern or southern Africa than for western and central areas, where the picture is fragmentary at best. The situation in the countries south of Cameroon is particularly unclear; apart from sequences from the Democratic Republic of the Congo that are most closely related to isolates from its east, the only isolate from this region is a single Angolan example from 1974, the unique available sequence from topotype XI. No strains from Equatorial Guinea, Gabon, or the Congo have ever been sequenced. Whether topotype XI still exists and more generally what the status of SAT 2 is in this region would appear to warrant further investigation.
The situation in West Africa is better; there are in fact around 50 sequences from countries from Cameroon westward for partial sections of the VP1 gene that were ineligible for this analysis due to being insufficiently long. Sangaré et al. (36) performed an initial phylogenetic analysis on most of these; an extension to this analysis could perform the same phylogeographical methods on the shorter sequences from this area only.
As mentioned above, the host species analysis should be interpreted with caution due to the incomplete nature of the sampling. While there is not strong support here for the hypothesis that virus escapes from natural parks in southern Africa are the result of impala jumping fences (34, 35), the only available A. melampus sequences are from the Kruger National Park in South Africa and few subsequent cattle sequences are from any country adjacent to the park. While the coloring of branches in Fig. 6 indicates the most probable host for the common ancestor of each topotype, this is unlikely to be reliable, since many topotypes have had isolates sequenced only from cattle, yet there is no reason to believe that they do not also infect buffalo. The role of any other hosts, such as sheep, cannot be investigated. Nevertheless, that SAT 2 originated in S. caffer is consistent with the consensus that buffalo are the maintenance host for the SAT strains (33). Subsequent transitions from S. caffer to cattle are reconstructed with support at the 95% level for the count being nonzero; this is consistent with previous literature implicating buffalo as the cause of epidemics in southern Africa (11). Transitions from S. caffer to A. melampus and vice versa and from cattle to S. caffer are also frequently reconstructed with considerable posterior support for their occurrence but not reaching the 95% level. That transitions from buffalo to impala, at least, must occur is generally accepted (33, 34). It is also feasible that cattle and impala infect buffalo, but that hypothesis is not necessary to explain the epidemiology of the virus.
In summary, this paper has used up-to-date methods and sequence data to update the picture of the behavior of the SAT 2 serotype on a continental level. Support is given for generally accepted characteristics of the virus: that it is spread over generally short distances by the land movements of infected hosts and that African buffalo are an important maintenance host. The previous consensus that the 2012 outbreak strains are unrelated and probably did not have the same origins has been strengthened by a formal phylogeographical analysis. Evidence is also provided that the decline in FMDV genetic diversity in the latter part of the 20th century applies to this serotype. Future work on this virus would be enabled by further sequencing, perhaps of a larger part of the genome, with a more methodological sampling scheme. This should become more and more feasible as the technology improves.
MATERIALS AND METHODS
The data.
Data used were all GenBank records for FMDV serotype SAT 2 that included at least 90% of the VP1 gene (as of May 2013) and sequences for a total of 49 previously unsequenced cell culture-grown type SAT 2 FMDVs that were obtained from the World Reference Laboratory for Foot-and-Mouth Disease Reference Collection. RNA extraction, reverse transcription-PCR (RT-PCR) of the VP1 region, and RNA sequencing of these was performed as previously described (4, 5). Sequences were assembled using SeqMan Pro (Lasergene v.8 package; DNAstar Inc.). GenBank records were examined to exclude duplicates and isolates for which the year of sampling or country of origin were unavailable. Where two or more records from the same isolate were available, the more recently sequenced version was used. Sequences were aligned using the MUSCLE (37) plugin in the software program Geneious 5.6.4 (Biomatters, Ltd.), and trimmed to the VP1 gene only.
Molecular clock and skyride analysis.
The BEAST (16) analysis used a GTR+I+G substitution model, a relaxed uncorrelated lognormal molecular clock (17), and a GMRF Bayesian skyride tree prior (14). Multiple Monte Carlo Markov chain (MCMC) runs of 100,000,000 states each and a burn-in of 10% were combined to obtain a set of 9,000 samples with estimated sample sizes of at least 200 for all numerical model parameters. Tracer 1.5 (http://beast.bio.ed.ac.uk/Tracer) was used to reconstruct the skyride plot and investigate parameter estimates.
Phylogeography.
The first phylogeographical analysis was performed using the tree set from the previous section as the sample of phylogenies. An asymmetric rate matrix was assumed. Traits were selected depending on the status of the disease in the country of sampling as follows: for samples from areas in sub-Saharan Africa where FMDV is endemic, the country was used. However, sequences taken from epidemics in North Africa and the Middle East were treated as separate traits even where (in the case of Libya) more than one epidemic had occurred in a single country. The Alx-12 and Ghb-12 strains from Egypt in 2012 were also treated as separate traits. This allowed investigation of the source of each epidemic and the two Egyptian lineages separately. Since any given outbreak could not be the origin of an earlier one, the rates of transition between such states in this direction (e.g., from Egypt in 2012 to Libya in 2003) were set a priori to be zero. The software program TreeAnnotator 1.7 was used to produce the MCC tree, with branches colored by trait from this analysis.
Geographical movements were reconstructed using the Markov jumps procedure (18) to give times of state changes along each branch of each tree in the posterior output. These were used to estimate a probability distribution for the country of origin of each of the epidemics, as follows: for every tree in the posterior sample, the tips corresponding to all the samples from an epidemic were identified and the node corresponding to their most recent common ancestor found (this was the tip itself in situations where only a single sequence was available for a given epidemic). If the reconstructed location state of this node was not the same as that of the tips, the epidemic was recorded as being the result of multiple introductions in this particular posterior sample. Otherwise, the reconstructed state change that took the lineage into the epidemic state was found, and the trait that was the origin of this jump was recorded. Summarizing this information over all trees from the sample gave the posterior probability distribution of origins.
A second set of phylogenetic trees was produced, using the same molecular clock and tree prior as above, for those sequences coming only from countries of endemicity. A separate phylogeographic analysis was performed on this, using the Bayesian stochastic search variable selection (BSSVS) procedure to identify pairs of countries for which the hypothesis that the rate of movement between them was nonzero was supported by a Bayes factor value greater than 3. For this analysis, a symmetric rate matrix was assumed. The software program Quantum GIS 1.8.0 (http://qgis.osgeo.org) was used to visualize well-supported nonzero rates on a map.
Host species analysis.
A final set of trees was produced by further restricting the data set to those sequences from sub-Saharan Africa with an identified host species. Information from GenBank records and the Picornavirus Home Page (http://www.picornaviridae.com/) was used to provide this information. The posterior set of trees from this was used for the host species analysis. Reconstruction of state changes was again performed using Markov jumps, and the number of transitions between each pair of species was counted for all samples from the MCMC and summarized to give the median number of each type of host-to-host transmission taking place over the phylogeny and the posterior probability that at least one event of each type occurred.
Nucleotide sequence accession numbers.
The 49 newly determined sequences have been submitted to GenBank with accession numbers KF112928 to KF112976.
SUPPLEMENTAL MATERIAL
Locations and dates of sampling, topotypes, GenBank accession numbers, and host species of the 49 previously unpublished FMDV SAT 2 isolates
All isolates used in this study, sorted by country of origin and year; the years appearing here were used to date tips for the phylogenetic analysis, and the country and host species were used as discrete traits for phylogeography
ACKNOWLEDGMENTS
M.D.H. was supported by a Ph.D. studentship from the Scottish Government-funded EPIC program. N.J.K. and J.W. were supported by funding from the Department for Environment, Food and Rural Affairs (Defra), United Kingdom (contract no. SE2939 and SE2940).
We thank members of the Rambaut and Leigh Brown groups at Edinburgh for help with the analyses.
Footnotes
Citation Hall MD, Knowles NJ, Wadsworth J, Rambaut A, Woolhouse MEJ. 2013. Reconstructing geographical movements and host species transitions of foot-and-mouth disease virus serotype SAT 2. mBio 4(5):e00591-13. doi:10.1128/mBio.00591-13.
REFERENCES
- 1. Knowles NJ, Samuel AR. 2003. Molecular epidemiology of foot-and-mouth disease virus. Virus Res. 91:65–80 [DOI] [PubMed] [Google Scholar]
- 2. Sangula AK, Siegismund HR, Belsham GJ, Balinda SN, Masembe C, Muwanika VB. 2011. Low diversity of foot-and-mouth disease serotype C virus in Kenya: evidence for probable vaccine strain re-introductions in the field. Epidemiol. Infect. 139:189–196 [DOI] [PubMed] [Google Scholar]
- 3. Thomson GR, Bastos ADS, Leotta DF, Primozich JF, Beach KW. 2004. Foot-and-mouth disease, p 1325–1265 In Coetzer JAW, Tustin RC, Leotta DF, Primozich JF, Beach KW. (ed), Infectious diseases of livestock, vol 2, 2nd ed. Oxford University Press Southern Africa, Oxford, United Kingdom [Google Scholar]
- 4. Ayelet G, Mahapatra M, Gelaye E, Egziabher BG, Rufeal T, Sahle M, Ferris NP, Wadsworth J, Hutchings GH, Knowles NJ. 2009. Genetic characterization of foot-and-mouth disease viruses, Ethiopia, 1981–2007. Emerg. Infect. Dis. 15:1409–1417 [DOI] [PMC free article] [PubMed] [Google Scholar]
- 5. Habiela M, Ferris NP, Hutchings GH, Wadsworth J, Reid SM, Madi M, Ebert K, Sumption KJ, Knowles NJ, King DP, Paton DJ. 2010. Molecular characterization of foot-and-mouth disease viruses collected from Sudan. Transbound. Emerg. Dis. 57:305–314 [DOI] [PubMed] [Google Scholar]
- 6. Ahmed HA, Salem SA, Habashi AR, Arafa AA, Aggour MG, Salem GH, Gaber AS, Selem O, Abdelkader SH, Knowles NJ, Madi M, Valdazo-González B, Wadsworth J, Hutchings GH, Mioulet V, Hammond JM, King DP. 2012. Emergence of foot-and-mouth disease virus SAT 2 in Egypt during 2012. Transbound. Emerg. Dis. 59:476–481 [DOI] [PubMed] [Google Scholar]
- 7. Valarcher JF, Leforban Y, Rweyemamu M, Roeder PL, Gerbier G, Mackay DK, Sumption KJ, Paton DJ, Knowles NJ. 2008. Incursions of foot-and-mouth disease virus into Europe between 1985 and 2006. Transbound. Emerg. Dis. 55:14–34 [DOI] [PubMed] [Google Scholar]
- 8. Kandeil A, El-Shesheny R, Kayali G, Moatasim Y, Bagato O, Darwish M, Gaffar A, Younes A, Farag T, Kutkat MA, Ali MA. 2013. Characterization of the recent outbreak of foot-and-mouth disease virus serotype SAT2 in Egypt. Arch. Virol. 158:619–627 [DOI] [PubMed] [Google Scholar]
- 9. Vosloo W, Bastos AD, Sangare O, Hargreaves SK, Thomson GR. 2002. Review of the status and control of foot and mouth disease in sub-Saharan Africa. Rev. Sci. Tech. 21:437–449 [DOI] [PubMed] [Google Scholar]
- 10. Hunter P. 1998. Vaccination as a means of control of foot-and-mouth disease in sub-Saharan Africa. Vaccine 16:261–264 [DOI] [PubMed] [Google Scholar]
- 11. Vosloo W, Boshoff K, Dwarka R, Bastos A. 2002. The possible role that buffalo played in the recent outbreaks of foot-and-mouth disease in South Africa. Ann. N. Y. Acad. Sci. 969:187–190 [DOI] [PubMed] [Google Scholar]
- 12. Bastos AD, Haydon DT, Sangaré O, Boshoff CI, Edrich JL, Thomson GR. 2003. The implications of virus diversity within the SAT 2 serotype for control of foot-and-mouth disease in sub-Saharan Africa. J. Gen. Virol. 84:1595–1606 [DOI] [PubMed] [Google Scholar]
- 13. Drummond AJ, Rambaut A, Shapiro B, Pybus OG. 2005. Bayesian coalescent inference of past population dynamics from molecular sequences. Mol. Biol. Evol. 22:1185–1192 [DOI] [PubMed] [Google Scholar]
- 14. Minin VN, Bloomquist EW, Suchard MA. 2008. Smooth skyride through a rough skyline: Bayesian coalescent-based inference of population dynamics. Mol. Biol. Evol. 25:1459–1471 [DOI] [PMC free article] [PubMed] [Google Scholar]
- 15. Lemey P, Rambaut A, Drummond AJ, Suchard MA. 2009. Bayesian phylogeography finds its roots. PLOS Comput. Biol. 5:e1000520. 10.1371/journal.pcbi.1000520 [DOI] [PMC free article] [PubMed] [Google Scholar]
- 16. Drummond AJ, Suchard MA, Xie D, Rambaut A. 2012. Bayesian phylogenetics with BEAUti and the BEAST. Mol. Biol. Evol. 29:1969–1973 [DOI] [PMC free article] [PubMed] [Google Scholar]
- 17. Drummond AJ, Ho SY, Phillips MJ, Rambaut A. 2006. Relaxed phylogenetics and dating with confidence. PLOS Biol. 4:e88. 10.1371/journal.pbio.0040088 [DOI] [PMC free article] [PubMed] [Google Scholar]
- 18. Minin VN, Suchard MA. 2008. Counting labeled transitions in continuous-time Markov models of evolution. J. Math. Biol. 56:391–412 [DOI] [PubMed] [Google Scholar]
- 19. Bronsvoort BM, Tanya VN, Kitching RP, Nfon C, Hamman SM, Morgan KL. 2003. Foot and mouth disease and livestock husbandry practices in the Adamawa Province of Cameroon. Trop. Anim. Health Prod. 35:491–507 [DOI] [PubMed] [Google Scholar]
- 20. Carrillo C, Tulman ER, Delhon G, Lu Z, Carreno A, Vagnozzi A, Kutish GF, Rock DL. 2005. Comparative genomics of foot-and-mouth disease virus. J. Virol. 79:6487–6504 [DOI] [PMC free article] [PubMed] [Google Scholar]
- 21. Jackson AL, O’Neill H, Maree F, Blignaut B, Carrillo C, Rodriguez L, Haydon DT. 2007. Mosaic structure of foot-and-mouth disease virus genomes. J. Gen. Virol. 88:487–492 [DOI] [PubMed] [Google Scholar]
- 22. van Rensburg HG, Nel LH. 1999. Characterization of the structural-protein-coding region of SAT 2 type foot-and-mouth disease virus. Virus Genes 19:229–233 [DOI] [PubMed] [Google Scholar]
- 23. Yoon SH, Park W, King DP, Kim H. 2011. Phylogenomics and molecular evolution of foot-and-mouth disease virus. Mol. Cells 31:413–421 [DOI] [PMC free article] [PubMed] [Google Scholar]
- 24. Lewis-Rogers N, McClellan DA, Crandall KA. 2008. The evolution of foot-and-mouth disease virus: impacts of recombination and selection. Infect. Genet. Evol. 8:786–798 [DOI] [PubMed] [Google Scholar]
- 25. Tully DC, Fares MA. 2008. The tale of a modern animal plague: tracing the evolutionary history and determining the time-scale for foot and mouth disease virus. Virology 382:250–256 [DOI] [PubMed] [Google Scholar]
- 26. Bronsvoort BM, Radford AD, Tanya VN, Kitching RP, Nfon C, Morgan KL. 2004. Molecular epidemiology of foot-and-mouth disease viruses in the Adamawa province of Cameroon. J. Clin. Microbiol. 42:2186–2196 [DOI] [PMC free article] [PubMed] [Google Scholar]
- 27. Knowles NJ, Nazem Shirazi MH, Wadsworth J, Swabey KG, Stirling JM, Statham RJ, Li Y, Hutchings GH, Ferris NP, Parlak U, Özyörük F, Sumption KJ, King DP, Paton DJ. 2009. Recent spread of a new strain (A-Iran-05) of foot-and-mouth disease virus type A in the Middle East. Transbound. Emerg. Dis. 56:157–169 [DOI] [PubMed] [Google Scholar]
- 28. Knowles NJ, Wadsworth J, Reid SM, Swabey KG, El-Kholy AA, Abd El-Rahman AO, Soliman HM, Ebert K, Ferris NP, Hutchings GH, Statham RJ, King DP, Paton DJ. 2007. Foot-and-mouth disease virus serotype A in Egypt. Emerg. Infect. Dis. 13:1593–1596 [DOI] [PMC free article] [PubMed] [Google Scholar]
- 29. Di Nardo A, Knowles NJ, Paton DJ. 2011. Combining livestock trade patterns with phylogenetics to help understand the spread of foot and mouth disease in sub-Saharan Africa, the Middle East and South-East Asia. Rev. Sci. Tech. 30:63–85 [DOI] [PubMed] [Google Scholar]
- 30. Samuel AR, Knowles NJ, Mackay DK. 1999. Genetic analysis of type O viruses responsible for epidemics of foot-and-mouth disease in North Africa. Epidemiol. Infect. 122:529–538 [DOI] [PMC free article] [PubMed] [Google Scholar]
- 31. Rweyemamu M, Roeder P, Mackay D, Sumption K, Brownlie J, Leforban Y, Valarcher JF, Knowles NJ, Saraiva V. 2008. Epidemiological patterns of foot-and-mouth disease worldwide. Transbound. Emerg. Dis. 55:57–72 [DOI] [PubMed] [Google Scholar]
- 32. Ayebazibwe C, Mwiine FN, Tjørnehøj K, Balinda SN, Muwanika VB, Ademun Okurut AR, Belsham GJ, Normann P, Siegismund HR, Alexandersen S. 2010. The role of African buffalos (Syncerus caffer) in the maintenance of foot-and-mouth disease in Uganda. BMC Vet. Res. 6:54. 10.1186/1746-6148-6-54 [DOI] [PMC free article] [PubMed] [Google Scholar]
- 33. Bastos AD, Boshoff CI, Keet DF, Bengis RG, Thomson GR. 2000. Natural transmission of foot-and-mouth disease virus between African buffalo (Syncerus caffer) and impala (Aepyceros melampus) in the Kruger National Park, South Africa. Epidemiol. Infect. 124:591–598 [DOI] [PMC free article] [PubMed] [Google Scholar]
- 34. Vosloo W, Thompson PN, Botha B, Bengis RG, Thomson GR. 2009. Longitudinal study to investigate the role of impala (Aepyceros melampus) in foot-and-mouth disease maintenance in the Kruger National Park, South Africa. Transbound. Emerg. Dis. 56:18–30 [DOI] [PubMed] [Google Scholar]
- 35. Thomson GR, Vosloo W, Bastos AD. 2003. Foot and mouth disease in wildlife. Virus Res. 91:145–161 [DOI] [PubMed] [Google Scholar]
- 36. Sangaré O, Bastos AD, Venter EH, Vosloo W. 2004. A first molecular epidemiological study of SAT-2 type foot-and-mouth disease viruses in West Africa. Epidemiol. Infect. 132:525–532 [DOI] [PMC free article] [PubMed] [Google Scholar]
- 37. Edgar RC. 2004. MUSCLE: multiple sequence alignment with high accuracy and high throughput. Nucleic Acids Res. 32:1792–1797 [DOI] [PMC free article] [PubMed] [Google Scholar]
Associated Data
This section collects any data citations, data availability statements, or supplementary materials included in this article.
Supplementary Materials
Locations and dates of sampling, topotypes, GenBank accession numbers, and host species of the 49 previously unpublished FMDV SAT 2 isolates
All isolates used in this study, sorted by country of origin and year; the years appearing here were used to date tips for the phylogenetic analysis, and the country and host species were used as discrete traits for phylogeography