

Abstract
Individuals with heavy prenatal alcohol exposure can experience significant deficits in cognitive and psychosocial functioning and alterations in brain structure that persist into adulthood. In this report, data from 99 participants collected across three sites (Los Angeles and San Diego, California, and Cape Town, South Africa) were analyzed to examine relationships between brain structure, neurocognitive function, facial morphology, and maternal reports of quantities of alcohol consumption during the first trimester. Across study sites, we found highly significant volume reductions in the FASD group for all of the brain regions evaluated. After correcting for scan location, age, and total brain volume, these differences remained significant in some regions of the basal ganglia and diencephalon. In alcohol‐exposed subjects, we found that smaller palpebral fissures were significantly associated with reduced volumes in the ventral diencephalon bilaterally, that greater dysmorphology of the philtrum predicted smaller volumes in basal ganglia and diencephalic structures, and that lower IQ scores were associated with both smaller basal ganglia volumes and greater facial dysmorphology. In subjects from South Africa, we found a significant negative correlation between intracranial volume and total number of drinks per week in the first trimester. These results corroborate previous reports that prenatal alcohol exposure is particularly toxic to basal ganglia and diencephalic structures. We extend previous findings by illustrating relationships between specific measures of facial dysmorphology and the volumes of particular subcortical structures, and for the first time show that continuous measures of maternal alcohol consumption during the first trimester relates to overall brain volume reduction. Hum Brain Mapp, 2012. © 2011 Wiley Periodicals, Inc.
Keywords: prenatal alcohol exposure, teratogenic effects of alcohol, facial abnormalities, brain development, developmental defects
INTRODUCTION
Alcohol crosses the placenta and the blood‐brain barrier and exerts teratogenic effects on the developing fetus through various mechanisms [Pollard,2007]. As a result, children exposed to alcohol prenatally can experience significant deficits in cognitive and psychosocial functioning, alterations in brain structure and function, as well as various facial dysmorphologies. Diagnosis of Fetal Alcohol Syndrome (FAS) focuses on four criteria: facial dysmorphology (short palpebral fissures, a smooth philtrum, and a thin upper vermillion), growth deficiency, evidence of CNS dysfunction, and prenatal exposure to alcohol [Hoyme et al.,2005]. Many alcohol‐exposed children do not meet full criteria for a diagnosis of FAS, yet differences in brain structure have been reported in these children [Astley et al.,2009b; Sowell et al.2001a,b,2002a,b,2008a], who also experience significant and debilitating cognitive and behavioral impairments that impact their daily functioning [Adnams et al.,2001; Aragon et al.,2008a; Kodituwakku et al.,2006; Mattson and Riley,1998; Mattson et al.,2001]. Thus, a more inclusive term to describe a wide range of symptom severity has emerged. Fetal alcohol spectrum disorders (FASD) encompasses four diagnostic categories, including: FAS, Partial FAS (PFAS), alcohol related neurodevelopmental disorder (ARND), and alcohol related birth defects (ARBD) [Hoyme et al.,2005].
In children and adolescents across the range of FASD, neuropsychological studies have reported deficits in most cognitive domains measured, including overall intellectual functioning [Mattson et al.,1997], learning [Mattson and Roebuck,2002], attention/working memory [Lee et al.,2004; Mattson et al.,2006], executive skills [Mattson et al.,1999], speed of processing [Burden et al.,2005; Roebuck‐Spencer et al.,2004], and academic skills [Mattson et al.,1998]. Structural imaging studies have detected abnormalities related to prenatal alcohol exposure in multiple brain systems, including frontal [Sowell et al.,2002a,2008a], parietal [Archibald et al.,2001; Sowell et al.,2001b,2002a,2008a], and temporal regions [Sowell et al.,2001b,2008a], cerebellum [O'Hare et al.,2005; Sowell et al.,1996], basal ganglia [Archibald et al.,2001; Cortese et al.,2006; Mattson et al.,1996], and in the white matter that connects these brain regions [Bookstein et al.,2001; Fryer et al.,2009; Ma et al.,2005; Riley et al.,1995; Sowell et al.,2001a,2008b; Swayze et al.,1997; Wozniak et al.,2006]. Some studies have found relationships between these anatomical differences and cognitive function, suggesting clinical significance to the structural brain abnormalities [Dodge et al.,2009; Lebel et al.,2010; O'Hare et al.,2005; Sowell et al.,2001a,2008a,b]. Abnormal concentrations of some neurotransmitter metabolites within the brains of children with prenatal alcohol exposure have also been reported [Fagerlund et al.,2006; Cortese et al.,2006; Astley et al.,2009b], and functional imaging studies have found significant differences in brain activation related to working memory [Astley et al.,2009a; Malisza et al.,2005; O'Hare et al.,2009], verbal learning [Sowell et al.,2007], inhibitory control [Fryer et al.,2007], and number processing [Meintjes et al.,2010] in children and adolescents with FASD.
The NIAAA‐funded Collaborative Initiative on Fetal Alcohol Spectrum Disorders (CIFASD) aims to identify subtle brain alterations and facial characteristics to help define prenatal alcohol exposure across the broader spectrum of FASD, to dissect the relationship between facial and brain dysmorphology, and to correlate brain abnormalities with neurocognitive functioning [Mattson et al.,2010]. In a macaque model, the facial dysmporphology resulting from alcohol exposure during early gestation has been shown to correlate with cognitive deficits [Astley et al.,1999]. In human subjects, a negative correlation between facial D‐score (a discriminant score based on proxy measures of facial features and thought to represent the magnitude of expression of the FAS facial phenotype [Astley and Clarren,2001]) and the volume or area of certain brain structures has recently been reported [Astley et al.,2009c]. Other human studies have reported associations between total dysmorphology scores, head circumference, and intellectual functioning [Aragon et al.,2008a], and relationships between maternal drinking behaviors, cognitive functioning, and overall dysmorphology scores [May et al.,2006,2007,2008]. Nevertheless, relationships between specific facial abnormalities and alterations in brain structure in humans are not well understood. Identifying possible associations between particular face and brain abnormalities and examining their relationship with neurocognitive functioning is critical to our further understanding of the impact of prenatal alcohol exposure on the developing human.
In this study, data collected across three institutions were analyzed to examine relationships between brain structure, intellectual functioning, and measures of facial morphology, specifically palpebral fissure length (PFL) and appearance of the philtrum. We expected that children with FASD would show significant brain volume reductions compared to controls. This follows logically since microcephaly has long been the hallmark of the diagnosis of FAS [Jones and Smith,1973], and this has proven to be consistent in comparative studies across populations [May et al.,2010]. We also expected that these brain volume reductions would be most prominent in striatal structures, consistent with the published literature [Archibald et al.,2001; Mattson et al.,1996], and that these differences would remain significant even after controlling for the effects of variation in overall brain volume, which has been shown to be highly correlated with the volume of subcortical structures in children and adolescents [Jernigan et al.,1991; Sowell et al.,2002c]. Further, we expected that greater facial dysmorphology would be associated both with greater brain volume reductions and lower intellectual functioning, in accordance with the diagnostic basis of FAS [Jones and Smith,1975].
Beyond these confirmatory hypotheses, we also predicted that philtrum lipometer and PFL scores would correlate more strongly with different brain structures, since ocular development is initiated in the tissues of the ventral diencephalon, whereas median facial dysmorphology (involving the upper lip) occur concurrently with deficiencies of tissues derived from the telencephalon in mouse models of prenatal alcohol exposure [Godin et al.,2010; Schambra et al.,1990; Sulik,1984]. In addition, we hypothesized that, due to a possible reorganization of circuits in children with heavy prenatal alcohol exposure, brain structure‐function relationships would be altered in exposed subjects. Finally, based on the literature suggesting that greater prenatal alcohol exposure is associated with smaller head circumference [O'Connor and Paley,2006] and that head size decreases as the severity of the FASD diagnosis increases [May,2007], we predicted that heavier maternal drinking would be associated with smaller brain size within the exposed group.
METHODS
Participants
Ninety‐nine subjects were studied with structural magnetic resonance imaging (MRI) collected at three sites: Los Angeles (LA, age range 8–16), Cape Town, South Africa (SA, age range 13–15), and San Diego (SD, age range 10–14). Participants were classified into one of two groups. The FASD group included 56 subjects (22 from LA, 20 from SA, and 14 from SD) and the unexposed control group comprised 43 participants (12 from LA, 12 from SA, and 19 from SD). The ethnic composition of participants varied by site. In LA and SD, subjects reported diverse racial backgrounds, including American Indians, Asians, Native Hawaiians, African Americans, with a majority of participants classified as non‐Hispanic Whites. In SA, however, participants were much more ethnically homogenous. Most subjects recruited at the SA site were classified as “Cape Coloured,” a racial category comprising people of mixed ancestry from intermarriages of Black African populations (primarily of Khoi and San tribal origins), Indonesians, European whites, and some Asians [May et al.,2007].
In LA, exposed children were recruited through the University of California, Los Angeles Fetal Alcohol and Related Disorders clinic. Exposure status was established by extensive interviews and questionnaires administered to the parents or adult guardians of participants. Additionally, social, medical, and/or legal records were used when available to confirm exposure histories. In SA, exposed children were recruited through the University of Cape Town, from a community in this region which has one of the highest documented rates of FASD in the world [May,2007]. All of the South African subjects had been diagnosed previously as FAS, PFAS, or controls from a population‐based study of the epidemiology of FASD among first graders [May,2007], and their diagnoses were reconfirmed for this study, through verification of original raw data and diagnosis records. Exposure status for the SA sample was established through maternal interview and questionnaires with the birth mothers (except for collateral information for three cases). For 17 of the 20 FASD participants from SA, quantitative measures of quantity, frequency and timing of the prenatal exposure were obtained, including total number of drinks per week during each trimester, and average number of drinks per occasion during each trimester [May et al.,2008]. In SD, exposed participants were recruited through the San Diego State University Center for Behavioral Teratology. Exposure status was established by extensive interviews and questionnaires administered to the parents or adult guardians of participants. Additionally, social, medical, and/or legal records were used when available to confirm exposure histories.
Two subgroups of children with prenatal alcohol exposure were included in the FASD group in this study. The first one was composed of children with FAS, who had two of the three typical facial features of FAS (short PFL, smooth philtrums, or thin upper vermillions) and either growth deficiency, microcephaly, or both. The second subgroup consisted of children who were exposed to alcohol prenatally but did not meet the physical criteria for FAS. These included subjects diagnosed with PFAS, ARND, and children who did not meet the criteria for any particular diagnosis, but whose prenatal alcohol exposure had been clearly established. More details about the diagnostic and inclusion criteria used by the CIFASD dysmorphology core are provided elsewhere [Mattson et al.,2010]. Participants were excluded from the FASD group for evidence of other known causes of intellectual disability, such as chromosomal abnormalities and known exposure to other teratogenic agents. Unexposed control subjects were recruited from ongoing studies at each site or specifically for this study, mainly through advertisements and word of mouth. Control participants were screened for prenatal alcohol exposure and excluded from participation in the study if they were prenatally exposed to more than one drink per week on average, or more than two drinks on any one occasion during pregnancy. Additional exclusion criteria for both the control and FASD groups included significant head injury with loss of consciousness for more than 30 min, significant physical (e.g., motor and sensory) or psychiatric (e.g., psychosis) disability.
Facial and Neurocognitive Evaluations
Participants at all three sites were examined by a trained member of the CIFASD dysmorphology core using standardized methodology [Hoyme et al.,2005; Jones et al.,2006]. Palpebral fissure length was measured using a rigid ruler marked in millimeters held against the lower eyelid [Hoyme et al.,2005]. The morphological characteristics of the philtrum were assessed and scored with the lip/philtrum guide (“lipometer”) described by Astley and Clarren [Astley and Clarren,2000]. Participants were assigned a score of 1 through 5, with a higher score representing greater dysmorphology of the philtrum. All children eligible for neuropsychological testing were given a standardized test battery, including the Wechsler Intelligence Scale for Children, Fourth Edition (WISC‐IV) [Wechsler,2003], from which a Full Scale IQ (FSIQ) score was derived. Trained examiners administered the test battery to children in one day. Tests were scored by the examiners and checked for accuracy by a second rater. Whenever possible, examiners were blind to subject group membership. Methodology of the CIFASD clinical projects are described in detail elsewhere [Mattson et al.,2010].
Image Acquisition
In LA, high‐resolution T1‐weigthed sagittal volumes were collected from a 1.5 Tesla Siemens Sonata scanner, with repetition time (TR) = 1,900 ms, echo time (TE) = 4.38 ms, flip angle = 15°, matrix size = 256 × 256 × 160 mm3, field of view (FOV) = 256 mm, voxel size = 1 × 1 × 1 mm3, and acquisition time = 8 min, 8 s. In SA, high‐resolution T1‐weigthed sagittal volumes were collected from a 3 Tesla Siemens Allegra scanner, with repetition time (TR) = 2,200 ms, echo time (TE) = 5.16 ms, flip angle = 12°, matrix size = 256 × 256 × 160 mm3, field of view (FOV) = 256 mm, voxel size = 1 × 1 × 1 mm3, and acquisition time = 7 min, 4 s. In SD, high‐resolution T1‐weigthed sagittal volumes were collected from a 3 Tesla GE Signa Excite scanner, with repetition time (TR) = 7.8 ms, echo time (TE) = 3.0 ms, flip angle = 12°, matrix size = 256 × 256 × 192 mm3, field of view (FOV) = 240 mm, voxel size = 0.938 × 0.938 × 1 mm3, and acquisition time = 7 min, 26 s.
Image Analysis
Preprocessing and definition of cortical and subcortical gray matter regions on structural images were conducted in the UCLA Laboratory of Neuro Imaging (LONI) Pipeline Processing Environment [Dinov et al.,2009; Rex et al.,2003,2004] and using FreeSurfer's automated brain segmentation software (FreeSurfer 4.0.5, http://surfer.nmr.mgh.harvard.edu), as described in the work of Fischl and Dale [Dale,1999; Fischl,1999; Fischl et al.,2002]. We obtained volume measurements of seven subcortical brain regions (thalamus, caudate, putamen, pallidum, hippocampus, amygdala, and ventral diencephalon, Fig. 1) as well as hemispheric measures of total brain, total cortical gray matter, and total white matter volumes. During preprocessing, high‐resolution T1‐weighted image acquisitions for each participant were motion corrected, brain extracted, and gray‐white matter boundaries were automatically delineated. A surface of connected white matter voxels was refined to create submillimeter voxel resolution in the gray‐white matter boundary [Dale,1999; Fischl,1999]. The gray‐white matter boundary was then deformed outward to estimate the pial surface with the following constraints: the surface needed to be smooth and maintain the natural topology of the brain.
Figure 1.
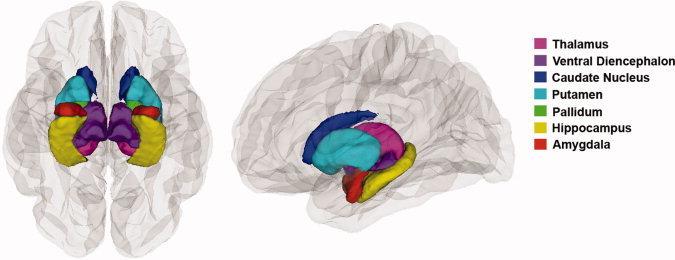
Subcortical regions of interest. Inferior view (left panel) and lateral view (right panel) of the brain, showing the seven subcortical regions for which we obtained volume measurements using FreeSurfer's automated brain segmentation software.
All subjects underwent quality‐control evaluations for the brain extraction step. Though the skull‐stripping was found adequate for most participants, some subjects (n = 3) who exhibited poor skull extractions were manually corrected and rerun through recon‐all. The skull‐stripping step was processed in Brainsuite's brain skull extractor (BSE) [Shattuck and Leahy,2002] and manually edited by an expert user. Then, the skull‐stripped image was inserted back into the Freesurfer processing stream. The recon‐all process was rerun with the “no‐skull‐strip” flag to skip the Freesurfer skull‐stripping step and accept the manually processed image instead. In addition, all subjects' pial and white matter surfaces were inspected for errors by a trained examiner. Errors were manually corrected by the manual editing steps defined on the automated segmentation software's troubleshooting webpage (http://surfer.nmr.mgh.harvard.edu/fswiki/FsTutorial/TroubleshootingData). Errors were mostly restricted to topological defects. These corrections were performed on about one fourth of all the subjects.
Total gray and white matter volumes were obtained using FreeSurfer's “mri_segstats ‐surf‐ctxgmwm” command. Cortical gray matter volume was defined as the volume between the pial and white surfaces. White matter volume was calculated by subtracting the subcortical and ventricular volumes from the volume bounded by the white matter surface (see Fig. 2). Volumes of the thalamus, ventral diencephalon, caudate, putamen, pallidum, hippocampus, amygdala, as well as total intracranial volume were calculated using FreeSurfer's automatic quantification of cortical and subcortical structures. Procedures are described in detail elsewhere [Fischl et al.,2002]. In summary, a neuroanatomical label was assigned to each voxel in an individual's structural MRI based on probabilistic information estimated from a manually labeled training set. This manually labeled training set is a result of validated methods from the Center of Morphometric Analysis (http://www.cma.mgh.harvard.edu). To disambiguate the overlap in intensities between different anatomical structures, FreeSurfer utilized spatial information. Two transformations were performed. First, an optimal linear transformation was carried out by maximizing the likelihood of the native image given a manually labeled atlas. Second, a nonlinear transformation was executed on the output of the prior registration step. Finally, a Bayesian parcellation was conducted by using prior spatial information [Desikan et al.,2006; Fischl et al.,2004]. At the end of this processing stream, three probabilities were calculated for each voxel: (1) the probability of the voxel belonging to each of the label classes, based on its location, (2) the neighborhood function, used to determine the likelihood that the voxels belong to a class, based on the classification of neighboring voxels, and (3) the result of the probability distribution function for each voxel based on its intensity.
Figure 2.
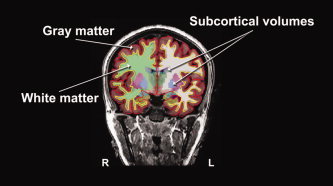
Calculation of cortical and subcortical volumes with FreeSurfer The pial surface, or gray matter surface (red outline) and the white matter surface (yellow outline) are shown, overlaid over the T1‐weighted image. The segmented cortical volumes are shown in shaded colors. Volumes of the seven subcortical structures of interest were calculated using FreeSurfer's automatic quantification of subcortical structures. Total gray matter volume was calculated by obtaining the volume between the gray and white matter surfaces. Total white matter volume was calculated by subtracting the subcortical and ventricular volumes from the volume bounded by the white matter surface.
The accuracy of this technique was shown to be similar to manual methods. The automated segmentations have been found to be statistically indistinguishable from manual labeling [Fischl et al.,2002], and correlations between FreeSurfer segmentation and manual labeling of hippocampal volume reached 0.85 in one study [Tae,2008]. Being completely automated, Freesurfer volume estimates are highly reliable. Nonetheless, in the current study, each brain image was visually inspected for validity of all regions by a single trained blind rater, and none of the segmentations were discarded.
Statistical Analysis of Demographic, Volumetric, Facial, and Performance Data
Statistical analyses were conducted using SYSTAT 12.0. For the demographic data, group differences in age and FSIQ were evaluated with independent two‐sample t‐tests, and differences in age and FSIQ between scan locations were assessed with one‐way analysis of variance (ANOVA). Group differences in gender were evaluated with Fisher's Exact Test of significance, and gender differences between sites were assessed with a Pearson Chi‐square test.
Within sites, group differences in regional brain volumes were evaluated by conducting separate independent two‐sample t‐tests. Across sites, group differences in regional brain volumes were evaluated in multiple regression analyses. The ability of group to predict the volumes of the brain regions of interest independent of site and age was investigated with simultaneous multiple regression analyses using the following equation: Volume = Constant + Group + Site + Age. We performed 18 simultaneous multiple regression analyses and subsequently used a conservative Bonferroni correction at the P = 0.05 level to control for multiple comparisons. The regional brain volume differences between groups that were significant at a level of P < 0.003 survived the Bonferroni correction. Then, to determine whether the results were mediated by overall brain volume (i.e., intracranial volume or ICV), we conducted simultaneous multiple regression analyses using the following equation: Volume = Constant + Group + Site + Age + ICV.
Relationships between regional brain volumes, measures of facial dysmorphology (PFL and philtrum lipometer), and intellectual functioning were assessed within the FASD and control groups separately using simple Pearson correlations. Subsequently, the effects of site, age, sex, and intracranial volume on these correlations were evaluated using multiple regression analyses. The ability of facial morphology or intellectual functioning data to predict the volumes of the subcortical brain regions that best differentiated exposed subjects from controls, independent of site, age, sex, and total brain volume, was investigated. We conducted simultaneous multiple regression analyses using the following equation: Volume = Constant + Facial or Performance Data + Site + Age + Sex + ICV. Of the 99 subjects who were studied with structural magnetic resonance imaging, 76 subjects (52 FASD and 24 CON) received a philtrum lipometer score and a PFL measurement, and were included in the facial dysmorphology correlational analyses. 92 (55 FASD and 37 CON) of the 99 participants were administered an IQ test and were included in the analyses of the relationships between subcortical volume reductions and neurocognitive functioning.
Relationships between quantitative measures of prenatal exposure in the SA sample, ICV, and regional brain volumes were assessed using simple Pearson correlations. Data about total number of drinks per week during each trimester and average number of drinks per occasion during each trimester were available for 17 of the 20 exposed participants in the SA sample. These 17 subjects were included in the analyses of the relationships between brain size and levels of prenatal alcohol exposure.
RESULTS
Demographics
Demographic descriptors are reported in Table I. Within scan locations, groups did not differ from each other in age or in gender distribution. Likewise, across sites, there were no significant differences between groups in age or gender. There were no significant differences in gender distribution between the three scan locations. However, the age of subjects differed between scan locations [F(2, 96) = 18.66], with the SA subjects being significantly older than both the LA (P < 0.001) and SD participants (P < 0.001). The LA and SD sites did not differ from each other in mean age.
Table I.
Demographics
| LA | FASD (n = 22) | CON (=12) | Group differences |
|---|---|---|---|
| Age at scanning | 12.21 (2.17) | 12.74 (2.62) | None |
| Female/Male | 11/11 | 5/7 | None |
| FSIQ | 91.05 (16.65) | 112.58 (14.26) | CON>FASD, P = 0.001 |
| SA | FASD (n = 20) | CON (n = 12) | Group differences |
| Age at scanning | 14.37 (0.49) | 14.12 (0.22) | None |
| Female/Male | 9/11 | 5/7 | None |
| FSIQ | 57.25 (10.61) | 66.67 (9.43) | CON>FASD, P = 0.017 |
| SD | FASD (n = 14) | CON (n = 19) | Group differences |
| Age at scanning | 12.19 (1.07) | 12.04 (1.36) | None |
| Female/Male | 3/11 | 7/12 | None |
| FASD (n = 13) | CON (=13) | Group differences | |
| FSIQ | 90.54 (12.59) | 106.08 (15.10) | CON>FASD, P = 0.009 |
| Across sites | FASD (n = 56) | CON (n = 43) | Group differences |
| Age at scanning | 12.97 (1.81) | 12.82 (1.83) | None |
| Female/Male | 23/33 | 17/26 | None |
| FASD (n = 55) | CON (n = 37) | Group differences | |
| FSIQ | 78.63 (21.19) | 95.41 (24.09) | CON>FASD, P = 0.001 |
| Across groups | LA (n = 34) | SA (n = 32) | SD (n = 33) | Group differences |
|---|---|---|---|---|
| Age at scanning | 12.40 (2.32) | 14.27 (0.43) | 12.11 (1.23) | SA>LA |
| [F(2,96) = 18.66, | ||||
| P < 0.001]; | ||||
| SA> SD | ||||
| [F(2, 96) = 18.66, | ||||
| P < 0.001] | ||||
| Female/Male | 16/18 | 14/18 | 10/23 | None |
| LA (n = 34) | SA (n = 32) | SD (n = 26) | Group differences | |
| FSIQ | 98.65 (18.80) | 60.78 (11.05) | 98.31 (15.76) | SA< LA |
| [F(2,89) = 61.02, | ||||
| P < 0.001]; | ||||
| SA< SD | ||||
| [F(2, 89) = 61.02, | ||||
| P < 0.001] |
Values expressed as mean (SD).
Within scan locations and across sites, groups consistently differed from each other in FSIQ, with control subjects scoring significantly higher than participants with FASD (P = 0.001 in LA, P = 0.017 in SA, P = 0.009 in SD, and P = 0.001 across sites). In addition, subjects' FSIQ scores differed between scan locations [F(2, 89) = 61.02], with the SA subjects scoring significantly lower than both the LA (P < 0.001) and SD participants (P < 0.001). The LA and SD sites did not differ from each other in mean FSIQ. It is well described that children and adults from low socio‐economic status and developing country populations perform worse on cognitive tests normed in western populations. Thus, we would expect the SA cohort IQ's to be lower than the other sites. Nonetheless, within‐site group differences were significant in the SA cohort, and statistical analyses described below controlled for site, eliminating site‐specific variance in IQ scores.
Group Differences in Regional Brain Volumes
Within scan locations, we found significant volume reductions in the FASD group compared with the control group in almost all of the brain regions evaluated (Table II). When brain volume data were combined across sites, we observed a significant decrease in volume in all of the brain regions examined in exposed subjects compared to controls, and these differences remained highly significant (P < 0.001 to P = 0.018) even after correcting for scan location and age (Table III). The ability of group to predict the volumes of the brain regions of interest independent of site and age was investigated by performing 18 simultaneous multiple regression analyses. Using a stringent Bonferroni correction for multiple comparisons, at the P = 0.05 level, all the regional brain volume differences between groups remained significant (P < 0.003), except in the amygdala (Table III).
Table II.
Regional brain volume reductions in FASD (within sites): t (P)
| LA | SA | SD | |
|---|---|---|---|
| Left hemisphere | |||
| Total white matter volume | −3.494 (0.002) | −2.418 (0.022) | −2.291 (0.029) |
| Total cortical gray matter | −3.612 (0.001) | −3.271 (0.003) | −2.112 (0.043) |
| Thalamus | −2.818 (0.008) | −2.656 (0.013) | −2.683 (0.012) |
| Ventral diencephalon | −2.313 (0.029) | −2.331 (0.028) | −3.016 (0.005) |
| Caudate | −2.382 (0.025) | −2.384 (0.024) | −1.506 (0.143) |
| Putamen | −2.313 (0.031) | −1.665 (0.107) | −4.200 (<0.001) |
| Pallidum | −2.120 (0.045) | −2.965 (0.006) | −2.421 (0.023) |
| Hippocampus | −2.421 (0.021) | −2.971 (0.006) | −1.767 (0.087) |
| Amygdala | −0.879 (0.389) | −0.959 (0.346) | −2.714 (0.011) |
| Right hemisphere | |||
| Total white matter volume | −3.478 (0.002) | −2.392 (0.024) | −2.181 (0.037) |
| Total cortical gray matter | −3.766 (0.001) | −3.410 (0.002) | −2.022 (0.053) |
| Thalamus | −2.519 (0.018) | −2.452 (0.022) | −2.557 (0.016) |
| Ventral diencephalon | −2.004 (0.055) | −3.043 (0.005) | −2.347 (0.026) |
| Caudate | −2.654 (0.013) | −2.680 (0.012) | −1.640 (0.112) |
| Putamen | −2.242 (0.035) | −1.549 (0.132) | −3.714 (0.001) |
| Pallidum | −1.799 (0.082) | −3.019 (0.006) | −2.974 (0.006) |
| Hippocampus | −2.902 (0.007) | −2.682 (0.012) | −1.580 (0.126) |
| Amygdala | −2.018 (0.054) | −0.761 (0.453) | −1.707 (0.098) |
| Total intracranial volume (ICV) | −3.068 (0.006) | −2.575 (0.015) | −1.755 (0.091) |
t‐ and P‐values obtained from 57 separate 2‐sample t‐tests comparing regional brain volumes between control (CON) and exposed (FASD) subjects. Hypothesis testing was conducted for CON>FASD within scan locations: Los Angeles (LA), South Africa (SA), and San Diego (SD). Bold numbers represent t‐values. For p‐values in parentheses, regular numbers represent a significant difference (p < 0.05) between groups, italicized numbers represent a trend‐level difference (0.05 < p < 0.1), and underlined numbers represent an absence of significant differences between groups.
Table III.
Results of multiple regression analyses
| Group effects (CON>FASD) (Site and Age regressed out) | Group effects (CON>FASD) (Site, Age, and ICV regressed out) | PFL (FASD group) (Site, Age, Sex, and ICV regressed out) | Lipometer (FASD group) (Site, Age, Sex, and ICV regressed out) | FSIQ (FASD group) (Site, Age, Sex, and ICV regressed out) | |
|---|---|---|---|---|---|
| Left hemisphere | |||||
| Total white matter volume | a, b F‐ratio = 20.416 | cF‐ratio = 2.494 | |||
| P < 0.001 | P = 0.118 | ||||
| Total cortical gray matter | F‐ratio = 21.622 | F‐ratio = 4.253 | |||
| P < 0.001 | P = 0.042 | ||||
| Thalamus | F‐ratio = 19.508 | F‐ratio = 3.114 | F‐ratio = 2.448 | F‐ratio = 5.691 | |
| P < 0.001 | P = 0.081 | P = 0.125 | P = 0.021 | ||
| Ventral diencephalon | F‐ratio = 18.865 | F‐ratio = 3.330 | F‐ratio = 5.485 | F‐ratio = 1.722 | |
| P < 0.001 | P = 0.071 | P = 0.024 | P = 0.196 | ||
| Caudate | F‐ratio = 12.144 | F‐ratio = 1.631 | F‐ratio = 0.023 | F‐ratio = 0.278 | F‐ratio = 2.809 |
| P = 0.001 | P = 0.205 | P = 0.881 | P = 0.600 | P = 0.100 | |
| Putamen | F‐ratio = 20.513 | F‐ratio = 4.901 | F‐ratio = 0.505 | F‐ratio = 2.613 | F‐ratio = 5.316 |
| P < 0.001 | P = 0.029 | P = 0.481 | P = 0.113 | P = 0.025 | |
| Pallidum | F‐ratio = 18.125 | F‐ratio = 3.859 | F‐ratio = 6.780 | ||
| P < 0.001 | P = 0.052 | P = 0.012 | |||
| Hippocampus | F‐ratio = 13.113 | F‐ratio = 1.155 | |||
| P < 0.001 | P = 0.285 | ||||
| Amygdala | F‐ratio = 5.812 | F‐ratio = 0.015 | |||
| P = 0.018 | P = 0.904 | ||||
| Right Hemisphere | |||||
| Total white matter volume | F‐ratio = 19.535 | F‐ratio = 1.997 | |||
| P < 0.001 | P = 0.161 | ||||
| Total cortical gray matter | F‐ratio = 21.754 | F‐ratio = 4.219 | |||
| P < 0.001 | P = 0.043 | ||||
| Thalamus | F‐ratio = 17.782 | F‐ratio = 2.578 | F‐ratio = 4.445 | ||
| P < 0.001 | P = 0.112 | P = 0.041 | |||
| Ventral diencephalon | F‐ratio = 16.694 | F‐ratio = 2.478 | F‐ratio = 4.878 | ||
| P < 0.001 | P = 0.119 | P = 0.032 | |||
| Caudate | F‐ratio = 14.049 | F‐ratio = 2.653 | F‐ratio = 0.140 | F‐ratio = 0.095 | F‐ratio = 2.255 |
| P < 0.001 | P = 0.107 | P = 0.710 | P = 0.760 | P = 0.140 | |
| Putamen | F‐ratio = 16.204 | F‐ratio = 2.819 | F‐ratio = 3.995 | F‐ratio = 7.805 | |
| P < 0.001 | P = 0.097 | P = 0.052 | P = 0.007 | ||
| Pallidum | F‐ratio = 18.673 | F‐ratio = 4.371 | F‐ratio = 2.754 | F‐ratio = 1.287 | |
| P < 0.001 | P = 0.039 | P = 0.104 | P = 0.263 | ||
| Hippocampus | F‐ratio = 14.855 | F‐ratio = 1.546 | |||
| P < 0.001 | P = 0.217 | ||||
| Amygdala | F‐ratio = 6.128 | F‐ratio = 0.031 | |||
| P = 0.015 | P = 0.860 | ||||
In multiple regressions, F‐ratio is used to test the hypothesis that the slopes of the regression lines are 0. The F is large when the independent variable helps to explain the variation in the dependent variable, independently of the other explanatory variables that are regressed out. For instance, here we reject the hypothesis that the slope of the regression line is 0 (F‐ratio = 20.416, P < 0.001), meaning that there is a significant linear relation between total white matter volume and group, independent of age and site. Bold font represents significant results (P < 0.05), italicized numbers represent results significant at trend‐level (0.05 < P < 0.1).
In the first column, bold font represents results that remained significant (p < 0.003) after Bonferroni correction, and regular font represents results that did not pass the Bonferroni correction.
In columns 2–5, bold font represents significant results (P < 0.05), italicized numbers represent results significant at trend‐level (0.05 < P < 0.1), and numbers in regular font represent results that were not statistically significant.
Subjects with FASD had significantly (P = 0.001) smaller brains than controls, as assessed by reduced ICV (see Fig. 3). Thus, we conducted additional multiple regression analyses to determine whether these regional brain volume differences between groups were significant above and beyond overall reduction in brain size. After controlling for the decrease in overall ICV in the exposed population in addition to correcting for scan location and age, volume reductions in subjects with FASD compared to controls remained significant in some brain regions within the basal ganglia and diencephalon. However, in medial temporal lobe regions (hippocampus and amygdala) these differences were no longer significant after controlling for ICV reduction (see Fig. 4). Specifically, in the left hemisphere, volume reductions in exposed subjects \remained significant after controlling for ICV in total cortical gray matter (P = 0.042) and in the putamen (P = 0.029). In the right hemisphere, volume reductions remained significant after controlling for ICV in total cortical gray matter (P = 0.043) and in the pallidum (P = 0.039, Table III).
Figure 3.
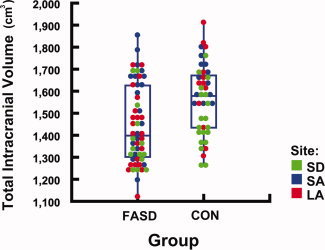
Reduced intracranial volume (ICV) in subjects with FASD Box plot illustrating the distribution of total ICV by group. Each circle represents one subject. Scan locations of subjects are coded with different colors. Across groups, subjects with FASD have significantly (P = 0.001) smaller ICV than controls.
Figure 4.
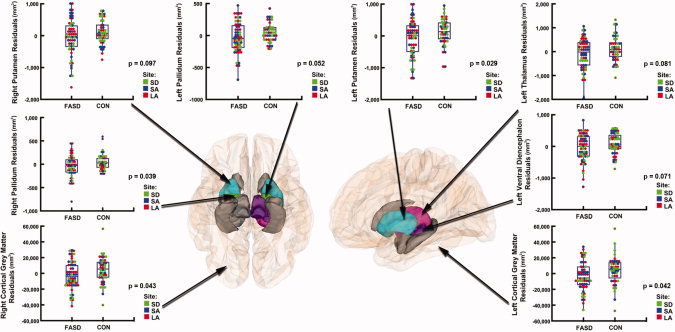
Group differences in regional brain volumes after controlling for scan location, age, and overall intracranial volume Inferior view (left panel) and lateral view (right panel) of the brain, showing the regions in which we observed volume reductions in subjects with FASD compared to controls. After controlling for site, age, and overall intracranial volume (ICV) reduction in the exposed population, areas in gray represent regions where group differences were no longer significant. Areas displayed in color represent regions where volume reductions in the FASD group remained significant (P < 0.05, in the left putamen, left total cortical gray matter, right pallidum, and right total cortical gray matter) or retained a trend‐level of significance (P < 0.1, in the left pallidum, left thalamus, left ventral diencephalon, and right putamen). Residual plots corresponding to each one of these regions are displayed on the side.
Relationships Between Brain Volume Reductions, Facial Dysmorphology, and Neurocognitive Function in the FASD Group
Following overall group effect analyses, we investigated relationships between the subcortical structures that significantly differentiated groups, facial dysmorphology, and overall intellectual functioning. Specifically, we examined correlations between the size of subcortical structures showing volume reductions that remained significant or retained a trend‐level of significance after controlling for overall ICV reductions in exposed subjects (basal ganglia and diencephalic structures), PFL, philtrum lipometer scores, and FSIQ. Within the FASD group (n = 52), simple correlational analyses revealed significant positive correlations between PFL and regional brain volumes in several subcortical structures. A shorter eye opening was significantly associated with smaller volumes in the left thalamus (r = 0.282, P = 0.042) and right caudate (r = 0.308, P = 0.026), and showed a trend‐level correlation with the volumes of other structures, notably the ventral diencephalon bilaterally (r = 0.260, P = 0.062 in the left hemisphere; r = 0.267, P = 0.056 in the right hemisphere).
We then performed multiple regression analyses to control for scan location, age, and total brain volume. We also introduced sex as an additional covariate, because although groups did not differ from each other in gender within or across sites, we wanted to eliminate any variance due to possible gender disparities within groups. After controlling for all these parameters, smaller PFL was significantly associated with smaller volumes in the left (P = 0.024) and right (P = 0.032) ventral diencephalon (Table III, Fig. 5).
Figure 5.
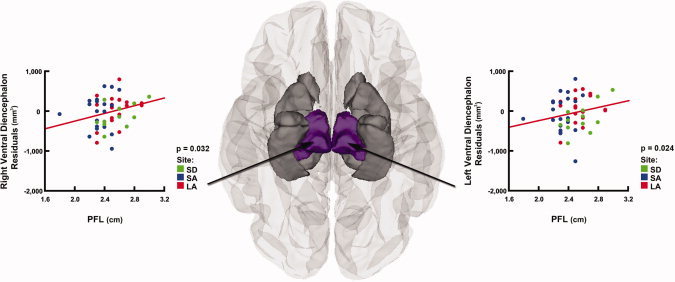
Relationships between brain volume reductions and palpebral fissure length (PFL) after controlling for scan location, age, sex, and ICV in subjects with FASD Inferior view of the brain, showing the regions in which smaller PFL was associated with smaller subcortical volumes in the FASD group (n = 52). After controlling for site, age, sex, and ICV in multiple regression analyses, areas in gray represent regions where this relationship was no loner significant. Areas displayed in color represent regions where these results remained significant (P < 0.05, in the left and right ventral diencephalon). Residual plots corresponding to these regions are displayed on the side.
Simple correlational analyses also revealed significant negative correlations between philtrum lipometer scores and regional brain volumes in the thalamus, putamen, and pallidum, within the FASD group (n = 52). More pronounced dysmorphology of the philtrum was significantly associated with smaller volumes in the left thalamus (r = −0.396, P = 0.004), right thalamus (r = −0.323, P = 0.019), left putamen (r = −0.404, P = 0.003), right putamen (r = −0.446, P = 0.001), and left pallidum (r = −0.302, P = 0.029).
After controlling for scan location, age, sex, and total brain volume in multiple regression analyses, higher philtrum lipometer scores were still significantly associated with smaller volumes in the left and right thalamus (P = 0.021 and P = 0.041, respectively) and in the left pallidum (P = 0.012, Table III, Fig. 6). In the exposed group, we also found a significant negative correlation between philtrum lipometer scores and PFL (r = −0.313, P = 0.024).
Figure 6.
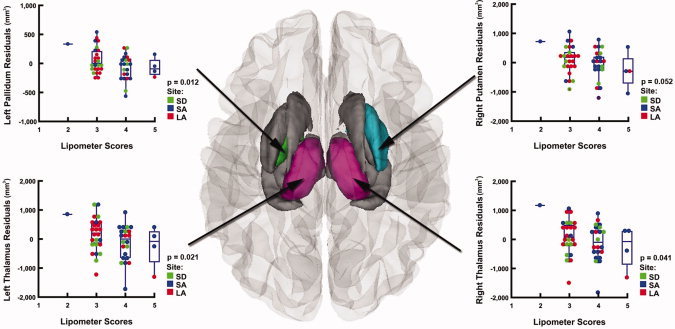
Relationships between brain volume reductions and philtrum lipometer scores after controlling for scan location, age, sex, and ICV in subjects with FASD Superior view of the brain, showing the regions in which more pronounced dysmorphology of the philtrum was associated with smaller subcortical volumes in the FASD group (n = 52). After controlling for site, age, sex, and ICV in multiple regression analyses, areas in gray represent regions where this relationship was no loner significant. Areas displayed in color represent regions where these results remained significant (P < 0.05, in the left pallidum and in the left and right thalamus), or retained a trend‐level of significance (P < 0.1, in the right putamen). Residual plots corresponding to each one of these regions are displayed on the side.
Analyses of the relationships between regional brain volumes and general intellectual functioning revealed significant positive correlations between FSIQ scores and the size of striatal structures, within the FASD group (n = 55). Higher FSIQ scores were associated with larger volumes in the right putamen (r = 0.427, P = 0.001), left putamen (r = 0.398, P = 0.003), and right caudate (r = 0.312, P = 0.020).
After controlling for scan location, age, sex, and total brain volume in multiple regression analyses, higher FSIQ scores were still significantly associated with larger volumes in the left and right putamen (P = 0.025 and P = 0.007, respectively, Table III, Fig. 7). In exposed subjects, we also found significant correlations between neurocognitive functioning and measures of facial dysmorphology, such that lower FSIQ scores were associated with higher philtrum lipometer scores (r = −0.448, P = 0.001) and smaller PFL (r = 0.433, P = 0.002).
Figure 7.
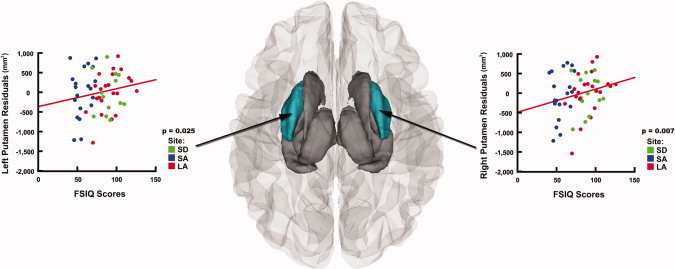
Relationships between brain volume reductions and neurocognitive function after controlling for scan location, age, sex, and ICV in subjects with FASD Superior view of the brain, showing the regions in which lower FSIQ scores were associated with smaller subcortical volumes in the FASD group (n = 55). After controlling for site, age, sex, and ICV in multiple regression analyses, areas in gray represent regions where this relationship was no loner significant. Areas displayed in color represent regions where these results remained significant (P < 0.05, in the left and right putamen). Residual plots corresponding to these regions are displayed on the side.
Relationships Between Brain Volume Reductions, Facial Dysmorphology, and Neurocognitive Function in Unexposed Controls
None of the correlations involving PFL (n = 24) were significant in the control group. Some of the simple correlations involving philtrum lipometer scores were significant in unexposed subjects (n = 24). Simple correlational analyses revealed significant negative correlations between philtrum lipometer scores and regional brain volumes in the left thalamus (r = −0.419, P = 0.041). However, these results were no longer significant after controlling for scan location, age, sex, and total brain volume in multiple regression analyses, although the left thalamus volume retained a trend‐level correlation with philtrum lipometer scores in the control group (P = 0.086).
Simple correlations seemed to suggest the existence of relationships between brain volumes in some basal ganglia regions and FSIQ scores in unexposed subjects (n = 37). FSIQ scores were positively correlated with left (r = 0.372, P = 0.023) and right (r = 0.328, P = 0.047) putamen volumes and negatively correlated with left (r = −0.347, P = 0.035) and right (r = −0.406, P = 0.013) pallidum volumes. However, none of these results remained significant after controlling for scan location, age, sex, and total brain volume in multiple regression analyses, although the right pallidum volume retained a trend‐level correlation with FSIQ scores in the control group (P = 0.077).
All statistical analyses of differences in regional brain volumes between groups and of relationships between brain volume reductions, facial dysmorphology, and neurocognitive function within groups were also conducted using a linear mixed effects model with a random intercept per site. The results (data not shown) were nearly identical to the results presented above, which were obtained with site included as a covariate in a regular linear model.
Relationships Between Brain Size and Quantitative Measures of Prenatal Alcohol Exposure in the South Africa Exposed Sample
Analyses of the relationship between overall brain size and quantitative measures of prenatal alcohol exposure in the SA subjects for whom such data were available (n = 17) revealed a significant negative correlation between ICV and total number of drinks per week in the first trimester (P = 0.014, r = −0.501, Fig. 8). Correlations between ICV and total number of drinks per week in the second and third trimesters, as well as between ICV and average number of drinks per occasion in all three trimesters, only showed a trend‐level significance (from P = 0.050 to P = 0.099). No significant correlations were found between regional brain volumes that best differentiated exposed from nonexposed groups (basal ganglia and diencephalic regions) and either quantitative measure of prenatal exposure. Nevertheless, the single, isolated significant quantitative drinking measure for the first trimester alone explains 25% of the variance in intracranial volume.
Figure 8.
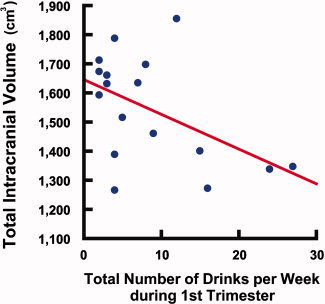
Correlation between total brain volume and level of prenatal alcohol exposure, in subjects from South Africa Scatter plot illustrating a significant negative correlation (P = 0.014, r = −0.501) between ICV and total number of drinks per week during the first trimester, in exposed subjects from SA. Each circle represents one subject (n = 17).
DISCUSSION
Although previous studies have documented specific physical diagnostic and dysmorphic features in children with FASD across different populations [May,2007; May et al.,2005,2006,2010], the current investigation represents the first neuroimaging report of brain dysmorphology associated with prenatal alcohol exposure across three independent samples, two within the US and one from South Africa. The pattern of brain volume reductions was highly similar at all three sites, and with the combined data, we show that greater facial dysmorphology, poorer intellectual functioning, and greater quantities of alcohol exposure in utero are associated with greater overall and regional brain volume reductions. For the first time in this report, we demonstrate that quantitative measures of specific hallmark features of facial dysmorphology are associated wirh specific brain structures in the basal ganglia and diencephalon, consistent with what would be expected given our understanding of concomitant face and brain development in utero documented in animal models. Further, we show for the first time that greater quantities of alcohol exposure, as measured by maternal report of the number of drinks consumed per week during the first trimester, are associated with greater brain volume reductions.
Consistent with our hypotheses, philtrum lipometer and PFL scores were each correlated more strongly with different brain structures. With respect to the lipometer score correlations, animal studies suggest that there is a very narrow developmental time window during which the defects of the upper midface that are characteristic of FAS (i.e., those involving the upper lip) can be induced by alcohol [Sulik,2005]. This time window encompasses early gastrulation stages, stages that occur on gestational day (GD) 7 in mice and in the mid‐third week of human development. In the mouse acute GD7 alcohol‐exposure FAS model, in addition to median facial dysmorphology, brain tissues derived from the ventro‐median forebrain are selectively diminished. Varying degrees of deficiency in the commissural plate, septal region and ganglionic eminences, all of which are derivatives of the telencephalon, occur in affected embryos [Godin et al.,2010; Schambra et al.,1990; Sulik,1984]. In turn, structures that normally arise within these regions of the brain are diminished in affected fetal and postnatal animals. Particularly noteworthy for the current investigation is that the ganglionic eminences are the source of tissues of the caudate, putamen, and pallidum and that it is the ventral medial ganglionic eminence (along with the dorsal preoptic area) that gives rise to the neurons of the pallidum [Flandin et al.,2010]. With insult to the median face and brain being concurrent, it would, thus, be expected that the philtral reductions would predict those in the pallidum. Additionally, higher philtrum lipometer scores would be expected to involve not only the pallidum, but also brain tissues that are derived from more lateral portions of the ganglionic eminences (i.e., striatal tissues) [Deacon et al.,1994]. Regarding the philtrum lipometer score correlations, it should also be noted that the basis for evaluating the philtrum is more qualitative in nature than other measurements of size or length, such as that of the PFL, and there is no evidence that philtrum lipometer ratings are in any way dependent on body or head size. Thus, it is striking that we would find such significant relationships between philtrum morphology on the lipometer scale and regional brain volumes within the FASD group.
With respect to PFL and ventral diencephalon correlations, the probable basis for this, too, can be understood by considering the embryogenesis of the involved structures. PFL is dependent on ocular globe size [Parnell et al.,2006]. Since ocular development is initiated in the tissues of the ventral diencephalon, it is not at all surprising that following insult at early developmental stages, ethanol‐mediated reductions in PFL and in the ventral diencephalon are concurrent. Animal studies indicate that microphthalmia can result from insult over a somewhat longer time frame in development than that for median upper midface deficiency. In mice, acute alcohol exposure at times corresponding to the mid third through at least the fourth week of human development are critical periods for the genesis of ocular deficiencies as would lead to reductions in PFL [Parnell et al.,2009].
In the control group, the findings indicate that most correlations between facial morphology and brain structure are most significantly linked with overall brain size than any particular region examined here. This suggests that the relationship between brain and face is stronger in exposed subjects. This might be expected given that these individuals were exposed to a teratogen that simultaneously affected the development of their face and forebrain. In the control group, the finding of trend‐level correlations between lipometer scores and left thalamus volume suggests the existence of more subtle associations between facial and brain morphology in unexposed subjects, which is not completely surprising. Since the forebrain and the face develop simultaneously in utero, we would not expect the relationship to be absent in controls. However, unlike in the FASD group, in control participants the relationship between the face and the brain probably does not impact cognition, because these subjects were not prenatally exposed to the damaging effects of alcohol.
We also found significant correlations between general intellectual functioning and regional brain volumes in the FASD group. In the exposed group, lower FSIQ scores were significantly associated with smaller volumes in the left and right putamen, even after controlling for scan location, age, sex, and total brain volume. In controls, however, relationships between brain volumes and FSIQ scores failed to remain significant after controlling for overall brain volume. These findings in the control group are consistent with the published literature. Although it appears that IQ is positively correlated with total brain volume and total gray matter volume in typically‐developing children [Reiss et al.,1996], a recent study using a very large sample of healthy children and adolescents showed no significant correlations between subcortical gray matter volumes and intellectual functioning [Lange et al.,2010]. In FASD subjects, our findings of negative correlations between bilateral putamen volumes and FSIQ scores suggest that brain structure–function relationships may be altered in the exposed group, consistent with our predictions. The results of our analyses of group differences in subcortical volumes show that the putamen is also one of the regions that best differentiate exposed and nonexposed subjects, especially in the left hemisphere. The putamen is involved in many forms of learning, in particular visual discrimination learning [Buerger et al.,1974], categorization learning [Ell et al.,2006; Seger et al.,2010], reinforcement learning, and implicit learning [Packard and Knowlton,2002]. Perhaps these structural abnormalities in the putamen in children with FASD play an important role in the numerous cognitive and behavioral impairments [Adnams et al.,2007; Aragon et al.,2008a,b] that affect children with heavy prenatal alcohol exposure.
While we did not have information about quantity and frequency of alcohol exposure for our LA and SD participants, our finding of a significant correlation between ICV and total number drinks per week during the first trimester in the exposed subjects from SA suggests that heavier maternal drinking is associated with smaller brain size. This is consistent with our predictions and with the findings of a behavioral study that included the same SA children who are neuroimaging subjects in this investigation [May et al.,2007,2008]. This finding also indicates that alcohol exposure during the first trimester may be more deleterious for brain size than exposure during later stages of pregnancy. The absence of significant correlations between amount of prenatal alcohol exposure and regional brain volumes suggests that heavier exposure may have more impact on overall brain size than on the size of particular structures. However, these are preliminary results in a small group of subjects, so future studies should aim at replicating these findings in larger samples of participants. Future investigations should also use a variety of quantitative measures of prenatal alcohol exposure, to investigate possible differential effects of various patterns of alcohol intake (e.g., weekend binge drinking versus daily heavy drinking) on brain development.
The small effect sizes of the differences between FASD and control groups presented in this report are not surprising given that the biomarkers of prenatal alcohol exposure are not diagnostic. To our knowledge, there has never been a study reporting an absence of overlap between groups on any biomarker. Nevertheless, the differences reported here are statistically significant, and appear to be clinically significant as well because these subtle changes are correlated with intellectual functioning in the exposed group.
There are some limitations to this study that should be taken into account when interpreting the results. First, for many of our participants, especially those in LA and SD, precise data about polydrug exposure were unavailable. Thus, we were unable to regress out the variance associated with possible concurrent exposure to other drugs of abuse, in an attempt to isolate the effects of alcohol. Of particular concern here is nicotine exposure. Nicotine has been shown to induce lasting abnormalities in neurogenesis in animal models [Slotkin,1998], and many women who abuse alcohol also smoke [Falk et al.,2006]. Although prenatal nicotine exposure was well documented for the SA sample [May et al.,2008], maternal smoking history was unavailable for most participants in this study, so we were unable to add prenatal nicotine exposure as a covariate in our analyses. However, though we cannot exclude the possibility that nicotine exposure could contribute partly to the differences between exposed and nonexposed groups reported here, many well‐controlled animal studies of prenatal alcohol exposure have demonstrated that ethanol is sufficient to induce both lasting structural brain abnormalities and facial dysmorphology in the absence of any concurrent exposure to nicotine [Sulik,2005].
Another limitation to this study is that precise alcohol exposure histories, including timing and dosages, were unavailable for more than two‐thirds of our subjects, many of whom had been adopted. This limitation is common to most retrospective human studies of prenatal alcohol and drug exposure as many research subjects recruited are in foster or adoptive placement and therefore access to the mother is limited, detailed reporting of alcohol is commonly avoided by maternal respondents, and this problem may be compounded by the stigma of admitting to drinking during pregnancy [Hannigan et al.,2009]. Future studies should, therefore, focus on obtaining substantially more detailed maternal drinking information on the quantity, frequency, and timing of prenatal alcohol exposure.
In addition, there were significant differences in participant populations across study sites, and we cannot exclude the possibility that such differences may have impacted our results. The children in Cape Town, South Africa were significantly older, had significantly lower FSIQ scores, and were ethnically homogeneous (Cape Colored) relative to the US samples. Further, the proportion of children with facial dysmorphology and growth deficiency consistent with the full FAS diagnosis was higher in SA than either in the LA or SD samples. However, we attempted to control for this variance in our analyses by statistically controlling for age and scan location in combined site analyses. The fact that we found similar patterns of group differences in brain structure in our analyses within and across sites suggests that the group differences reported in this study were probably not due to major differences between participant populations across scan locations, but instead reflected the effects of prenatal alcohol exposure. This is consistent with what has recently been reported about the physical features of FASD. Although there is some minor variation in structural traits found among affected children across populations, specific common features have been found and documented to have resulted from the teratogenic effects of alcohol [May et al.,2010].
Finally, it should be noted that recent evidence suggests that the scan–rescan reliability of automated segmentation algorithms for measuring subcortical regions varies across brain regions, with some structures showing higher reliability than others [Morey et al.,2010]. Thus, we cannot exclude the possibility that such differences in reliability of measurement could have impacted the regional specificity of our findings. Nonetheless, given that the results support our a priori hypotheses, and given that some of our hypotheses were generated based on well‐controlled animal studies, it is likely that the findings we report here have more to do with the specificity of various structures than with differences in reliability of measurement.
Despite some limitations, this study offers important contributions to the study of FASD. By examining relationships between structural brain abnormalities, facial dysmorphology, and cognitive functioning in children with FASD, it represents progress toward an important goal of the Collaborative Initiative on Fetal Alcohol Spectrum Disorders (CIFASD). Establishing such correlations between particular facial features and structural brain abnormalities in humans is important because it should ultimately enable clinicians to gain insight into what parts of the nervous system may be particularly affected simply by examining the face of patients with FASD. The reported correlations between regional brain volume reductions, facial abnormalities, and intellectual functioning attest to the cognitive significance of the brain dysmorphology, and to the clinical significance of facial abnormalities in FASD. More specifically, these findings represent the first report that direct measurements of facial morphology may portend the extent of brain dysmorphology and overall intellectual function in humans with heavy prenatal alcohol exposure.
Acknowledgements
The authors acknowledge the efforts in data collection of Suzanne Houston, Ariel Starr, and Genevieve Rodriguez in Los Angeles; Tania Badenhorst, Dominique Brand, Claire Corbett, Gosia Lapinska, and Karen Van Eden in Cape Town, South Africa; and Andria Norman, Jessica O'Brien, Kristina Hubbard, and Delilah Bolo in San Diego. The authors also thank Eric Kan and Carly Rosso for technical assistance.
REFERENCES
- Adnams CM, Kodituwakku PW, Hay A, Molteno CD, Viljoen D, May PA ( 2001): Patterns of cognitive‐motor development in children with fetal alcohol syndrome from a community in South Africa. Alcohol Clin Exp Res 25: 557–562. [PubMed] [Google Scholar]
- Adnams CM, Sorour P, Kalberg WO, Kodituwakku P, Perold MD, Kotze A, September S, Castle B, Gossage J, May PA ( 2007): Language and literacy outcomes from a pilot intervention study for children with fetal alcohol spectrum disorders in South Africa. Alcohol 41: 403–414. [DOI] [PMC free article] [PubMed] [Google Scholar]
- Aragon AS, Coriale G, Fiorentino D, Kalberg WO, Buckley D, Gossage JP, Ceccanti M, Mitchell ER, May PA ( 2008a): Neuropsychological characteristics of Italian children with fetal alcohol spectrum disorders. Alcohol Clin Exp Res 32: 1909–1919. [DOI] [PMC free article] [PubMed] [Google Scholar]
- Aragon AS, Kalberg WO, Buckley D, Barela‐Scott LM, Tabachnick BG, May PA ( 2008b): Neuropsychological study of FASD in a sample of American Indian children: processing simple versus complex information. Alcohol Clin Exp Res 32: 2136–2148. [DOI] [PMC free article] [PubMed] [Google Scholar]
- Archibald SL, Fennema‐Notestine C, Gamst A, Riley EP, Mattson SN, Jernigan TL ( 2001): Brain dysmorphology in individuals with severe prenatal alcohol exposure. Dev Med Child Neurol 43: 148–154. [PubMed] [Google Scholar]
- Astley SJ, Clarren SK ( 2000): Diagnosing the full spectrum of fetal alcohol‐exposed individuals: Introducing the 4‐digit diagnostic code. Alcohol Alcohol 35: 400–410. [DOI] [PubMed] [Google Scholar]
- Astley SJ, Clarren SK ( 2001): Measuring the facial phenotype of individuals with prenatal alcohol exposure: Correlations with brain dysfunction. Alcohol Alcohol 36: 147–159. [DOI] [PubMed] [Google Scholar]
- Astley SJ, Magnuson SI, Omnell LM, Clarren SK ( 1999): Fetal alcohol syndrome: Changes in craniofacial form with age, cognition, and timing of ethanol exposure in the macaque. Teratology 59: 163–172. [DOI] [PubMed] [Google Scholar]
- Astley SJ, Aylward EH, Carmichael Olson H, Kerns K, Brooks A, Coggins TE, Davies J, Dorn S, Gendler B, Jirikowic T, Kraegel P, Maravilla K, Richards T. ( 2009a): Functional magnetic resonance imaging outcomes from a comprehensive magnetic resonance study of children with fetal alcohol spectrum disorders. J Neurodev Disord 1: 61–80. [DOI] [PMC free article] [PubMed] [Google Scholar]
- Astley SJ, Richards T, Aylward EH, Olson HC, Kerns K, Brooks A, Coggins TE, Davies J, Dorn S, Gendler B, Jirikowic T, Kraegel P, Maravilla K. ( 2009b): Magnetic resonance spectroscopy outcomes from a comprehensive magnetic resonance study of children with fetal alcohol spectrum disorders. Magn Reson Imaging 27: 760–778. [DOI] [PMC free article] [PubMed] [Google Scholar]
- Astley SJ, Aylward EH, Olson HC, Kerns K, Brooks A, Coggins TE, Davies J, Dorn S, Gendler B, Jirikowic T, Kraegel P, Maravilla K, Richards T ( 2009c): Magnetic resonance imaging outcomes from a comprehensive magnetic resonance study of children with fetal alcohol spectrum disorders. Alcohol Clin Exp Res 33: 1671–1689. [DOI] [PMC free article] [PubMed] [Google Scholar]
- Bookstein FL, Sampson PD, Streissguth AP, Connor PD ( 2001): Geometric morphometrics of corpus callosum and subcortical structures in the fetal‐alcohol‐affected brain. Teratology 64: 4–32. [DOI] [PubMed] [Google Scholar]
- Buerger AA, Gross CG, Rocha‐Miranda CE ( 1974): Effects of ventral putamen lesions on discrimination learning by monkeys. J Comp Physiol Psychol 86: 440–446. [DOI] [PubMed] [Google Scholar]
- Burden MJ, Jacobson SW, Jacobson JL ( 2005): Relation of prenatal alcohol exposure to cognitive processing speed and efficiency in childhood. Alcohol Clin Exp Res 29: 1473–1483. [DOI] [PubMed] [Google Scholar]
- Cortese BM, Moore GJ, Bailey BA, Jacobson SW, Delaney‐Black V, Hannigan JH ( 2006): Magnetic resonance and spectroscopic imaging in prenatal alcohol‐exposed children: preliminary findings in the caudate nucleus. Neurotoxicol Teratol 28: 597–606. [DOI] [PubMed] [Google Scholar]
- Dale AM, Fischl B, Sereno MI ( 1999): Cortical surface‐based analysis. I. Segmentation and surface reconstruction. NeuroImage 9: 179–194. [DOI] [PubMed] [Google Scholar]
- Deacon TW, Pakzaban P, Isacson O ( 1994): The lateral ganglionic eminence is the origin of cells committed to striatal phenotypes: Neural transplantation and developmental evidence. Brain Res 668: 211–219. [DOI] [PubMed] [Google Scholar]
- Desikan RS, Segonne F, Fischl B, Quinn BT, Dickerson BC, Blacker D, Buckner RL, Dale AM, Maguire RP, Hyman BT, Albert MS, Killiany RJ. ( 2006): An automated labeling system for subdividing the human cerebral cortex on MRI scans into gyral based regions of interest. Neuroimage 31: 968–980. [DOI] [PubMed] [Google Scholar]
- Dinov ID, Van Horn JD, Lozev KM, Magsipoc R, Petrosyan P, Liu Z, Mackenzie‐Graham A, Eggert P, Parker DS, Toga AW ( 2009): Efficient, distributed and interactive neuroimaging data analysis using the LONI pipeline. Front Neuroinformatics 3: 22. [DOI] [PMC free article] [PubMed] [Google Scholar]
- Dodge NC, Jacobson JL, Molteno CD, Meintjes EM, Bangalore S, Diwadkar V, Hoyme EH, Robinson LK, Khaole N, Avison MJ, Jacobson SW. ( 2009): Prenatal alcohol exposure and interhemispheric transfer of tactile information: Detroit and Cape Town findings. Alcohol Clin Exp Res 33: 1628–1637. [DOI] [PMC free article] [PubMed] [Google Scholar]
- Ell SW, Marchant NL, Ivry RB ( 2006): Focal putamen lesions impair learning in rule‐based, but not information‐integration categorization tasks. Neuropsychologia 44: 1737–1751. [DOI] [PubMed] [Google Scholar]
- Fagerlund A, Heikkinen S, Autti‐Ramo I, Korkman M, Timonen M, Kuusi T, Riley EP, Lundbom N ( 2006): Brain metabolic alterations in adolescents and young adults with fetal alcohol spectrum disorders. Alcohol Clin Exp Res 30: 2097–2104. [DOI] [PubMed] [Google Scholar]
- Falk DE, Yi HY, Hiller‐Sturmhofel S ( 2006): An epidemiologic analysis of co‐occurring alcohol and tobacco use and disorders: findings from the National Epidemiologic Survey on alcohol and related conditions. Alcohol Res Health 29: 162–171. [PMC free article] [PubMed] [Google Scholar]
- Fischl B, Sereno MI, Dale AM. ( 1999): Cortical surface‐based analysis. II. Inflation, flattening, and a surface‐based coordinate system. NeuroImage 9: 195–207. [DOI] [PubMed] [Google Scholar]
- Fischl B, Salat DH, Busa E, Albert M, Dieterich M, Haselgrove C, van der Kouwe A, Killiany R, Kennedy D, Klaveness S, Montillo A, Makris N, Rosen B, Dale AM ( 2002): Whole brain segmentation: Automated labeling of neuroanatomical structures in the human brain. Neuron 33: 341–355. [DOI] [PubMed] [Google Scholar]
- Fischl B, van der Kouwe A, Destrieux C, Halgren E, Segonne F, Salat DH, Busa E, Seidman LJ, Goldstein J, Kennedy D, Caviness V, Makris N, Rosen B, Dale AM. ( 2004): Automatically parcellating the human cerebral cortex. Cereb Cortex 14: 11–22. [DOI] [PubMed] [Google Scholar]
- Flandin P, Kimura S, Rubenstein JL ( 2010): The progenitor zone of the ventral medial ganglionic eminence requires Nkx2‐1 to generate most of the globus pallidus but few neocortical interneurons. J Neurosci 30: 2812–2823. [DOI] [PMC free article] [PubMed] [Google Scholar]
- Fryer SL, Tapert SF, Mattson SN, Paulus MP, Spadoni AD, Riley EP ( 2007): Prenatal alcohol exposure affects frontal‐striatal BOLD response during inhibitory control. Alcohol Clin Exp Res 31: 1415–1424. [DOI] [PubMed] [Google Scholar]
- Fryer SL, Schweinsburg BC, Bjorkquist OA, Frank LR, Mattson SN, Spadoni AD, Riley EP ( 2009): Characterization of white matter microstructure in fetal alcohol spectrum disorders. Alcohol Clin Exp Res 33: 514–521. [DOI] [PMC free article] [PubMed] [Google Scholar]
- Godin EA, O'Leary‐Moore SK, Khan AA, Parnell SE, Ament JJ, Dehart DB, Johnson BW, Allan Johnson G, Styner MA, Sulik KK ( 2010): Magnetic resonance microscopy defines ethanol‐induced brain abnormalities in prenatal mice: Effects of acute insult on gestational day 7. Alcohol Clin Exp Res 34: 98–111. [DOI] [PMC free article] [PubMed] [Google Scholar]
- Hannigan JH, Chiodo LM, Sokol RJ, Janisse J, Ager JW, Greenwald MK, Delaney‐Black V ( 2009): A 14‐year retrospective maternal report of alcohol consumption in pregnancy predicts pregnancy and teen outcomes. Alcohol 44: 583–594. [DOI] [PMC free article] [PubMed] [Google Scholar]
- Hoyme HE, May PA, Kalberg WO, Kodituwakku P, Gossage JP, Trujillo PM, Buckley DG, Miller JH, Aragon AS, Khaole N, Viljoen DL, Jones KL, Robinson LK. ( 2005): A practical clinical approach to diagnosis of fetal alcohol spectrum disorders: Clarification of the 1996 institute of medicine criteria. Pediatrics 115: 39–47. [DOI] [PMC free article] [PubMed] [Google Scholar]
- Jernigan TL, Trauner DA, Hesselink JR, Tallal PA ( 1991): Maturation of human cerebrum observed in vivo during adolescence. Brain 114( Part 5): 2037–2049. [DOI] [PubMed] [Google Scholar]
- Jones KL, Smith DW ( 1973): Recognition of the fetal alcohol syndrome in early infancy. Lancet 302: 999–1001. [DOI] [PubMed] [Google Scholar]
- Jones KL, Smith DW ( 1975): The fetal alcohol syndrome. Teratology 12: 1–10. [DOI] [PubMed] [Google Scholar]
- Jones KL, Robinson LK, Bakhireva LN, Marintcheva G, Storojev V, Strahova A, Sergeevskaya S, Budantseva S, Mattson SN, Riley EP, Chambers CD ( 2006). Accuracy of the diagnosis of physical features of fetal alcohol syndrome by pediatricians after specialized training. Pediatrics 118: e1734–e1738. [DOI] [PubMed] [Google Scholar]
- Kodituwakku P, Coriale G, Fiorentino D, Aragon AS, Kalberg WO, Buckley D, Gossage JP, Ceccanti M, May PA ( 2006): Neurobehavioral characteristics of children with fetal alcohol spectrum disorders in communities from Italy: Preliminary results. Alcohol Clin Exp Res 30: 1551–1561. [DOI] [PubMed] [Google Scholar]
- Lange N, Froimowitz MP, Bigler ED, Lainhart JE ( 2010): Associations between IQ, total and regional brain volumes, and demography in a large normative sample of healthy children and adolescents. Dev Neuropsychol 35: 296–317. [DOI] [PMC free article] [PubMed] [Google Scholar]
- Lebel C, Rasmussen C, Wyper K, Andrew G, Beaulieu C ( 2010): Brain microstructure is related to math ability in children with fetal alcohol spectrum disorder. Alcohol Clin Exp Res 34: 354–363. [DOI] [PubMed] [Google Scholar]
- Lee KT, Mattson SN, Riley EP ( 2004): Classifying children with heavy prenatal alcohol exposure using measures of attention. J Int Neuropsychol Soc 10: 271–277. [DOI] [PubMed] [Google Scholar]
- Ma X, Coles CD, Lynch ME, Laconte SM, Zurkiya O, Wang D, Hu X ( 2005): Evaluation of corpus callosum anisotropy in young adults with fetal alcohol syndrome according to diffusion tensor imaging. Alcohol Clin Exp Res 29: 1214–1222. [DOI] [PubMed] [Google Scholar]
- Malisza KL, Allman AA, Shiloff D, Jakobson L, Longstaffe S, Chudley AE ( 2005): Evaluation of spatial working memory function in children and adults with fetal alcohol spectrum disorders: A functional magnetic resonance imaging study. Pediatr Res 58: 1150–1157. [DOI] [PubMed] [Google Scholar]
- Mattson SN, Riley EP ( 1998): A review of the neurobehavioral deficits in children with fetal alcohol syndrome or prenatal exposure to alcohol. Alcohol Clin Exp Res 22: 279–294. [DOI] [PubMed] [Google Scholar]
- Mattson SN, Roebuck TM ( 2002): Acquisition and retention of verbal and nonverbal information in children with heavy prenatal alcohol exposure. Alcohol Clin Exp Res 26: 875–882. [PubMed] [Google Scholar]
- Mattson SN, Riley EP, Sowell ER, Jernigan TL, Sobel DF, Jones KL ( 1996): A decrease in the size of the basal ganglia in children with fetal alcohol syndrome. Alcohol Clin Exp Res 20: 1088–1093. [DOI] [PubMed] [Google Scholar]
- Mattson SN, Riley EP, Gramling L, Delis DC, Jones KL ( 1997): Heavy prenatal alcohol exposure with or without physical features of fetal alcohol syndrome leads to IQ deficits. J Pediatr 131: 718–721. [DOI] [PubMed] [Google Scholar]
- Mattson SN, Riley EP, Gramling L, Delis DC, Jones KL ( 1998): Neuropsychological comparison of alcohol‐exposed children with or without physical features of fetal alcohol syndrome. Neuropsychology 12: 146–153. [DOI] [PubMed] [Google Scholar]
- Mattson SN, Goodman AM, Caine C, Delis DC, Riley EP ( 1999): Executive functioning in children with heavy prenatal alcohol exposure. Alcohol Clin Exp Res 23: 1808–1815. [PubMed] [Google Scholar]
- Mattson SN, Schoenfeld AM, Riley EP ( 2001): Teratogenic effects of alcohol on brain and behavior. Alcohol Res Health 25: 185–191. [PMC free article] [PubMed] [Google Scholar]
- Mattson SN, Calarco KE, Lang AR ( 2006): Focused and shifting attention in children with heavy prenatal alcohol exposure. Neuropsychology 20: 361–369. [DOI] [PMC free article] [PubMed] [Google Scholar]
- Mattson SN, Foroud T, Sowell ER, Jones KL, Coles CD, Fagerlund A, Autti‐Rämö I, May PA, Adnams CM, Konovalova V, Wetherill L, Arenson AD, Barnett WK, Riley EP; CIFASD ( 2010): Collaborative initiative on fetal alcohol spectrum disorders: Methodology of clinical projects. Alcohol 44: 635–641. [DOI] [PMC free article] [PubMed] [Google Scholar]
- May PA ( 2007): The epidemiology of fetal alcohol syndrome and partial FAS in a South‐African community. Drug Alcohol Depend 88: 259–271. [DOI] [PMC free article] [PubMed] [Google Scholar]
- May PA, Gossage JP, Brooke LE, Snell CL, Marais AS, Hendricks LS, Croxford JA, Viljoen DL ( 2005): Maternal risk factors for fetal alcohol syndrome in the Western cape province of South Africa: A population‐based study. Am J Public Health 95: 1190–1199. [DOI] [PMC free article] [PubMed] [Google Scholar]
- May PA, Fiorentino D, Phillip Gossage J, Kalberg WO, Eugene Hoyme H, Robinson LK, Coriale G, Jones KL, del Campo M, Tarani L, Romeo M, Kodituwakku PW, Deiana L, Buckley D, Ceccanti M ( 2006): Epidemiology of FASD in a province in Italy: Prevalence and characteristics of children in a random sample of schools. Alcohol Clin Exp Res 30: 1562–1575. [DOI] [PubMed] [Google Scholar]
- May PA, Gossage JP, Marais AS, Adnams CM, Hoyme HE, Jones KL, Robinson LK, Khaole NC, Snell C, Kalberg WO, Hendricks L, Brooke L, Stellavato C, Viljoen DL ( 2007): The epidemiology of fetal alcohol syndrome and partial FAS in a South African community. Drug Alcohol Depend 88: 259–271. [DOI] [PMC free article] [PubMed] [Google Scholar]
- May PA, Gossage JP, Marais AS, Hendricks LS, Snell CL, Tabachnick BG, Stellavato C, Buckley DG, Brooke LE, Viljoen DL ( 2008): Maternal risk factors for fetal alcohol syndrome and partial fetal alcohol syndrome in South Africa: A third study. Alcohol Clin Exp Res 32: 738–753. [DOI] [PubMed] [Google Scholar]
- May PA, Gossage JP, Smith M, Tabachnick BG, Robinson LK, Manning M, Cecanti M, Jones KL, Khaole N, Buckley D, Kalberg WO, Trujillo PM, Hoyme HE. ( 2010): Population differences in dysmorphic features among children with fetal alcohol spectrum disorders. J Dev Behav Pediatr 31: 304–316. [DOI] [PMC free article] [PubMed] [Google Scholar]
- Meintjes EM, Jacobson JL, Molteno CD, Gatenby JC, Warton C, Cannistraci CJ, Hoyme HE, Robinson LK, Khaole N, Gore JC, Jacobson SW. ( 2010): An fMRI study of number processing in children with fetal alcohol syndrome. Alcohol Clin Exp Res 34: 1450–1464. [DOI] [PubMed] [Google Scholar]
- Morey RA, Selgrade ES, Wagner HR II, Huettel SA, Wang L, McCarthy G ( 2010): Scan‐rescan reliability of subcortical brain volumes derived from automated segmentation. Hum Brain Mapp 31: 1751–1762. [DOI] [PMC free article] [PubMed] [Google Scholar]
- O'Connor MJ, Paley B ( 2006): The relationship of prenatal alcohol exposure and the postnatal environment to child depressive symptoms. J Pediatr Psychol 31: 50–64. [DOI] [PubMed] [Google Scholar]
- O'Hare ED, Kan E, Yoshii J, Mattson SN, Riley EP, Thompson PM, Toga AW, Sowell ER ( 2005): Mapping cerebellar vermal morphology and cognitive correlates in prenatal alcohol exposure. Neuroreport 16: 1285–1290. [DOI] [PubMed] [Google Scholar]
- O'Hare ED, Lu LH, Houston SM, Bookheimer SY, Mattson SN, O'Connor MJ, Sowell ER ( 2009): Altered frontal‐parietal functioning during verbal working memory in children and adolescents with heavy prenatal alcohol exposure. Hum Brain Mapp 30: 3200–3208. [DOI] [PMC free article] [PubMed] [Google Scholar]
- Packard MG, Knowlton BJ ( 2002): Learning and memory functions of the Basal Ganglia. Annu Rev Neurosci 25: 563–593. [DOI] [PubMed] [Google Scholar]
- Parnell SE, Dehart DB, Wills TA, Chen SY, Hodge CW, Besheer J, Waage‐Baudet HG, Charness ME, Sulik KK ( 2006): Maternal oral intake mouse model for fetal alcohol spectrum disorders: Ocular defects as a measure of effect. Alcohol Clin Exp Res 30: 1791–1798. [DOI] [PubMed] [Google Scholar]
- Parnell SE, O'Leary‐Moore SK, Godin EA, Dehart DB, Johnson BW, Allan Johnson G, Styner MA, Sulik KK ( 2009): Magnetic resonance microscopy defines ethanol‐induced brain abnormalities in prenatal mice: Effects of acute insult on gestational day 8. Alcohol Clin Exp Res 33: 1001–1011. [DOI] [PMC free article] [PubMed] [Google Scholar]
- Pollard I ( 2007): Neuropharmacology of drugs and alcohol in mother and fetus. Semin Fetal Neonatal Med 12: 106–113. [DOI] [PubMed] [Google Scholar]
- Reiss AL, Abrams MT, Singer HS, Ross JL, Denckla MB ( 1996): Brain development, gender and IQ in children. A volumetric imaging study. Brain 119 ( Part 5): 1763–1774. [DOI] [PubMed] [Google Scholar]
- Rex DE, Ma JQ, Toga AW ( 2003): The LONI pipeline processing environment. Neuroimage 19: 1033–1048. [DOI] [PubMed] [Google Scholar]
- Rex DE, Shattuck DW, Woods RP, Narr KL, Luders E, Rehm K, Stoltzner SE, Rottenberg DA, Toga AW ( 2004): A meta‐algorithm for brain extraction in MRI. Neuroimage 23: 625–637. [DOI] [PubMed] [Google Scholar]
- Riley EP, Mattson SN, Sowell ER, Jernigan TL, Sobel DF, Jones KL ( 1995): Abnormalities of the corpus callosum in children prenatally exposed to alcohol. Alcohol Clin Exp Res 19: 1198–1202. [DOI] [PubMed] [Google Scholar]
- Roebuck‐Spencer TM, Mattson SN, Marion SD, Brown WS, Riley EP ( 2004): Bimanual coordination in alcohol‐exposed children: Role of the corpus callosum. J Int Neuropsychol Soc 10: 536–548. [DOI] [PubMed] [Google Scholar]
- Schambra UB, Lauder JM, Petrusz P, Sulik KK ( 1990): Development of neurotransmitter systems in the mouse embryo following acute ethanol exposure: a histological and immunocytochemical study. Int J Dev Neurosci 8: 507–522. [DOI] [PubMed] [Google Scholar]
- Seger CA, Peterson EJ, Cincotta CM, Lopez‐Paniagua D, Anderson CW ( 2010): Dissociating the contributions of independent corticostriatal systems to visual categorization learning through the use of reinforcement learning modeling and Granger causality modeling. Neuroimage 50: 644–656. [DOI] [PMC free article] [PubMed] [Google Scholar]
- Shattuck DW, Leahy RM ( 2002): BrainSuite: An automated cortical surface identification tool. Med Image Anal 6: 129–142. [DOI] [PubMed] [Google Scholar]
- Slotkin TA ( 1998): Fetal nicotine or cocaine exposure: Which one is worse? J Pharmacol Exp Ther 285: 931–945. [PubMed] [Google Scholar]
- Sowell ER, Jernigan TL, Mattson SN, Riley EP, Sobel DF, Jones KL ( 1996): Abnormal development of the cerebellar vermis in children prenatally exposed to alcohol: size reduction in lobules I‐V. Alcohol Clin Exp Res 20: 31–34. [DOI] [PubMed] [Google Scholar]
- Sowell ER, Mattson SN, Thompson PM, Jernigan TL, Riley EP, Toga AW ( 2001a): Mapping callosal morphology and cognitive correlates: effects of heavy prenatal alcohol exposure. Neurology 57: 235–244. [DOI] [PubMed] [Google Scholar]
- Sowell ER, Thompson PM, Mattson SN, Tessner KD, Jernigan TL, Riley EP, Toga AW ( 2001b): Voxel‐based morphometric analyses of the brain in children and adolescents prenatally exposed to alcohol. Neuroreport 12: 515–523. [DOI] [PubMed] [Google Scholar]
- Sowell ER, Thompson PM, Mattson SN, Tessner KD, Jernigan TL, Riley EP, Toga AW ( 2002a): Regional brain shape abnormalities persist into adolescence after heavy prenatal alcohol exposure. Cerebral Cortex 12: 856–865. [DOI] [PubMed] [Google Scholar]
- Sowell ER, Thompson PM, Peterson BS, Mattson SN, Welcome SE, Henkenius AL, Riley EP, Jernigan TL, Toga AW ( 2002b): Mapping cortical gray matter asymmetry patterns in adolescents with heavy prenatal alcohol exposure. Neuroimage 17: 1807–1819. [DOI] [PubMed] [Google Scholar]
- Sowell ER, Trauner DA, Gamst A, Jernigan TL ( 2002c): Development of cortical and subcortical brain structures in childhood and adolescence: a structural MRI study. Dev Med Child Neurol 44: 4–16. [DOI] [PubMed] [Google Scholar]
- Sowell ER, Lu LH, O'Hare ED, McCourt ST, Mattson SN, O'Connor MJ, Bookheimer SY ( 2007): Functional magnetic resonance imaging of verbal learning in children with heavy prenatal alcohol exposure. Neuroreport 18: 635–639. [DOI] [PubMed] [Google Scholar]
- Sowell ER, Mattson SN, Kan E, Thompson PM, Riley EP, Toga AW ( 2008a): Abnormal cortical thickness and brain‐behavior correlation patterns in individuals with heavy prenatal alcohol exposure. Cereb Cortex 18: 136–144. [DOI] [PMC free article] [PubMed] [Google Scholar]
- Sowell ER, Johnson A, Kan E, Lu LH, Van Horn JD, Toga AW, O'Connor MJ, Bookheimer SY ( 2008b): Mapping white matter integrity and neurobehavioral correlates in children with fetal alcohol spectrum disorders. J Neurosci 28: 1313–1319. [DOI] [PMC free article] [PubMed] [Google Scholar]
- Sulik KK ( 1984): Critical periods for alcohol teratogenesis in mice, with special reference to the gastrulation stage of embryogenesis. Ciba Found Symp 105: 124–141. [DOI] [PubMed] [Google Scholar]
- Sulik KK ( 2005): Genesis of alcohol‐induced craniofacial dysmorphism. Exp Biol Med (Maywood) 230: 366–375. [DOI] [PubMed] [Google Scholar]
- Swayze VW II, Johnson VP, Hanson JW, Piven J, Sato Y, Giedd JN, Mosnik D, Andreasen NC ( 1997): Magnetic resonance imaging of brain anomalies in fetal alcohol syndrome. Pediatrics 99: 232–240. [DOI] [PubMed] [Google Scholar]
- Tae WS, Kim SS, Lee KU, Nam EC, Kim KW. ( 2008): Validation of hippocampal volumes measured using a manual method and two automated methods (FreeSurfer and IBASPM) in chronic major depressive disorder. Neuroradiology 50: 569–581. [DOI] [PubMed] [Google Scholar]
- Wechsler D ( 2003): The Wechsler Intelligence Scale for Children, 4th ed San Antonio, TX: The Psychological Corporation. [Google Scholar]
- Wozniak JR, Mueller BA, Chang PN, Muetzel RL, Caros L, Lim KO ( 2006): Diffusion tensor imaging in children with fetal alcohol spectrum disorders. Alcohol Clin Exp Res 30: 1799–1806. [DOI] [PMC free article] [PubMed] [Google Scholar]