

Abstract
Background
This longitudinal study of patients with diabetes examined the relationship between changes in depressive symptoms and changes in diabetes self-care behaviors over 5 years.
Design, Patients and Measurements
A total of 2759 patients with diabetes enrolled in a large HMO were followed over a 5-year period. Patients filled out a baseline mail survey and participated in a telephone interview 5 years later. Depression was measured with the Patient Health Questionnaire (PHQ-9) and diabetes self-care was measured with the Summary of Diabetes Self-Care Activities (SDSCA) questionnaire. Baseline and longitudinal evidence of diabetes and medical disease severity and complications were measured using ICD-9 and CPT codes and verified by chart review.
Results
At the 5-year follow-up, patients with diabetes with either persistent or worsening depressive symptoms compared to those in the no depression group had significantly fewer days per week of following a healthy diet or participating in ≥30 min of exercise. At 5-year follow-up, patients with clinical improvement in depression symptoms showed no differences compared to the no depression group on number of days per week of adherence to diet but showed deterioration in adherence to exercise on some, but not all, measures.
Conclusions
Patients with diabetes with persistent or worsening depressive symptoms over 5 years had significantly worse adherence to dietary and exercise regimens than patients in the no depression group. These results emphasize the need to further develop and test interventions to improve both quality of care for depression and self-care in diabetes patients.
Keywords: depression, behavior, health risk, symptom
Introduction
A recent meta-analysis showed that across 12 studies, patients with chronic medical illness and comorbid depression compared to those with medical illness alone had threefold greater rates of nonadherence to self-care regimens (DiMatteo et al., 2000). Depression may adversely affect self-care because of its effects on memory, energy, motivation, and self-efficacy (Katon, 2003). Medical illnesses that require the most time and energy to complete daily self-care may be most adversely affected by depression.
Compared to other chronic medical illnesses, diabetes self-care places significant demands on patients including dietary, exercise, glucose monitoring, and medication adherence requirements. Prior cross-sectional studies have shown that comorbid depression in patients with diabetes compared to patients with diabetes alone is associated with poor adherence to diet, exercise, and cessation of smoking (Lin et al., 2004). However, the cross-sectional nature of these data limits causal interpretation. While depression may lead to poor adherence to self-care activities such as exercise, some studies have shown that lack of exercise may also be associated with subsequent development of depression (Lampinen and Heikkinen, 2003). Moreover, lack of adherence to self-care may hasten onset of medical complications and functional decline, which may precipitate depression episodes (Prince et al., 1998). Longitudinal data may shed light on whether it is plausible to expect effective treatment of comorbid depression in patients with chronic medical illness to be followed by meaningful improvements in self-care regimens.
The purpose of this 5-year longitudinal study of patients with diabetes is to examine the association of changes in depressive symptoms with changes in diabetes self-care activities, including diet, exercise and smoking. We hypothesized that significant clinical improvements in depression symptoms would be associated with synchronous improvement in adherence to self-care regimens, whereas persistent or increasing depressive symptoms would be associated with continued poor or worsening adherence to self-care regimens.
Methods
Setting
Group Health (GH) is a mixed model prepaid health plan serving about 500 000 members in Washington State. Most GH patients receive medical services within the integrated group practice and nine GH primary care clinics were selected for this study. All study procedures were approved by institutional review boards at GH and University of Washington.
Study cohort selection
The original cohort for this longitudinal survey (Pathways Epidemiology Study) was sampled from adults ≥18 years of age from the GH diabetes registry who received care at any one of the nine study clinics between 2000–2002. The diabetes registry database includes all GH members meeting any of the following eligibility criteria in the prior 12 months: filled prescription for insulin or an oral hypoglycemic agent, two fasting glucose levels ≥126 mg/dl, two random plasma glucose levels ≥200 mg/dl, two outpatient diagnoses of diabetes, or any inpatient diagnosis of diabetes (McCulloch et al., 1998). Beginning in March 2001, surveys were mailed to 9063 potentially eligible patients, but 1222 patients were later found to be ineligible due to death, disenrollment, and erroneous diagnosis of diabetes or cognitive impairment. Among 7841 eligible patients, 4839 subjects (61.7% of eligible patients) returned the baseline questionnaire. All surviving patients (N = 4175) who did not request no further contact (N = 662 deaths, 2 requested no contact) were approached by the GH telephone survey team approximately 5 years after baseline questionnaire in order to complete a brief telephone interview.
Measurements
The Patient Health Questionnaire (PHQ-9) was used to screen for depression at both baseline and 5-year follow-up (Spitzer et al., 1999; Kroenke et al., 2001). The PHQ-9 diagnosis of major depression has been found to have an adequate sensitivity (73%) and high specificity (98%) in relation to a diagnosis of major depression based on structured interviews (Spitzer et al., 1999; Kroenke et al., 2001). A score of ≥10 has been recommended as the optimum cutoff for major depression (Kroenke et al., 2001).
We applied the optimum cutting score of 10 to screen for patients with clinically relevant depressive symptoms. We used two measures of depression: the depression score at baseline (defining groups as nondepressed for those with a PHQ-9 score of <10 and as having clinically significant depressive symptoms based on a PHQ-9 score of ≥10); and a measure of significant clinical change in depressive symptoms at 5-year follow-up. We defined clinically important changes in depression as a change of ≥5 points on the PHQ as recommended in the literature (Kroenke et al., 2001) and also based on the fact that 5 points on the PHQ was equal to approximately one standard deviation on this measure. Thus, we created four depression groups based on baseline and 5-year follow-up PHQ-9 scores, which we labeled as ‘no depression’ (<10 at baseline and <5 point increase in PHQ), ‘persistent depressive symptoms’ (≥10 at baseline and <5 point decrease in PHQ), ‘worsening depressive symptoms’ (<10 at baseline but ≥5 point increase in depressive symptoms), and ‘improving depressive symptoms’ (≥10 at baseline and ≥5 point decrease in depressive symptoms).
The baseline questionnaire included questions on age, sex, years of education, employment, race/ethnicity, marital status, height, and weight. Questions about clinical status included: age of onset, duration of diabetes, and type of treatment at onset. Baseline HbA1c level was derived from automated lab data with the HbA1c level closest in time to the return date of the screening questionnaire used. Automated pharmacy data regarding the use of oral hypoglycemic agents and insulin indicated the intensity of treatment. Exercise, diet, and smoking were measured at baseline and 5-year follow-up using the Summary of Diabetes Self-Care Activities (SDSCA) questionnaire, which has been showed to have high reliability and validity. Patients were asked to state the number of days in the past week (from 0 to 7) that they had:
followed a healthy eating plan
eaten ≥5 servings of fruits and vegetables,
eaten high fat foods such as red meat or whole-fat dairy products,
participated in ≥30 continuous minutes of physical activity
participated in ≥30 minutes of specific exercise session (i.e., swimming or biking) (Toobert et al., 2000).
Less than 2 days per week was chosen to indicate poor adherence to self-care because of data suggesting that at least 2 h per week of physical activity is needed for cardioprotection in patients with diabetes. (Hu et al., 2001).
To evaluate smoking, patients were asked:
Have you smoked a cigarette—even one puff in the last 7 days? (Yes or No).
If yes, how many cigarettes did you smoke on average in the last 7 days?
Patients were classified as having type 1 diabetes if onset was prior to 30 years of age, insulin was the first treatment prescribed, and they were currently taking insulin.
Computerized pharmacy records were used to compute a chronic disease score (RxRisk), a measure of medical comorbidity based on prescription drug use in the previous 12 months (Fishman et al., 2003). A measure using automated data was used to code for 7 types of diabetes complications present at baseline: retinopathy, neuropathy, nephropathy, cerebrovascular, cardiovascular, peripheral vascular, and metabolic (ketoacidosis, hyperosmolar coma) (Young et al., 2008). This diabetes complication measure has been shown to predict subsequent mortality and hospitalization rates (Young et al., 2008).
Evidence of macrovascular and microvascular complications and coronary procedures (coronary artery bypass surgery, angioplasty, or stent placement), cerebrovascular procedures (carotid endarterectomy), and peripheral vascular procedures (angioplasty or major vascular surgery of the aorta or peripheral vasculature) were identified both before baseline and during follow-up from automated medical records data using ICD-9 and CPT codes (American Medical Association, 2005). Macrovascular events including myocardial infarction, stroke, and peripheral vascular disease were verified by chart review. The specific codes and definitions for myocardial infarction, stroke, and coronary procedures were adopted from the Women’s Health Initiative study, with the addition of CPT codes that have come into use during the period of follow-up (Curb et al., 2003; Heckbert et al., 2004).
Statistical analyses
The analysis sample consisted of 2759 participants who completed the 5-year assessment, gave permission for their medical records to be abstracted and completed depression questionnaires at screening and 5-year follow-up (see Figure 1). Approximately 84% of the sample was ≥50 years of age. This group was compared to the rest of the eligible study sample (N = 1167) who were alive at the 5-year assessment, but who either did not give permission for their medical records to be reviewed, refused the telephone interview, were lost to follow-up, or had multiple missing items on the depression questionnaire.
Figure 1.
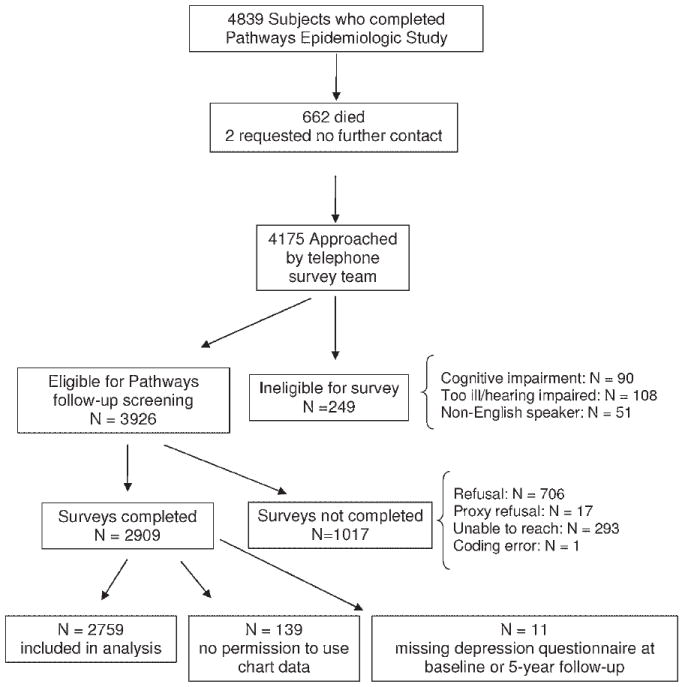
Description of patient recruitment
The four longitudinal depression groups were formed as described above and we then computed summary statistics for the depression groups using the PHQ-9. The four depression groups were compared on demographic and clinical characteristics using an analysis of variance for the continuous variables, and a χ2 analysis for the discrete measures. A priori, we partitioned the 3-degree of freedom group difference variance into 3 single degree of freedom contrasts, testing each of the depression groups against the ‘no depression’ reference group.
Descriptive means and standard deviations were generated for the health behavior variables at both assessments for each of the four depression groups, and individual analyses of covariance (ANCOVAs) were performed on each measure. For baseline measures, the covariates were age, gender, race, employment, education, marital status, macrovascular, and microvascular events before and after baseline, number of diabetes complications, RxRisk, HbA1c, insulin use, type 1 diabetes, and years with diabetes. For the analyses of the 5-year data, we also added the baseline value of the health behavior as a covariate.
In order to better understand the relationship between depression to changing behaviors over time, we first stratified individuals on the basis of their baseline self-care status into two groups: those ‘with’ and ‘without’ health promoting behaviors at the baseline assessment (van Gool et al., 2003). For each health behavior, subjects were stratified based on number of days per week that they reported the health behavior at baseline. These groups were analyzed separately using logistic regression analyses; those who endorsed 0–1 days were analyzed separately from those who endorsed 2–7 days a week of: healthy eating, ≥30 min of physical activity, ≥30 min of specific exercise, and eating ≥5 servings a day of fruits and vegetables at baseline. Current cigarette smoking was considered to be unhealthy, while not smoking was considered healthy. These analyses used the same set of covariates as described above (with the exception of baseline values).
For those in the ‘healthy groups’ (i.e., 2–7 days of healthy eating or exercising), we predicted the relative risk of worsening health behaviors (i.e., changing to 0–1 day), while for those in the ‘less healthy groups’ (0–1 day of healthy behaviors) we predicted the relative risk of persistent less than optimum health behaviors (remaining at 0–1 day). Due to the large proportion of individuals with some of the target outcomes (>10%) we used Poisson regressions to estimate the relative risk (RR) for each depression group in reference to the no depression group using robust estimation techniques in STATA. The RRs and their 95% confidence intervals have been shown to be better estimates than the odds ratios when the prevalence of the outcome is rather large (McNutt et al., 2003). For cigarette smoking, initiation (going from not smoking to smoking) or persistence (continued smoking) was predicted from the covariates and the longitudinal depression groups.
Results
Participants (n = 2759) were compared to those not completing the survey (n = 1017), not allowing use of automated data (n = 139) or missing the depression questionnaire at either baseline or 5-year follow-up (n = 11) (Figure 1). Participants included in this study did not differ from nonparticipants on gender (participants 49.2% female vs. nonparticipants 49.3% female) or baseline PHQ-9 score (participants 5.6 ± 5.5, nonparticipants 5.6 ± 5.7), but did significantly differ on age (participants 61.3 ± 12.4, nonparticipants 59.5 ± 13.6, t(3924) = 2.19, p < .03), years with diabetes (participants 9.0 ± 9.0, nonparticipants 8.2 ± 8.2, t(3924) = 2.60, p < .009), and race (participants 80.9% Caucasian, nonparticipants 67.0% Caucasian, X2(1) = 87.41, p < .001). The large sample size magnifies the small clinical differences found between participants and nonparticipants. Because the larger difference between participants and nonparticipants on race was more meaningful, race is included as a covariate in subsequent analysis.
Table 1 describes the initial PHQ-9 scores and 5-year follow-up PHQ-9 scores across the four subgroups of patients. We also analyzed the number of patients with a ≥10 at baseline who had a ≥5 point increase in their PHQ-9 score; there were only 16 patients meeting this criteria and they were included in the persistent depression group.
Table 1.
Mean and SD PHQ-9 scale scores at baseline and 5-year assessments
| Depression symptom group | Baseline PHQ | 5-Year PHQ | |
|---|---|---|---|
| No or few depressive symptoms (N = 1988) (≤10 PHQ-9 at baseline and <5 point increase at 5-year follow-up) | Mean | 3.3 | 2.5 |
| SD | 2.8 | 2.6 | |
| Improvement in depressive symptoms (N = 382) (≥10 PHQ-9 at baseline and ≥5 point decrease at 5-year follow-up) | Mean | 15.1 | 5.3 |
| SD | 4.3 | 4.0 | |
| Worsening of depressive symptoms (N = 214) (≤10 PHQ-9 at baseline and ≥5 point increase at 5-year follow-up) | Mean | 3.23 | 11.1 |
| SD | 2.58 | 4.0 | |
| Persistent depressive symptoms (N = 175) (≥10 PHQ-9 at baseline and <5 point decrease at 5-year follow-up) | Mean | 13.6 | 14.0 |
| SD | 3.7 | 4.7 | |
| Total sample (N =2759) | Mean | 5.6 | 4.3 |
| SD | 5.5 | 4.7 |
Table 2 describes that the four depression groups differed globally on all measures except for race/ethnicity, Rxrisk, microvascular events/procedures post-baseline, and macrovascular events pre-baseline. In general, the no depression group differed significantly from the improved depression and persistent depression groups, whereas the no depression and the worsening depression groups were generally similar in baseline characteristics. In comparison to those with no depression those with either improved depression or persistent depression were more likely to be women, married, younger, have Type II diabetes, have higher HbA1c levels, have more diabetes complications, have a higher likelihood of being treated with insulin, and had more microvascular events/procedures before baseline.
Table 2.
Baseline or pre-baseline characteristics of the depression groups
| Study variable | Depression groups | Test | No depression vs. improved depression | No depression vs. worsening depression | No depression vs. persistent depression | |||
|---|---|---|---|---|---|---|---|---|
|
| ||||||||
| No depression symptoms N = 1988 (72%) | Improved depression symptoms N = 382 (14%) | Worsening depression symptoms N = 214 (8%) | Persistent depression symptoms N = 175 (6%) | F(3, 2755) or X2(3) | ||||
| Baseline PHQ-9 | 3.3±2.8 | 15.1±4.3 | 3.23±2.58 | 13.6±3.7 | ||||
| % Men (N) | 54.3 (1079) | 38.5 (147) | 47.7 (102) | 42.3 (74) | 38.72*** | 31.38*** | 3.14 | 8.81** |
| % Non-White | 18.0 (357) | 21.8 (83) | 20.1 (43) | 21.7 (38) | 4.18 | N/A | N/A | N/A |
| % Unemployed | 51.1 (985) | 48.9 (181) | 60.5 (127) | 52.4 (89) | 7.95* | 0.49 | 6.35** | 0.10 |
| % High school grad or less | 18.6 (366) | 19.8 (75) | 24.9 (53) | 25.4 (44) | 8.82* | 0.24 | 4.54* | 4.41* |
| % Unmarried | 29.1 (574) | 36.2 (137) | 32.7 (70) | 37.4 (65) | 11.75** | 7.32** | 1.04 | 4.42* |
| Age–mean (SD) | 62.0 (12.2) | 57.4 (11.4) | 63.4 (13.8) | 58.4 (11.6) | 20.47*** | 7.12*** | 1.40 | 3.90*** |
| %Type I | 5.4 (107) | 2.4 (9) | 2.8 (6) | 6.9 (12) | 9.82* | 5.67* | 2.14 | 0.42 |
| Years with diabetes | 9.0 (9.2) | 8.3 (7.2) | 9.0 (8.6) | 10.6 (10.3) | 2.78* | NS | NS | P =.02 |
| HbA1c | 7.7 (1.5) | 8.0 (1.7) | 7.7 (1.6) | 8.1 (1.6) | 8.78*** | 3.74*** | 0.18 | 3.33*** |
| Number of complications (0–7) | 1.1 (1.1) | 1.3 (1.3) | 1.3 (1.2) | 1.3 (1.2) | 5.18*** | 3.13** | 1.49 | 2.24* |
| RxRisk | 2710.5 (2171.3) | 2613.8 (2112.4) | 3073.9 (2141.4) | 2696.4 (1998.9) | 2.26 | N/A | N/A | N/A |
| % Insulin use | 26.2 (520) | 35.1 (134) | 32.2 (69) | 37.7 (66) | 22.17*** | 12.32*** | 3.35 | 10.30*** |
| % At least 1 microvascular event/procedure pre-baseline | 60.7 (1206) | 67.3 (257) | 66.4 (142) | 70.3 (123) | 12.46** | 5.66* | 2.40 | 5.89** |
| % At least 1 microvascular event/procedure post-baseline | 34.0 (676) | 36.4 (139) | 31.3 (67) | 36.6 (64) | 2.07 | N/A | N/A | N/A |
| % At least 1 macrovascular event/procedure pre-baseline | 16.8 (334) | 19.4 (74) | 20.3 (43) | 17.2 (30) | 2.67 | N/A | N/A | N/A |
| % At least 1 macrovascular event/procedure post-baseline | 11.7 (233) | 13.1 (50) | 19.3 (41) | 11.5 (20) | 10.37* | 0.43 | 9.42** | 0.01 |
p < .01;
p < .001;
p < .0001
N/A = nonapplicable; NS = nonsignificant.
Based on the ANCOVAs, Table 3 demonstrates that the four depression groups had significant differences in the number of days with a healthy diet, number of days eating ≥5 servings of fruits and vegetables, number of days with ≥30 min of physical activity and ≥30 min of specific exercise at both baseline and at the 5-year follow-up after adjusting for the covariates.
Table 3.
Unadjusted means and standard deviations for the health behaviors at each assessment, and tests of difference in adjusted means
| Outcome variables | Total sample N = 2759 | No depression symptoms N = 1988 (72%) (1) |
Improved depression symptoms N = 382 (14%) (2) |
Worsening depression symptoms N = 214 (8%) (3) |
Persistent depression symptoms N = 175 (6%) (4) |
Global test of statistical significance F(3,2595) | Baselinea
|
5 Yearb
|
||||
|---|---|---|---|---|---|---|---|---|---|---|---|---|
| 1 vs. 2 | 1 vs.3 | 1 vs.4 | 1 vs.2 | 1 vs.3 | 1 vs.4 | |||||||
| Days with a healthy diet | *** | *** | *** | *** | ||||||||
| Baseline | 4.9 (1.9) | 4.9 (1.9) | 3.8 (2.0) | 4.9 (1.9) | 3.7 (2.2) | 32.94*** | ||||||
| 5 Year | 5.3 (1.7) | 5.4 (1.7) | 4.9 (1.9) | 4.6 (2.0) | 4.0 (2.1) | 22.10*** | ||||||
| Days eating fruits and vegetables of at least 5 servings | *** | *** | *** | |||||||||
| Baseline | 4.0 (2.4) | 4.2 (2.4) | 3.2 (2.4) | 4.0 (2.5) | 3.2 (2.5) | 15.74*** | ||||||
| 5 Year | 4.1 (2.6) | 4.2 (2.6) | 3.9 (2.5) | 3.5 (2.7) | 3.7 (2.7) | 6.71*** | ||||||
| Days eat high fat foods? | * | * | ||||||||||
| Baseline | 3.1 (1.9) | 3.0 (1.9) | 3.3 (1.9) | 3.0 (1.9) | 3.4 (2.0) | 2.75* | ||||||
| 5 Year | 2.7 (2.1) | 2.6 (2.1) | 2.6 (2.1) | 2.9 (2.2) | 2.8 (2.2) | 1.88 | ||||||
| Days of 30 + minutes of physical activity | ** | ** | ** | ** | ||||||||
| Baseline | 3.2 (2.3) | 3.5 (2.3) | 2.5 (2.2) | 3.2 (2.2) | 2.5 (2.2) | 15.87*** | ||||||
| 5 Year | 2.9 (2.5) | 3.1 (2.5) | 2.5 (2.5) | 2.3 (2.5) | 1.9 (2.2) | 8.78*** | ||||||
| Days with specific exercise session | *** | *** | *** | * | ||||||||
| Baseline | 2.3 (2.3) | 2.5 (2.4) | 1.7 (2.1) | 2.2 (2.4) | 1.4 (1.8) | 12.16*** | ||||||
| 5 Year | 2.1 (2.4) | 2.3 (2.5) | 1.8 (2.2) | 1.5 (2.2) | 1.4 (2.2) | 6.15*** | ||||||
| Smoking at 5 years - % (N) | ** | |||||||||||
| Baseline | 7.9% (217) | 6.5% (129) | 12.8% (49) | 9.3% (20) | 10.9% (19) | 3.46* | ||||||
| 5 Year | 6.6% (181) | 5.2% (104) | 11.0% (42) | 7.9% (17) | 10.3% (18) | 0.21 | ||||||
Covariates used: age, gender, race, employment, education, marital status, macro/micro events before and after Cohort Entry Date, # diabetes complications, Rx risk, HbA1c, insulin use, type 1 diabetes, years with diabetes.
Covariates same as a(baseline) + baseline outcome variable.
p <.01 ;
p <.001;
p <.0001.
At baseline, compared to the no depression group the improved depression group had significantly fewer mean days in the prior week of each of the four measures of healthy eating and exercise, significantly more days of eating high fat foods, and a significantly greater proportion of smokers (Table 3). At baseline, compared to the no depression group, the worsening depression group did not differ on any self-care measure and the persistent depression group had significantly fewer days in the prior week on the four measures of healthy eating and healthy exercise, but did not differ on the number of days of eating high fat food or the proportion of smokers.
At 5-year assessment, compared to the no depression group, those with improved depressive symptoms did not differ on any of the five dietary or exercise symptoms; those with worsening depressive symptoms had significantly fewer days on the four healthy eating and exercise measures and significantly more days of eating high fat foods; those with persistent symptoms had significantly fewer days eating a healthy diet and fewer days on the two exercise measures, but not on the number of days eating fruits and vegetables of at least 5 servings or on the number of days eating high fat foods (Table 3). No differences in the percent of patients who smoke were seen at the 5-year follow-up across the four depression groups.
Table 4 shows that patients with either worsening or persistent depressive symptoms were significantly more likely than the no depressive symptom group over the 5-year period to have a decrease from 2–7 days to 0–1 day in the prior week of: eating a healthy diet, doing ≥30 min of a specific physical continuous activity or ≥30 min of a specific exercise session (see Table 4). Compared to the no depression group, the subgroup with worsening depressive symptoms was also significantly more likely to have a decrease from 2–7 days to 0–1 day in the prior week of eating fruits and vegetables ≥5 times a day.
Table 4.
Relative risk (RR) ratios and 95% CI for the depression groups based on changes in health behaviorsa. All diet and exercise questions were dichotomized into poor (0–1 day) and good (2–7 days)
| 5 Year outcomes/outcome variables | Prevalence of 5-year outcome | No depression symptoms N = 1988 (72%) | Improved depression symptoms N = 382 (14%) | Worsening depression symptoms N = 214 (8%) | Persistent depression symptoms N = 175 (6%) |
|---|---|---|---|---|---|
| For those with a healthy diet at baseline (2–7 days, N = 2486): RR ratios of having your diet worsen at 5 years (0–1 day) | |||||
| 3.3% | Reference group | 1.60 (0.88–2.92) | 3.16*** (1.74–5.75) | 3.02*** (1.59–5.77) | |
| Fruits and vegetables of at least 5 servings a day (2-7 days, N = 2157): RR ratios of having your diet worsen (0-1 day) | |||||
| 17.0% | Reference group | 0.87 (0.64–1.20) | 1.67*** (1.25–2.22) | 1.12 (0.75– 1.69) | |
| Days of 30+ minutes of physical activity (2-7 days, N = 1987): RR ratios of decreasing activity (0-1 day) | |||||
| 27.4% | Reference group | 1.27* (1.03–1.57) | 1.65* (1.34–2.04) | 1.44** (1.09–1.91) | |
| Days of 30+ minutes of SPECIFIC physical activity (2-7 days, N = 1987): RR ratios of decreasing activity (0-1 day) | |||||
| 36% | Reference group | 1.24* (1.02–1.51) | 1.35** (1.08–1.68) | 1.50** (1.16–1.96) | |
| For those without healthy diet at baseline (0-1 day, N = 231): RR ratios of having your diet stay persistently poor (0-1 day) | |||||
| 18.9% | Reference group | 0.92 (0.45–1.90) | 1.16 (0.47–2.87) | 1.53 (0.69–3.38) | |
| Fruits and vegetables of at least 5 servings a day (0-1 day, N = 566): RR ratios of having your diet remain poor (0-1 day) | |||||
| 42.1% | Reference group | 1.03 (0.77–1.37) | 1.68*** (1.30–2.18) | 1.24 (0.89–1.71) | |
| Days of 30+ minutes of physical activity (0-1 day, N = 742): RR ratios of persistent lack of activity (0-1 day) | |||||
| 60.1% | Reference group | 1.03 (0.88–1.21) | 1.11 (0.90–1.36) | 1.28** (1.07–1.52) | |
| Days of 30+ minutes of SPECIFIC physical activity (0-1 day, N = 742): RR ratios of persistent lack of activity (0-1 day) | |||||
| 69.1% | Reference group | 0.96 (0.86–1.08) | 1.20*** (1.07–1.34) | 1.17** (1.05–1.30) | |
| RR ratios for smoking initiation for those who did not smoke at baseline (N = 2553) | |||||
| 1.6% | Reference group | 1.30 (0.54–3.14) | 2.47* (1.01–6.06) | 1.40 (0.42–4.72) | |
| RR ratios for smoking persistence for those who DID smoke at baseline (N = 217) | |||||
| 65% | Reference group | 1.03 (0.79–1.33) | .77 (0.50–1.19) | 0.96 (0.68–1.37) | |
Covariates used: age, gender, race, employment, education, marital status, macro/micro events before and after baseline, diabetes complications, Rxrisk, HbA1c, insulin use, type 1 diabetes, years with diabetes.
p <.01;
p <.001;
p <.0001.
Table 4 also describes that in patients who had very low initial levels of self-care, the subgroup with clinically important worsening depressive symptoms was significantly more likely than the subgroup with no depression to have remained at 0–1 day of eating at least 5 servings a day of fruits and vegetables as well as doing ≥30 min of a specific physical activity. The subgroup with persistently high levels of depressive symptoms was significantly more likely than the no depression group to have remained at 0–1 day of ≥30 min of either any physical activity or a specific physical exercise.
For the subgroup with improved depressive symptoms the only differences from the no depression group is that these patients were significantly more likely to have decreases in ≥30 min of physical activity and ≥30 min of specific exercise at 5-year follow-up.
Initiation of smoking was significantly related to worsening depression. There were no other significant changes in smoking associated with differences in course of depressive symptoms.
Discussion
Our 5-year data show that patients with persistent depressive symptoms or a clinically important increase in depressive symptoms had significantly more days in the previous week of not following recommended diabetes dietary or exercise regimens. Of the five dietary and exercise questions, those with worsening depressive symptoms had significantly fewer days of following all five of these regimens and those with persistent depressive symptoms had significantly fewer days of following three of the five regimens compared to participants with no or few depressive symptoms. Moreover, our 5-year data show that on the four dichotomous dietary and exercise outcomes, those with worsening depression were significantly more likely to go from 2–7 days to 0–1 days in the prior week of following recommended regimens on all four measures, and those with persistent depression on three of four measures.
Those with worsening depressive symptoms were also found to have a significantly higher risk of initiating smoking at the 5-year follow-up. This is of particular concern because smoking in patients with diabetes raises the risk of microvascular and macrovascular complications (Williams, 2003). Multiple studies have shown that depressed people are more likely to be smokers (John et al., 2004), to have a more difficult time quitting smoking (Anda et al., 1990) and that depressive symptom exacerbation is linked with restarting smoking (Hughes, 2007).
Fewer differences on dietary and exercise regimens were shown between those whose depressive symptoms improved over the 5-year period compared to those who had low levels of depressive symptoms over this period. Those with improved depressive symptoms had no significant differences at 5-year follow-up compared to the group with no depressive symptoms in the number of days in the prior week of following any of the five diabetes dietary or exercise regimens. On the dichotomous measures, those with improved depressive symptoms were significantly more likely than the no depression group to move from 2 to 7 days in the prior week to 0 to 1 day at 5-year follow-up on both exercise measures but not on the two dietary measures.
The poorer self-care associated with persistent or emergent depressive symptoms among patients with diabetes compared to the group with no depression supports the idea that health behaviors deteriorate over time in the presence of depressive symptoms. Our data in the group with improved depressive symptoms compared to the no depression group showed a consistent effect on lack of deterioration of adherence to dietary regimens, but a more inconsistent effect on decrease in adherence to exercise. Two studies of patients with comorbid depression and diabetes that tested collaborative care interventions to improve depressive outcomes showed no effect on improving dietary regimens and only one of the trials found a benefit on improving exercise self-care regimens (Williams et al., 2004; Lin et al., 2006). However, given the modest differences between depressed and nondepressed populations, it is apparent that these studies that have tested depression interventions to improve outcomes of patients with depression and comorbid diabetes were underpowered to compare the effect of the depression interventions on self-care activities (Williams et al., 2004; Lin et al., 2006). It is also possible that improvement in depressive symptoms alone is not sufficient to bring about changes in health behavior and that the ideal treatment for patients with diabetes and depression is to treat the depression and provide specific counseling for health behaviors.
The adverse effect of depression on self-care regimens in patients with diabetes may explain, in part, the results of recent longitudinal studies that have shown that comorbid depression in patients with type 2 diabetes is associated with increased macrovascular and microvascular complications (Black et al., 2003) and mortality rates (Black et al., 2003; Egede et al., 2005; Katon et al., 2005; Katon et al., 2008). Depression’s effect on the hypothalamic pituitary axis, sympathetic nervous system and inflammatory markers has also been posited as having an adverse impact on diabetes control, morbidity, and mortality.
Limitations of this study include the fact that the population was drawn from one large HMO in the Pacific Northwest limiting generalizability, only approximately 70% of the eligible population participated in this follow-up study and that initial and follow-up depression and self-care measurement occurred over a relatively long 5-year period with no interval measurement completed. The strengths of this study include the large sample size, the diversity of the population, the use of well-validated and reliable questionnaires, the use of automated data to control for severity of diabetes, comorbid medical illnesses and treatment intensity, and the ability to control for sociodemographic variables.
Conclusion
Patients with diabetes and persistent depressive symptoms or worsening depressive symptoms over a 5-year period were shown to have either sustained poor adherence or worsening adherence to diet and exercise regimens compared to patients with low levels of depressive symptoms.
Key points.
Patients with either persistent or worsening depressive symptoms compared to those in the no depression group had significantly fewer days per week of following a healthy diet or participating in ≥30 minutes of exercise at the 5-year follow-up.
Patients with clinical improvement in depression symptoms showed no differences compared to the no depression group on the number of days adherent to diet, but showed deterioration in adherence to exercise in some, but not all, measures.
Acknowledgments
This study was supported by grants from the National Institute of Mental Health to Dr Katon (K24 MH067587) and Dr Von Korff (MH 073686).
References
- American Medical Association. Current Procedural Terminology, CPT 2006. Professional Edition. American Medical Association; Chicago, IL: 2005. [Google Scholar]
- Anda RF, Williamson DF, Escobedo LG, et al. Depression and the dynamics of smoking. A national perspective. JAMA. 1990;264:1541–1545. [PubMed] [Google Scholar]
- Black SA, Markides KS, Ray LA. Depression predicts increased incidence of adverse health outcomes in older Mexican Americans with type 2 diabetes. Diabetes Care. 2003;26:2822–2828. doi: 10.2337/diacare.26.10.2822. [DOI] [PubMed] [Google Scholar]
- Curb JD, McTiernan A, Heckbert SR, et al. Outcomes ascertainment and adjudication methods in the Women’s Health Initiative. Ann Epidemiol. 2003;13:S122–S128. doi: 10.1016/s1047-2797(03)00048-6. [DOI] [PubMed] [Google Scholar]
- DiMatteo MR, Lepper HS, Croghan TW. Depression is a risk factor for noncompliance with medical treatment: meta-analysis of the effects of anxiety and depression on patient adherence. Arch Intern Med. 2000;160:2101–2107. doi: 10.1001/archinte.160.14.2101. [DOI] [PubMed] [Google Scholar]
- Egede LE, Nietert PJ, Zheng D. Depression and all-cause and coronary heart disease mortality among adults with and without diabetes. Diabetes Care. 2005;28:1339–1345. doi: 10.2337/diacare.28.6.1339. [DOI] [PubMed] [Google Scholar]
- Fishman PA, Goodman MJ, Hornbrook MC, et al. Risk adjustment using automated ambulatory pharmacy data: the RxRisk model. Med Care. 2003;41:84–99. doi: 10.1097/00005650-200301000-00011. [DOI] [PubMed] [Google Scholar]
- Heckbert SR, Kooperberg C, Safford MM, et al. Comparison of self-report, hospital discharge codes, and adjudication of cardiovascular events in the Women’s Health Initiative. Am J Epidemiol. 2004;160:1152–1158. doi: 10.1093/aje/kwh314. [DOI] [PubMed] [Google Scholar]
- Hu FB, Stampfer MJ, Solomon C, et al. Physical activity and risk for cardiovascular events in diabetic women. Ann Intern Med. 2001;134:96–105. doi: 10.7326/0003-4819-134-2-200101160-00009. [DOI] [PubMed] [Google Scholar]
- Hughes JR. Depression during tobacco abstinence. Nicotine Tob Res. 2007;9:443–446. doi: 10.1080/14622200701243185. [DOI] [PubMed] [Google Scholar]
- John U, Meyer C, Rumpf HJ, et al. Depressive disorders are related to nicotine dependence in the population but do not necessarily hamper smoking cessation. J Clin Psychiatry. 2004;65:169–176. doi: 10.4088/jcp.v65n0205. [DOI] [PubMed] [Google Scholar]
- Katon W, Fan MY, Unutzer J, et al. Depression and diabetes: a potentially lethal combination. J Gen Intern Med. 2008;23:1571–1575. doi: 10.1007/s11606-008-0731-9. [DOI] [PMC free article] [PubMed] [Google Scholar]
- Katon WJ. Clinical and health services relationships between major depression, depressive symptoms, and general medical illness. Biol Psychiatry. 2003;54:216–226. doi: 10.1016/s0006-3223(03)00273-7. [DOI] [PubMed] [Google Scholar]
- Katon WJ, Rutter C, Simon G, et al. The association of comorbid depression with mortality in patients with type 2 diabetes. Diabetes Care. 2005;28:2668–2672. doi: 10.2337/diacare.28.11.2668. [DOI] [PubMed] [Google Scholar]
- Kroenke K, Spitzer RL, Williams JB. The PHQ-9: validity of a brief depression severity measure. J Gen Intern Med. 2001;16:606–613. doi: 10.1046/j.1525-1497.2001.016009606.x. [DOI] [PMC free article] [PubMed] [Google Scholar]
- Lampinen P, Heikkinen E. Reduced mobility and physical activity as predictors of depressive symptoms among community-dwelling older adults: an eight-year follow-up study. Aging Clin Exp Res. 2003;15:205–211. doi: 10.1007/BF03324501. [DOI] [PubMed] [Google Scholar]
- Lin EHB, Katon W, Rutter C, et al. Effects of enhanced depression treatment on diabetes self-care. Ann Fam Med. 2006;4:46–53. doi: 10.1370/afm.423. [DOI] [PMC free article] [PubMed] [Google Scholar]
- Lin EH, Katon W, Von Korff M, et al. Relationship of depression and diabetes self-care, medication adherence, and preventive care. Diabetes Care. 2004;27:2154–2160. doi: 10.2337/diacare.27.9.2154. [DOI] [PubMed] [Google Scholar]
- McCulloch DK, Price MJ, Hindmarsh M, et al. A population-based approach to diabetes management in a primary care setting: early results and lessons learned. Eff Clin Pract. 1998;1:12–22. [PubMed] [Google Scholar]
- McNutt LA, Wu C, Xue X, et al. Estimating the relative risk in cohort studies and clinical trials of common outcomes. Am J Epidemiol. 2003;157:940–943. doi: 10.1093/aje/kwg074. [DOI] [PubMed] [Google Scholar]
- Prince MJ, Harwood RH, Thomas A, et al. A prospective population-based cohort study of the effects of disablement and social milieu on the onset and maintenance of late-life depression. The Gospel Oak Project VII. Psychol Med. 1998;28:337–350. doi: 10.1017/s0033291797006478. [DOI] [PubMed] [Google Scholar]
- Spitzer RL, Kroenke K, Williams JB. Validation and utility of a self-report version of PRIME-MD: the PHQ primary care study. Primary care evaluation of mental disorders. Patient health questionnaire. JAMA. 1999;282:1737–1744. doi: 10.1001/jama.282.18.1737. [DOI] [PubMed] [Google Scholar]
- Toobert DJ, Hampson SE, Glasgow RE. The summary of diabetes self-care activities measure: results from 7 studies and a revised scale. Diabetes Care. 2000;23:943–950. doi: 10.2337/diacare.23.7.943. [DOI] [PubMed] [Google Scholar]
- van Gool C, Kempen G, Penninx B, et al. Relationship between changes in depressive symptoms and unhealthy lifestyles in late middle aged and older persons: results from the longitudinal agine study Amsterdam. Age Aging. 2003;32:81–87. doi: 10.1093/ageing/32.1.81. [DOI] [PubMed] [Google Scholar]
- Williams G. Disorders of glucose homeosteris. In: Warrel D, Cox T, Firth J, Benz EJ Jr, editors. Oxford Textbook of Medicine. Vol. 2. Oxford University Press; New York: 2003. pp. 317–360. [Google Scholar]
- Williams JW, Jr, Katon W, Lin EH, et al. The effectiveness of depression care management on diabetes-related outcomes in older patients. Ann Intern Med. 2004;140:1015–1024. doi: 10.7326/0003-4819-140-12-200406150-00012. [DOI] [PubMed] [Google Scholar]
- Young BA, Lin E, Von Korff M, et al. Diabetes complications severity index and risk of mortality, hospitalization, and healthcare utilization. Am J Manag Care. 2008;14:15–23. [PMC free article] [PubMed] [Google Scholar]