

Abstract
The rise in non-heme iron (NHI) concentration observed in skeletal muscle of aging rodents is thought to contribute to the development of sarcopenia. The source of the NHI has not been identified, nor have the physiological ramifications of elevated iron status in aged muscle been directly examined. Therefore, we assessed plantaris NHI and heme iron (HI) levels in addition to expression of proteins involved in iron uptake (transferrin receptor-1; TfR1), storage (ferritin), export (ferroportin; FPN), and regulation (iron regulatory protein-1 (IRP1) and -2 (IRP2)) of male F344xBN F1 rats (n=10/group) of various ages (8, 18, 28, 32, and 36 months) to further understand iron regulation in aging muscle. In a separate experiment, iron chelator (pyridoxal isonicotinoyl hydrazone; PIH) or vehicle was administered to male F344xBN F1 rats (n=8/group) beginning at 30 months of age to assess the impact on plantaris muscle mass and function at ~36 months of age. Principle findings revealed the increased NHI concentration in old age was consistent with concentrating effects of muscle atrophy and reduction in HI levels, with no change in the total iron content of the muscle. The greatest increase in muscle iron content occurred during the period of animal growth and was associated with downregulation of TfR1 and IRP2 expression. Ferritin upregulation did not occur until senescence and the protein remained undetectable during the period of muscle iron content elevation. Lastly, administration of PIH did not significantly (p>0.05) impact NHI or measures of muscle atrophy or contractile function. In summary, this study confirms that the elevated NHI concentration in old age is largely due to the loss in muscle mass. The increased muscle iron content during aging does not appear to associate with cytosolic ferritin storage, but the functional consequences of elevated iron status in old age remains to be determined.
Keywords: Sarcopenia, muscle aging, pyridoxal isonicotinoyl hydrazone, muscle function, skeletal muscle iron regulation
1. Introduction
The decline in muscle mass and quality that occurs with aging, termed sarcopenia, is a significant health problem afflicting up to half of the elderly population (von Haehling et al., 2012). In recent years, the role of iron as a causative factor in the development of sarcopenia has generated much interest. Iron possesses redox chemistry and can access several oxidation states. It is this property that enables iron to be a suitable component of many electron transferring systems (Comporti, 2002) and affords iron the ability to produce extremely reactive oxygen radical species (ROS). Notably, iron-induced free radical production is hypothesized to be a pivotal factor in the progression of oxidative injury and dysfunction observed in senescent skeletal muscle (Altun et al., 2007; Hofer et al., 2008; Jung et al., 2008; Xu et al., 2008; Xu et al., 2012a).
The majority of total body iron is incorporated into heme proteins that include hemoglobin, myoglobin, cytochromes, and heme thiolates in addition to NHI that serves as an enzyme cofactor and important iron reserve (Finch and Huebers, 1982). Skeletal muscle NHI comprises approximately 60% of the muscle total iron content (Chen and Thacker, 1986) and skeletal muscle contains roughly 10–15% of the total body iron (Barbieri and Sestili, 2012). Our group is among several to report the occurrence of elevated NHI status in skeletal muscle of aged animals (Altun et al., 2007; Hofer et al., 2008; Jung et al., 2008; Xu et al., 2008; Xu et al., 2012a). Skeletal muscle iron elevation during aging is likely to be of vital importance as it could promote greater release of iron from ferritin and further exacerbate ROS production (Jung et al., 2008). Although heme-iron (HI) containing proteins can cause intracellular oxidant production (Gorelik and Kanner, 2001; Kanner and Harel, 1985; Turrens, 2003), studies investigating iron status of aging skeletal muscle examined only the NHI fraction since iron released from ferritin or iron-sulfur clusters can exist as low molecular weight iron complexes capable of generating free radicals via Fenton chemistry (Gutteridge, 1989).
Current evidence suggests the aging-associated elevation in skeletal muscle NHI concentration may be detrimental, and associations with muscle atrophy and oxidative stress have been reported (Hofer et al., 2008; Jung et al., 2008; Xu et al., 2008; Xu et al., 2012a). Skeletal muscle mitochondria also demonstrate increased NHI concentration in senescence that could be linked to mitochondrial dysfunction and muscle degeneration (Seo et al., 2008). It is still unknown whether elevated muscle iron status during aging plays a causative role in these outcomes.
While it is well documented that skeletal muscle NHI concentration and content are elevated in senescence, the factors responsible for these increases remain unclear. The development of muscle atrophy during aging conceivably causes an iron concentrating effect, but the contribution of other factors to the elevation of muscle iron status is unknown. Declines in heme synthesis and concentration (Atamna et al., 2002; Bitar and Weiner, 1983; Bitar and Shapiro, 1987) and/or dysregulation of iron uptake or export pathways (Jung et al., 2008; Xu et al., 2012a) could be contributing factors. To date, only limited emphasis has been placed on unraveling the mechanisms of aging-associated increases in skeletal muscle NHI. Delineation of HI and iron regulation responses over the course of aging would fill important gaps in our current understanding of iron metabolism in aging muscle. Moreover, the direct determination of muscle iron status on measures of muscle atrophy and function in old age has not been reported. Therefore, the purpose of the current experiments was three-fold: 1) to discern the contribution of HI to the muscle total iron content over the course of aging; 2) reveal the impact of aging on key iron regulation mRNA and protein responses; and 3) determine the impact of prolonged iron chelator administration on the development of sarcopenia.
These experiments examined skeletal muscle of F344xBN F1 rats, which is a well-accepted model for the study of sarcopenia. We selected the plantaris since this muscle undergoes significant atrophy during aging and exhibits increased NHI concentration (Jung et al., 2008). We studied animals ranging in age from young adult to senescent to test the overarching hypotheses that skeletal muscle NHI elevation was partially the result of iron concentrating effects of muscle atrophy and decreased heme iron levels, and NHI accumulation contributed to the development of muscle atrophy and dysfunction in old age.
2. Material and Methods
2.1. Experimental Animals
Male F344xBN F1 rats were obtained from the National Institutes of Health, National Institute on Aging, Aged Rodent Colony. The animal use protocol was approved by the Syracuse University Institutional Animal Care and Use Committee and all experimental procedures followed guidelines established by the American Physiological Society for the use of animals in research.
2.1.1. Experiment 1
Five groups of rats (n=10/group) ranging in age from young adult to senescent were utilized to determine the impact of aging on skeletal muscle iron status and regulation. Ages varied slightly within each of the five groups (age range; mean±SEM): 8 months (7–8; 7.5±0.2), 18 months (18–19; 18.1±0.1), 28 months (28–29; 28.4±0.2), 32 months (31–33; 32.0±0.2), and 36 months (36–37; 36.3±0.2) and are reported as single-month values for clarity. These age groups are roughly equivalent to young adult, 35, 50, 65, and 85 year old humans based on survival curves for male F344xBN F1 rats (Turturro et al., 1999) and human males (Arias, 2006). Upon arrival to the animal facility the rats were provided with water and food (LabDiet 5001; St. Luis, MO) containing 270 ppm iron ad libitum and were housed in a thermo neutral environment on a 12-hour light: dark cycle. On the day of tissue dissection all animals were deeply anesthetized by an intraperitoneal injection of pentobarbital sodium (80–120 mg/kg). Upon reaching a surgical plane of anesthesia the liver and plantaris muscles were quickly excised and trimmed of excess tendon, weighed, then frozen in liquid nitrogen and stored at −80°C. The animals were euthanized by removal of the heart and diaphragm.
2.1.2. Experiment 2
Upon arrival to the animal facility the rats were provided with water and food (7017 NIH-31; Teklad Diets, Madison, WI) containing 270 ppm iron ad libitum and were housed in a thermo neutral environment on a 12-hour light: dark cycle. Animals were divided into control (CON; n=14), vehicle (VEH; n=12), and iron chelator (pyridoxal isonicotinoyl hydrazone; PIH; n=19) groups to determine the effect of prolonged iron chelator administration on plantaris muscle mass and function. One group of CON animals was obtained at 30 months of age (n=10) and was housed in the animal facility for up to 7 months. In addition, four controls were obtained at 36 months of age and euthanized 1-week following their arrival to the facility. Beginning at 30 months of age, animals in the VEH group received weekly i.p injections of 10% Cremophor EL (Sigma-Aldrich, St Louis, MO) for 6–7 months. Animals in the PIH group also received weekly i.p. injections beginning at 30-months of age for 6–7 months. Animals in the PIH group received pyridoxal isonicotinoyl hydrazone at a dose of 50 mg/kg (Adamcova et al., 2002). All animals in the VEH and PIH groups were weighed weekly and visually inspected for tumors and outward signs of ill-health. One to two days following the final injection of vehicle or PIH, the animals (including controls) were anesthetized by an intraperitoneal injection of pentobarbital sodium (80–120 mg/kg). Muscle contractile properties were assessed prior to tissue collection from a subgroup of animals (n=5/group). Plantaris muscles were excised, weighed, and utilized for the determination of NHI levels. The animals were euthanized by removal of the heart and diaphragm.
2.2. Non-heme Iron (NHI)
Non-heme iron was measured according to the method described by Rebouche et al. (2004) using reagents prepared with ultrapure (18.6 MΩ) water. Muscle samples (30–50 mg) were homogenized (1:10; wt:vol) on ice in ultrapure water using an all glass Potter-Elvehjem style homogenizer. Tissue homogenates (100 μL) were mixed with an equal volume of protein precipitation solution containing 1 N HCL and 10% trichloroacetic acid in 1.5 mL polypropylene tubes. Samples were vortexed and placed in a water bath for 1 hour at 95°C; following incubation the samples were removed from the water bath, vortexed, and centrifuged 8,200 × g for 10 minutes. An equal amount of supernatant (30 μL) was mixed with chromagen solution containing 0.508 mM ferrozine, 1.5 M sodium acetate, and 0.1% thioglycolic acid. Samples were also incubated with 1.5 M sodium acetate and 0.1% thioglycolic acid to serve as sample blanks. Following a 30-minute incubation at room temperature the absorbance of the reaction mixture was measured in a plate reader (PowerWave HT, BioTek) at a wavelength of 562 nm. Non-heme iron concentration was calculated from a standard curve (0, 2, 4, 6, 8, and 10 μg/mL) created by diluting iron atomic absorption standard (Sigma-Aldrich) with an equal volume of protein precipitation solution.
2.3. Heme Iron (HI)
Heme concentration was measured in crude tissue homogenates generated from the NHI assay. Two rounds of the assay were performed. In the first round the homogenates were centrifuged 10,000 × g for 10 minutes at 4°C. Heme concentration was measured in the supernatant using the Quantichom Heme Assay kit (BioAssay Systems) according to the manufacturer’s instructions. In the second round, following centrifugation the supernatant was subjected to an immunoprecipitation (IP) procedure to remove hemoglobin from the sample. Briefly, supernatants were pre-cleared by incubation with 1 μg of goat IgG (sc-2028; Santa Cruz Biotechnology, Santa Cruz, CA) and 20 μL of Protein A/G PLUS-Agarose (sc-2003; Santa Cruz Biotechnology) for 30 minutes at 4°C. The agarose was then pelleted by centrifugation (1,000 × g) for 5 minutes at 4°C. Pre-cleared supernatant (60 μL) was then reacted with 20 μL (determined from preliminary experiments, see Results) of anti-hemoglobin-β antibody (sc-31116; Santa Cruz Biotechnology) for 1 hour at 4°C. Samples were then incubated for 3 hours on a rocking platform following the addition of 20 μL of Protein A/G PLUS-Agarose. Following the incubation, samples were centrifuged 1,000 × g for 5 minutes at 4°C and the supernatant was analyzed for heme concentration using the Quantichrom Heme Assay kit. Heme concentration was converted to HI values on the basis that one nmole of heme contains of one nmole of iron.
2.4. Western Blot Analysis
Plantaris muscle (50–100 mg) was homogenized (1:10; wt:vol) in buffer (5 mM Tris-HCL, 1.0% Triton-X, 0.1% SDS, pH=7.4) containing protease inhibitor (Sigma-Aldrich) and centrifuged 10,000 × g for 10 minutes at 4ºC. Protein content of the soluble fraction was assessed by the method of Bradford (Bradford Reagent; Sigma-Aldrich). Proteins (60–90 μg) were individually separated by SDS-PAGE and transferred to nitrocellulose membranes (275 mA for 2 hours). Membranes were then stained with Ponceau S and visually inspected to confirm equal protein loading and transfer. Membranes were subsequently blocked in phosphate-buffered saline solution containing skim milk protein and 0.05% tween-20 followed by incubation with a primary antibody directed against ferritin L (1:500; FERL14-A; Alpha Diagnostic Inc., San Antonio, TX), TfR1 (1:5,000; MCA155R; Abd Serotec, Raleigh, NC), IRP1 (1:500; sc14216; Santa Cruz Biotechnology), or IRP2 (IRP21-S, Alpha Diagnostic; AB15508, Millipore; sc-14221, Santa Cruz Biotechnology) diluted in blocking buffer. Membranes were washed and incubated with a horseradish peroxidase-antibody conjugate (1:5,000) directed against the primary antibody for 1 hour at room temperature. Following washing the membranes were then treated with chemiluminescent reagents (luminol and enhancer; Thermo Fisher Scientific, Rockford, IL), exposed to light sensitive film, and images analyzed using ImageJ software (Abramoff et al., 2004). Protein expression was normalized to the sum of individual protein bands on coomassie (Bio-Safe; BioRad) stained membranes.
2.5. Ferroportin Antibody Specificity
We performed an antibody blocking experiment using a commercially available FPN antibody (MTP11-S; Alpha Diagnostic) and corresponding control peptide (MTP11-P; Alpha Diagnostic). The blocking experiment was performed according to the manufacturer’s instructions with minor modifications. Briefly, 1.0 μL of FPN antibody was added to two 1.5 mL tubes, each containing 100 μL of phosphate buffered saline. Control peptide (100 μL) was added to one tube (peptide sample) and 100 μL of phosphate buffered saline was added to the other tube (no peptide sample). The tubes were gently mixed and incubated for 2 hours at 37°C followed by 24-hour incubation at 4°C. The tubes were then centrifuged 10,000 x g for 15 minutes (4°C) to pellet immune complexes. The supernatant from both tubes was applied to separate membranes (1:5,000) containing protein from liver and skeletal muscle samples, and western blots were performed according to the procedures described above.
2.6. RNA Isolation
A portion of the plantaris (~60 mg) was homogenized in 1.5 ml of TRIzol reagent (Life Technologies, Grand Island, NY) and processed according to the manufacturer’s instructions. Briefly, samples were homogenized with a polytron blade homogenizer at medium speed and centrifuged 12,000 × g for 10 minutes (4°C) to remove insoluble material. The RNA portion was transferred to a new tube and extracted with 120 mL of bromochloropropane. Samples were vortexed briefly and centrifuged 13,000 × g for 20 minutes (4°C). Following transfer of the aqueous phase to a new tube, RNA was precipitated with one volume of isopropanol and washed twice with two volumes of 75% ethanol. The RNA was pelleted via centrifugation and resuspended in RNAse free water (Sigma-Aldrich). One microliter of the total RNA sample was analyzed using an Agilent 2100 Bioanalyzer for quality analysis and quantification. RNA Integrity Number values ranged from 8.0–9.1 and averaged 8.5 across all samples.
2.7. Reverse Transcription and Real-time Quantitative PCR
Reverse transcription was performed on an Amplitron II thermal cycler (Barnstead/Thermolyne) using the Superscript III First-Strand Synthesis System for RT-PCR (Life Technologies) according to the manufacturer’s instructions. Reactions were carried out using 5 μg of total RNA and 2.5 μM oligo(dT)20 primers. Real-time quantitative PCR was completed on a Bio-Rad iQ5 Multicolor Real-Time PCR System with iQ5 Optical System Software version 2.1 (Bio-Rad). Each 25 μL PCR reaction, performed in duplicate, contained 2.0 μL of cDNA template. The probes for all genes consisted of Taqman 5′ labeled FAM reporters and 3′ non-fluorescent quenchers. Primers and probes for ferritin L, TfR1, IRP1, IRP2, FPN, and beta actin were obtained from Applied Biosystems (Assays-on-Demand; ABI). The sequences used by the manufacturer in the design of primers and probes from this service are proprietary and are therefore not reported. Cycling conditions were set according to recommendations for Taqman Gene Expression Assays (Applied Biosystems). Gene expression was calculated using the relative standard curve method as described in the ABI, User Bulletin #2. Input values obtained from standard curves were normalized to beta actin since this gene did not demonstrate altered expression levels with aging (p=0.65).
2.8. Iron Chelator Synthesis and Preparation
The iron chelator, pyridoxal isonicotinoyl hydrazone (PIH), was synthesized according to previously published methods (Brittenham, 1990) and was reddish-orange in appearance. To prepare the chelator solution, PIH was mixed with Cremophor EL (Sigma-Aldrich) (Adamcova et al., 2002) in a 50 mL Falcon tube (BD Biosciences, San Jose, CA) and stirred to disintegrate large pieces. The solution was then brought up to volume with 0.9% NaCl (10% Cremophor EL) and filtered through a sterile 70 μm nylon cell strainer (BD Biosciences). The chelator solution was gently agitated for 30 minutes to 1 hour to partially solubilize the chelator, which resulted in a yellow colored solution. The chelator solution was prepared fresh and was administered within 3 hours following preparation.
2.9. In situ Muscle Contractile Function
On the day of the experiment, animals (n=5/group) were anesthetized with an i.p. injection of sodium pentobarbital (80–120 mg/kg), which was then administered as needed throughout the remainder of the muscle contractile experiment. Once in a surgical plane of anesthesia the animals were placed on a heating blanket to maintain body temperature at approximately 37°C. A surgical procedure was then performed under a dissecting microscope to expose the femur and isolate and incise the sciatic nerve near the lateral, distal portion of the left leg. The left plantaris muscle was then surgically isolated and 2-0 silk suture was threaded through the distal tendon of the muscle. Extreme care was taken to ensure that the blood supply to the muscle remained intact. Approximately 40 minutes was required to complete the surgical procedure. The animal was then transferred to a heated platform (806D in situ Rat Apparatus, Aurora Scientific) in the prone position and the left leg was secured using conical screws placed at the distal femur and tibia. The suture was then fastened to the arm of the force transducer (305C-LR, Aurora Scientific). The plantaris muscle surface temperature was maintained (34.0±0.3°C) by shining a lamp on the muscle and routinely applying a warmed solution of mineral oil mixed with Vaseline. Force output was recorded via a computerized data-acquisition system (DMA v4.1.6; Aurora Scientific). The muscle was stimulated with platinum wire electrodes placed at the proximal and distal regions of the muscle using supramaximal monophasic pulses of 0.5 ms. The optimal contractile length was determined by systematically adjusting the length of the muscle while evoking single twitches. Thereafter, all contractile properties were measured isometrically at optimum contractile length. To measure the force frequency response the muscle was stimulated supramaximally between 1 and 200 Hz (300 ms trains). Contractions were separated by a 2-min recovery period. At the end of the experiment the left plantaris muscle was removed, rinsed in 0.9% NaCl and gently wiped with a cotton swab to remove blood and the mineral oil-Vaseline mixture. The muscle was trimmed of excess connective tissue, weighed, and cut at the mid-belly; one-half of the muscle was embedded at an unstressed length in OCT (Sakura Finetek USA, Torrance, CA) immersed in liquid nitrogen-cooled isopentane and the remaining tissue was frozen in liquid nitrogen for biochemical analyses.
2.10. Data Analysis
Boxplots were used to visualize data distribution and determine the presence of outliers. Levene’s Test of Equality of Error Variances was applied to determine homogeneity of variance. Variables analyzed in Experiment 1 included: Body mass, muscle mass, muscle mass to body mass, iron concentration, percent heme iron reduction, IRP1 (mRNA and protein), TfR1 (mRNA and protein), FPN (mRNA), ferritin L (mRNA), IRP2 (mRNA). Variables that displayed homogeneity of variance were analyzed with one-way ANOVA followed by Tukey’s HSD test in the event significant effects were detected. In the event of a violation of homogeneity of variance an independent samples Kruskal-Wallis test was performed followed by Tamhane’s T2 post-hoc test in the event significant effects were detected. Muscle iron content was analyzed using two-way ANOVA. For Experiment 2, the above procedures were employed for body mass, muscle mass, muscle mass to body mass, NHI concentration, and maximal isometric peak tetanic tension. The Chi-Square test was used to determine differences in the frequency of animal deaths between groups. Data are expressed as means±standard error of the mean (SEM). Statistical significance was set at p<0.05. Data were analyzed using IBM SPSS Statistics v19.0 (IBM Corporation, Somers, NY) software for Windows.
3. Results
3.1. Heme Iron and Non-heme Iron Levels in Aging Skeletal Muscle
Animal body mass increased with age until 28 months, then declined significantly from peak values in senescence (Table 1). Plantaris muscle mass was the greatest in 18 month old animals and was considerably reduced in senescent animals (approximate 50% reduction from peak levels) (Table 1). Decreased muscle mass to body mass (MM/BM) over the course of aging shows that the animals were sarcopenic in old age (Table 1). To reveal how the iron status of the plantaris changed over the course of aging we measured NHI and HI concentrations. Non-heme iron concentration increased over the course of aging, although similar values were observed between 28 and 32-month old groups (p=0.49) (Figure 1A). Immunoprecipitation of hemoglobin-β was performed to minimize the contribution of hemoglobin to the measurement of skeletal muscle HI. Figure 1B illustrates two representative samples showing a visible decrease in hemoglobin protein with increasing amounts of hemoglobin-β antibody. Removal of hemoglobin from the samples reduced the HI concentration in all of the groups (Figure 1C). A greater amount of hemoglobin was removed from the 36-month samples compared to 8-month samples (p<0.05). Following immunoprecipitation the HI concentration was not different between groups, but approached statistical significance (p=0.06) (Figure 1D). Muscle iron content was calculated by multiplying iron concentration values by the total muscle mass. Non-heme, heme, and total iron content values are displayed in Figure 2. Non-heme iron content progressively increased from the 8 month group until 28 months (p<0.05) and then remained stable until 36 months (p>0.05). Changes in total iron reflected changes in the NHI content. Lower HI content values were observed among 32 and 36 month groups compared to the 18 month old group (p<0.05). Heme iron content was lower than NHI content for all age groups (p<0.05).
Table 1.
Body mass (BM), Muscle Mass (MM), and MM/BM
| 8 months | 18 months | 28 months | 32 months | 36 months | |
|---|---|---|---|---|---|
| BM (g) | 395.2 ± 13.2 | 547.7 ± 19.5* | 590.4 ± 10.7* | 522.7 ± 17.1* | 468.7 ± 21.6*‡ |
| MM (mg) | 398.4 ± 14.0 | 477.4 ± 12.4† | 411.0 ± 7.3 | 356.1 ± 6.6# | 255.2 ± 20.8† |
| MM/BM | 1.01 ± 0.01† | 0.89 ± 0.02† | 0.70 ± 0.01Δ | 0.67 ± 0.03Δ | 0.54 ± 0.03† |
Values are mean±SEM. MM=mass of the muscle analyzed for iron content.
Different from 8 months (p<0.05);
Different from 18 and 28 months (p<0.05);
Different from all other age groups (p<0.05);
Different from 28 months (p<0.05);
Different from 8, 18, and 36 months (p<0.05). N=8–10/group.
Figure 1.
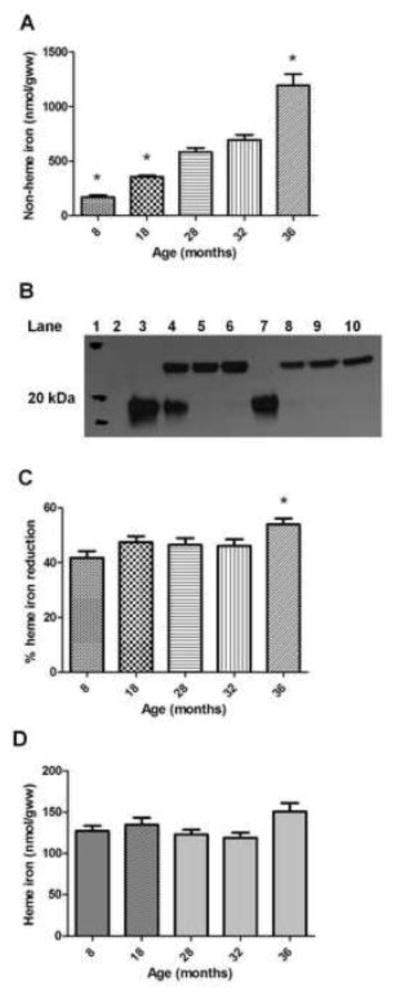
Plantaris non-heme and heme iron. A) Non-heme iron concentration expressed relative to grams of tissue wet weight (gww). *Different from all other groups (p<0.05); n=9–10 animals/group. B) Representative western blot illustrating 8-month (lanes 3–6; 0, 5, 10, 20 μL antibody, respectively) and 36-month (lanes 7–10; 0, 5, 10, 20 μL antibody, respectively) hemoglobin-β immunoprecipated plantaris muscle samples (lane 1=molecular weight marker; lane 2=no sample). Top bands (~23 kDa) illustrate IgG light chains and bottom bands (~18 kDa) illustrate hemoglobin-β. Total reaction volumes equal across samples. C) Percent heme-iron reduction in the samples following immunoprecipitation of hemoglobin-β. *Different from 8-month group (p<0.05); n=7–10/group. D) Heme iron concentration expressed relative to grams of tissue wet weight; n=7–10 animals/group. Values are mean±SEM.
Figure 2.
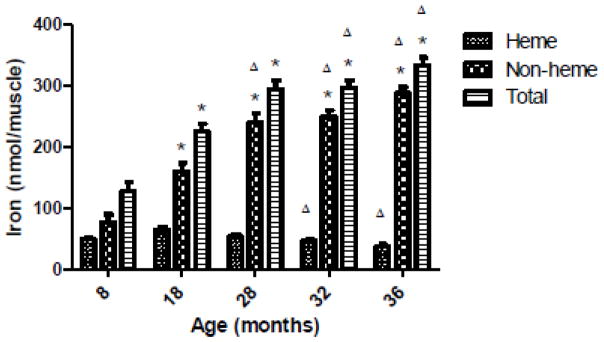
Plantaris muscle iron content. Heme and NHI content was calculated by multiplying iron concentration (nmol/gww) by the total muscle mass. Total iron is the sum of HI and NHI content values. *Different from respective 8-month group (p<0.05). ΔDifferent from respective 18-month group (p<0.05). N=7–10 animals/group. Values are mean±SEM.
3.2. mRNA Expression of Iron Metabolism Components
mRNA levels of ferritin L were elevated in the two oldest animal groups compared to 8 and 18-month old groups (p<0.05) (Figure 3A). Compared to the youngest group of animals, TfR1 mRNA expression was markedly reduced beginning at 18-months and showed the greatest decline at 36 months (p<0.05) (Figure 3B). Iron regulatory proteins-1 (IRP1) and -2 (IRP2), which are known to regulate ferritin L and TfR1 protein expression in other cell types, also demonstrated aging-related alterations (Figures 3C and 3D, respectively). IRP1 mRNA levels were elevated at 32-months compared to 8-month old animals (p<0.05). IRP2 mRNA expression demonstrated fluctuation, with decreased levels detected at 18 and 32-months compared to the youngest group of animals (p<0.05). mRNA expression of the iron transporter, FPN, showed an increased expression at 28 months compared to younger groups (p<0.05), but the older groups failed to show changes from the younger groups of animals (32 vs. 8-month, p=0.07; 32 vs. 18-month, p=0.06) (Figure 3E).
Figure 3.

Relative mRNA expression of iron metabolism components assessed by real-time PCR. A) Ferritin L expression is increased with advancing age. *Different from 8 and 18-month old groups (p<0.05); n=8–10 animals/group. B) TfR1 expression is deceased over the course of aging. *Different from 8-month old group (p<0.05). ΔDifferent from 18-month old group (p<0.05). N=9–10 animals/group. C) IRP1 expression shows upregulation in aged muscle. *Different from 18-month old group (p<0.05); n=8–10 animals/group. D) IRP2 expression shows a decrease with aging. *Different from 8-month old group (p<0.05); n=7–10 animals/group. E) Ferroportin mRNA exhibits increased expression during late middle-age compared to younger groups. *Different from 8 and 18-month old groups (p<0.05); n=7–10 animals/group. Values are mean±SEM.
3.3. Protein Expression of Iron Metabolism Components
Protein expression of ferritin L is upregulated in aged skeletal muscle (Jung et al., 2008), but the time-course of this change was not previously investigated. We attempted to measure ferritin L expression in all age groups but the protein was not detectable until animals were 32-months of age. Ferritin L protein bands were detectable in only three 32-month old animals, and all 36-month old animals showed presence of the protein. Therefore, protein expression comparisons were not able to be made across the groups. Figure 4A shows a representative image of the ferritin L western blot film. TfR1 protein expression was lower at 18, 28, and 32-months compared to the 8-month group (p<0.05), but at 36-months the expression did not differ from the other groups (36 vs. 8-months, p=0.07; 36 vs. 28-months, p=0.06) (Figure 4B). IRP1 protein expression was greater in the 36-month old animals compared to 8, 18, and 28-month old groups (p<0.05) (Figure 4C). Skeletal muscle FPN (~60 kDa) protein expression was not detected (Figure 1, Supplemental Data). Despite multiple attempts, IRP2 protein was also not detected in any of the samples.
Figure 4.

Protein expression of iron metabolism components in aging muscle. A) Representative ferritin L (19 kDa) western blot image (M=molecular weight marker, L=liver). B) (top) Representative TfR1 (95 kDa) western blot image (M=molecular weight marker, L=liver); (bottom) TfR1 protein expression in aging plantaris. *Different from 8-month old group (p<0.05); n=8–10/group. C) (top) Representative IRP1 (98 kDa) western blot image (M=molecular weight marker; L=liver); (bottom) IRP1 protein expression in aging plantaris. *Different from 8 and 18-month old groups (p<0.05); n=9–10/group. Values are mean±SEM.
3.4. Prolonged Administration of Iron Chelator and Vehicle
Animals in the vehicle group received 28.8 ± 0.9 weekly i.p injections compared to PIH animals which received 27.6 ± 0.5 injections. Eight animals in each of the three groups completed the experimental protocol. The difference in the number of animals that started the experimental protocol with those that remained at the study completion was due to deaths (assumed to be aging-related) or euthanasia due to ill health (e.g., excessive body mass loss, inadequate level of mobility, ulcerated tumors). There was no difference in the frequency of aging-related or euthanasia deaths between the groups (p=0.90).
3.5. Animal Body Mass and Muscle Mass following Prolonged PIH Administration
Animal body mass (g) (CON, 509.4 ± 12.7; VEH, 507.2 ± 24.5; PIH, 489.5 ± 19.6; p>0.05; n=8/group) and muscle mass of the left plantaris (mg) (CON, 272.4 ± 15.6; VEH, 267.4 ± 17.2; PIH, 241.1 ± 10.2; p>0.05; n=8/group) was not significantly different between groups and were consistent with values of 36-month old animals from Experiment 1. The ratio of muscle mass to body mass (mg/g) was not significantly different between groups (CON, 0.54 ± 0.03; VEH, 0.54 ± 0.04; PIH, 0.50 ± 0.03; p>0.05; n=8/group).
3.6. No Effect of Prolonged PIH Administration on Plantaris Muscle Iron Status or Function
Plantaris NHI concentration (nmol/gww) of CON, VEH, and PIH animals that completed the ~6-month long experiment was not significantly different between groups (CON, 977.9 ± 42.5; VEH, 1095.0 ± 112.7; PIH, 1051.9 ± 79.2; p>0.05; n=7–8/group). Plantaris force production was assessed in situ to determine if prolonged PIH administration attenuated the aging-associated decline in skeletal muscle function. Maximal isometric peak tetanic tension (N/mgww) was not significantly different between groups (CON, 12.7 ± 1.0; VEH, 12.6 ± 1.2; PIH, 12.2 ± 1.1; p>0.05; n=5/group).
4. Discussion
4.1. Iron distribution in aging skeletal muscle
Non-heme iron (NHI) was combined with heme iron (HI) measurements to further our understanding of aging effects on skeletal muscle iron regulation. While muscle NHI concentration is thought to be physiologically relevant with regard to ROS generation (Xu et al., 2008), the measurement of iron content provides insight into iron distribution within the HI and NHI compartments. Our results are consistent with data from gastrocnemius muscle of aging rats (Xu et al., 2008) and confirm speculation that elevated NHI concentration in senescent muscle is largely the result of muscle atrophy; although a shift of iron from the HI compartment may be a contributing factor. Non-heme iron concentration was two-fold greater (p<0.05) in muscle from 36 versus 28 month old animals despite a lack of change in the total iron content (HI + NHI). This is in contrast to growing animals in which the rise in NHI concentration by early middle age (i.e., 18 months) is accompanied by iron accumulation in the muscle. In these animals, total iron content and muscle mass were greater compared to the younger (I.e., 8 month) group of animals which may reflect an increased iron demand to support muscle growth. Therefore, factors that regulate the elevation in NHI concentration may largely be influenced by the growth status of the animal.
4.2. Aging response of iron uptake, storage, and export proteins
Elevation of skeletal muscle iron status was predicted to coordinately downregulate TfR1 (Jung et al., 2008; Xu et al., 2012a) and upregulate ferritin L (Jung et al., 2008). Control of TfR1 and ferritin protein expression is principally regulated at the post-transcriptional level by the iron regulatory proteins, IRP1 and IRP2, via the iron responsive element (IRE) in the 3′ or 5′ untranslated region of the respective mRNA (Galy et al., 2008; LaVaute et al., 2001; Wang et al., 2007). The timing of the differential response in TfR1 and ferritin L expression was unanticipated and illustrates the complexity of the cellular iron regulation system.
Decreased TfR1 mRNA and protein levels at early middle age is consistent with the predicted impact of elevated iron status on the muscle iron uptake response. However, elevated ferritin L expression was most evident at 36 months rather than 18 months, as would be predicted by the IRP system of iron regulation (Galy et al., 2008). Ferritin L mRNA and protein showed a comparable pattern of expression which suggests synthesis of the protein was triggered at the level of transcription by the iron concentrating effects of muscle atrophy. Ferritin L mRNA transcription is strongly induced by iron (Cairo et al., 1989; Leggett et al., 1993; Miller et al., 1991; White and Munro, 1988) and is relatively unaffected by pro-inflammatory cytokines (Fahmy and Young, 1993; Kwak et al., 1995; Miller et al., 1991; Torti et al., 1988). The absence of ferritin L upregulation during the period of initial NHI elevation in growing animals suggests the iron may serve a functional purpose or is sequestered in a non-ferritin compartment. Elevated mitochondrial NHI levels were recently reported in aged skeletal muscle (Seo et al., 2008). It is unknown whether the rise in mitochondrial NHI serves a functional role or is the consequence of rising cytosolic iron concentration. Nonetheless, it is apparent that the age-associated increase in mitochondrial NHI is associated with greater mitochondrial oxidative damage, caspase-3 activity, and susceptibility of mitochondrial permeability transition pore opening (Seo et al., 2008).
Additional mechanisms hypothesized to contribute to iron status elevation in senescent muscle include iron uptake by divalent metal transporter-1 (DMT1) (Jung et al., 2008; Xu et al., 2012a) and iron accumulation due to low or absent FPN protein expression (Xu et al., 2012). The inability to detect the ~60 kDa FPN protein is consistent with previous work and strengthens the notion of limited iron export to the circulation by aging muscle (Xu et al., 2012a). The time course of muscle iron content changes suggests a lack of iron export may have contributed to iron accumulation until late middle age. However, suggestions that DMT1 may contribute to iron accumulation in senescence (Jung et al., 2008; Xu et al., 2012a) seem less plausible since iron import by DMT1 should depend largely on transferrin-mediated iron uptake by TfR1 (Garrick et al., 2003; Xu et al., 2012b), which is strongly downregulated by early middle age.
4.3. Expression of iron regulatory proteins, IRP1 and IRP2
Expression of TfR1 and ferritin L proteins is coordinated by the IRE binding activities of IRP1 and IRP2 proteins. Despite an overlap of function between the two IRPs, IRP2 is the more dominant regulator of iron metabolism in mammalian cells (Rouault, 2006; Wang et al., 2007). Notably, the decline in IRP2 mRNA coincided with the decline in TfR1 mRNA and protein, which suggests a causal effect of IRP2 downregulation on TFR1 expression. IRP2 protein is primarily regulated by the rate of its degradation by the proteasome in response to an increased cellular iron status (Vashisht et al., 2009); thus, elevated iron status leads to decreased IRP2-IRE binding activity and a subsequent decrease in TfR1 expression (Wang et al., 2007). IRP2 is susceptible to degradation during the protein extraction process (Guo et al., 1995) and likely explains the lack of IRP2 detection in the current experiment. Nonetheless, reductions in IRP2 mRNA are expected to decrease IRP2 protein levels (Wang et al., 2007). While decreased IRP2 mRNA levels cannot be explained by the current data, the association between muscle c-myc expression and the growth status of rats identifies c-myc as a potential mechanism of IRP2 transcriptional regulation (Whitelaw and Hesketh, 1992; Wu et al., 1999). Overall, the decline in IRP2 mRNA expression was an early alteration that coincided with downregulation of TfR1 and is the first evidence to suggest a potential role for IRP2 in the regulation of iron status in aging muscle.
Increased IRP1 protein expression observed at 36 months is not predicted to impart additional regulation on TfR1 or ferritin L protein expression. Elevated IRP1 would likely exist as non-IRE binding, cytosolic aconitase due to the presence of elevated cellular iron concentration (Haile et al., 1992). Rather, cytosolic aconitase produces NADPH and could play a larger role in regulating cellular energy metabolism in aging muscle (Rouault, 2006).
4.4. Prolonged PIH administration
To determine whether elevated iron concentration in old age contributes to skeletal muscle atrophy and dysfunction we administered PIH to rats from 30 months of age until senescence. Our decision to utilize PIH was based on characteristics of the chelator that include: 1) the ability to cross cell membranes (Hermes-Lima et al., 2000; Richardson and Ponka, 1998a; Richardson and Ponka, 1998b); 2) extremely low potential for toxicity (Adamcova et al., 2002; Adamcova et al., 2003; Brittenham, 1990; Simunek et al., 2005; Sterba et al., 2005); and 3) absence of direct oxidant scavenging ability (Hermes-Lima et al., 2000). The lack of PIH effects following prolonged administration was surprising, and the reason for the lack of chelator effectiveness is unknown. It is possible that a higher administered dose or a greater frequency of PIH administration may have increased the effectiveness of the iron chelation treatment. A compensatory adaptation in iron uptake may have occurred in the muscle as a result of PIH administration, but this is unlikely due to the high degree of similarity in NHI values observed between the groups.
5. Conclusions
Skeletal muscle NHI and total iron levels increase in growing animals and reach a plateau by late middle age. The concentration of NHI continues to rise until senescence, which is largely a reflection of muscle atrophy. Downregulation of IRP2 is consistent with reductions in TfR1 mRNA and protein levels; suggesting IRP2 may be a principle regulator of muscle iron status. The rise in muscle iron content does not drive increased ferritin expression and suggests an expansion of iron in the non-ferritin compartment. Prolonged administration of PIH did not alter plantaris NHI levels, or the degree of atrophy or muscle dysfunction. Our findings support the need for continued work to determine the direct impact of aging-associated iron accumulation on ROS production, muscle atrophy and contractile function.
Supplementary Material
Highlights.
Muscle mass loss in senescence primarily elevates the non-heme iron concentration
Muscle total iron content increases during growth but remains stable in senescence
Ferritin elevation in senescent muscle is not triggered by non-heme iron content
Decreased IRP2 mRNA coincides with protein expression of TfR1, but not ferritin
Acknowledgments
Research reported in this publication was supported by the National Institute on Aging of the National Institutes of Health under award number R03AG032033 (KCD). The content is solely the responsibility of the authors and does not necessarily represent the official views of the National Institutes of Health. We also extend our sincere gratitude to Karen Gentile, Dr. Christopher Nomura, and Nathaniel Charland for assistance with this project.
List of abbreviations
- BM
Body mass
- CON
control
- DMT1
divalent metal transporter-1
- FPN
ferroportin
- F344xBN F1
Fischer 344 Brown Norway F1 hybrid rat
- HI
heme iron
- IRP1
iron regulatory protein-1
- IRP2
iron regulatory protein-2
- IRE
iron responsive element
- MM
muscle mass
- NADPH
nicotinomide adenine dinucleotide phosphate
- NHI
non-heme iron
- OCT
optimal cutting temperature
- PIH
pyridoxal isonicotinoyl hydrazone
- ROS
reactive oxygen radical species
- TfR1
transferrin receptor-1
- VEH
vehicle
Footnotes
Publisher's Disclaimer: This is a PDF file of an unedited manuscript that has been accepted for publication. As a service to our customers we are providing this early version of the manuscript. The manuscript will undergo copyediting, typesetting, and review of the resulting proof before it is published in its final citable form. Please note that during the production process errors may be discovered which could affect the content, and all legal disclaimers that apply to the journal pertain.
References
- Abramoff M, Magelhaes PJ, Ram SJ. Image Processing with ImageJ. Biophotonics International. 2004;11:36–42. [Google Scholar]
- Adamcova M, Machackova J, Gersl V, Pelouch V, Simunek T, Klimtova I, Hrdina R, Ponka P. Cardiac troponin T following repeated administration of pyridoxal isonicotinoyl hydrazone in rabbits. Physiol Res. 2002;51:443–448. [PubMed] [Google Scholar]
- Adamcova M, Sterba M, Klimtova I, Simunek T, Hrdina R, Gersl V, Ponka P. Cardiac troponins following repeated administration of an iron chelator--salicylaldehyde isonicotinoyl hydrazone (SIH)--in rabbits. Acta Medica (Hradec Kralove) 2003;46:171–174. [PubMed] [Google Scholar]
- Altun M, Edstrom E, Spooner E, Flores-Moralez A, Bergman E, Tollet-Egnell P, Norstedt G, Kessler BM, Ulfhake B. Iron load and redox stress in skeletal muscle of aged rats. Muscle Nerve. 2007;36:223–233. doi: 10.1002/mus.20808. [DOI] [PubMed] [Google Scholar]
- Arias E. United States life tables, 2003. Natl Vital Stat Rep. 2006;54:1–40. [PubMed] [Google Scholar]
- Atamna H, Walter PB, Ames BN. The role of heme and iron-sulfur clusters in mitochondrial biogenesis, maintenance, and decay with age. Arch Biochem Biophys. 2002;397:345–353. doi: 10.1006/abbi.2001.2671. [DOI] [PubMed] [Google Scholar]
- Barbieri E, Sestili P. Reactive oxygen species in skeletal muscle signaling. J Signal Transduct. 2012;2012:982794. doi: 10.1155/2012/982794. [DOI] [PMC free article] [PubMed] [Google Scholar]
- Bitar M, Weiner M. Modification of age-induced changes in heme and hemoproteins by testosterone in male rats. Mech Ageing Dev. 1983;23:285–296. doi: 10.1016/0047-6374(83)90029-5. [DOI] [PubMed] [Google Scholar]
- Bitar MS, Shapiro BH. Aberration of heme and hemoprotein in aged female rats. Mech Ageing Dev. 1987;38:189–197. doi: 10.1016/0047-6374(87)90078-9. [DOI] [PubMed] [Google Scholar]
- Brittenham GM. Pyridoxal isonicotinoyl hydrazone. Effective iron chelation after oral administration. Ann N Y Acad Sci. 1990;612:315–326. doi: 10.1111/j.1749-6632.1990.tb24319.x. [DOI] [PubMed] [Google Scholar]
- Cairo G, Tacchini L, Schiaffonati L, Rappocciolo E, Ventura E, Pietrangelo A. Translational regulation of ferritin synthesis in rat liver. Effects of chronic dietary iron overload. Biochem J. 1989;264:925–928. doi: 10.1042/bj2640925. [DOI] [PMC free article] [PubMed] [Google Scholar]
- Chen LH, Thacker RR. Effects of dietary vitamin E and high level of ascorbic acid on iron distribution in rat tissues. Int J Vitam Nutr Res. 1986;56:253–258. [PubMed] [Google Scholar]
- Comporti M. Introduction-serial review: iron and cellular redox status. Free Radic Biol Med. 2002;32:565–567. doi: 10.1016/s0891-5849(02)00758-x. [DOI] [PubMed] [Google Scholar]
- Fahmy M, Young SP. Modulation of iron metabolism in monocyte cell line U937 by inflammatory cytokines: changes in transferrin uptake, iron handling and ferritin mRNA. Biochem J. 1993;296 (Pt 1):175–181. doi: 10.1042/bj2960175. [DOI] [PMC free article] [PubMed] [Google Scholar]
- Finch CA, Huebers H. Perspectives in iron metabolism. N Engl J Med. 1982;306:1520–1528. doi: 10.1056/NEJM198206243062504. [DOI] [PubMed] [Google Scholar]
- Galy B, Ferring-Appel D, Kaden S, Grone HJ, Hentze MW. Iron regulatory proteins are essential for intestinal function and control key iron absorption molecules in the duodenum. Cell Metab. 2008;7:79–85. doi: 10.1016/j.cmet.2007.10.006. [DOI] [PubMed] [Google Scholar]
- Garrick MD, Dolan KG, Horbinski C, Ghio AJ, Higgins D, Porubcin M, Moore EG, Hainsworth LN, Umbreit JN, Conrad ME, Feng L, Lis A, Roth JA, Singleton S, Garrick LM. DMT1: a mammalian transporter for multiple metals. Biometals. 2003;16:41–54. doi: 10.1023/a:1020702213099. [DOI] [PubMed] [Google Scholar]
- Gorelik S, Kanner J. Oxymyoglobin oxidation and membranal lipid peroxidation initiated by iron redox cycle. J Agric Food Chem. 2001;49:5939–5944. doi: 10.1021/jf0104578. [DOI] [PubMed] [Google Scholar]
- Guo B, Brown FM, Phillips JD, Yu Y, Leibold EA. Characterization and expression of iron regulatory protein 2 (IRP2). Presence of multiple IRP2 transcripts regulated by intracellular iron levels. J Biol Chem. 1995;270:16529–16535. doi: 10.1074/jbc.270.28.16529. [DOI] [PubMed] [Google Scholar]
- Gutteridge JM. Iron and oxygen: a biologically damaging mixture. Acta Paediatr Scand Suppl. 1989;361:78–85. doi: 10.1111/apa.1989.78.s361.78. [DOI] [PubMed] [Google Scholar]
- Haile DJ, Rouault TA, Tang CK, Chin J, Harford JB, Klausner RD. Reciprocal control of RNA-binding and aconitase activity in the regulation of the iron- responsive element binding protein: role of the iron-sulfur cluster. Proc Natl Acad Sci U S A. 1992;89:7536–7540. doi: 10.1073/pnas.89.16.7536. [DOI] [PMC free article] [PubMed] [Google Scholar]
- Hermes-Lima M, Ponka P, Schulman HM. The iron chelator pyridoxal isonicotinoyl hydrazone (PIH) and its analogues prevent damage to 2-deoxyribose mediated by ferric iron plus ascorbate. Biochim Biophys Acta. 2000;1523:154–160. doi: 10.1016/s0304-4165(00)00115-x. [DOI] [PubMed] [Google Scholar]
- Hofer T, Marzetti E, Xu J, Seo AY, Gulec S, Knutson MD, Leeuwenburgh C, Dupont-Versteegden EE. Increased iron content and RNA oxidative damage in skeletal muscle with aging and disuse atrophy. Exp Gerontol. 2008;43:563–570. doi: 10.1016/j.exger.2008.02.007. [DOI] [PMC free article] [PubMed] [Google Scholar]
- Jung SH, DeRuisseau LR, Kavazis AN, DeRuisseau KC. Plantaris muscle of aged rats demonstrates iron accumulation and altered expression of iron regulation proteins. Exp Physiol. 2008;93:407–414. doi: 10.1113/expphysiol.2007.039453. [DOI] [PubMed] [Google Scholar]
- Kanner J, Harel S. Initiation of membranal lipid peroxidation by activated metmyoglobin and methemoglobin. Arch Biochem Biophys. 1985;237:314–321. doi: 10.1016/0003-9861(85)90282-6. [DOI] [PubMed] [Google Scholar]
- Kwak EL, Larochelle DA, Beaumont C, Torti SV, Torti FM. Role for NF-kappa B in the regulation of ferritin H by tumor necrosis factor-alpha. J Biol Chem. 1995;270:15285– 15293. doi: 10.1074/jbc.270.25.15285. [DOI] [PubMed] [Google Scholar]
- LaVaute T, Smith S, Cooperman S, Iwai K, Land W, Meyron-Holtz E, Drake SK, Miller G, Abu-Asab M, Tsokos M, Switzer R, 3rd, Grinberg A, Love P, Tresser N, Rouault TA. Targeted deletion of the gene encoding iron regulatory protein-2 causes misregulation of iron metabolism and neurodegenerative disease in mice. Nat Genet. 2001;27:209–214. doi: 10.1038/84859. [DOI] [PubMed] [Google Scholar]
- Leggett BA, Fletcher LM, Ramm GA, Powell LW, Halliday JW. Differential regulation of ferritin H and L subunit mRNA during inflammation and long-term iron overload. J Gastroenterol Hepatol. 1993;8:21–27. doi: 10.1111/j.1440-1746.1993.tb01170.x. [DOI] [PubMed] [Google Scholar]
- Miller LL, Miller SC, Torti SV, Tsuji Y, Torti FM. Iron-independent induction of ferritin H chain by tumor necrosis factor. Proc Natl Acad Sci U S A. 1991;88:4946–4950. doi: 10.1073/pnas.88.11.4946. [DOI] [PMC free article] [PubMed] [Google Scholar]
- Rebouche CJ, Wilcox CL, Widness JA. Microanalysis of non-heme iron in animal tissues. J Biochem Biophys Methods. 2004;58:239–251. doi: 10.1016/j.jbbm.2003.11.003. [DOI] [PubMed] [Google Scholar]
- Richardson DR, Ponka P. Development of iron chelators to treat iron overload disease and their use as experimental tools to probe intracellular iron metabolism. Am J Hematol. 1998a;58:299–305. doi: 10.1002/(sici)1096-8652(199808)58:4<299::aid-ajh9>3.0.co;2-l. [DOI] [PubMed] [Google Scholar]
- Richardson DR, Ponka P. Pyridoxal isonicotinoyl hydrazone and its analogs: potential orally effective iron-chelating agents for the treatment of iron overload disease. J Lab Clin Med. 1998b;131:306–315. doi: 10.1016/s0022-2143(98)90180-9. [DOI] [PubMed] [Google Scholar]
- Rouault TA. The role of iron regulatory proteins in mammalian iron homeostasis and disease. Nat Chem Biol. 2006;2:406–414. doi: 10.1038/nchembio807. [DOI] [PubMed] [Google Scholar]
- Seo AY, Xu J, Servais S, Hofer T, Marzetti E, Wohlgemuth SE, Knutson MD, Chung HY, Leeuwenburgh C. Mitochondrial iron accumulation with age and functional consequences. Aging Cell. 2008;7:706–716. doi: 10.1111/j.1474-9726.2008.00418.x. [DOI] [PMC free article] [PubMed] [Google Scholar]
- Simunek T, Klimtova I, Kaplanova J, Sterba M, Mazurova Y, Adamcova M, Hrdina R, Gersl V, Ponka P. Study of daunorubicin cardiotoxicity prevention with pyridoxal isonicotinoyl hydrazone in rabbits. Pharmacol Res. 2005;51:223–231. doi: 10.1016/j.phrs.2004.08.005. [DOI] [PubMed] [Google Scholar]
- Sterba M, Simunek T, Mazurova Y, Adamcova M, Popelova O, Kaplanova J, Ponka P, Gersl V. Safety and tolerability of repeated administration of pyridoxal 2- chlorobenzoyl hydrazone in rabbits. Hum Exp Toxicol. 2005;24:581–589. doi: 10.1191/0960327105ht571oa. [DOI] [PubMed] [Google Scholar]
- Torti SV, Kwak EL, Miller SC, Miller LL, Ringold GM, Myambo KB, Young AP, Torti FM. The molecular cloning and characterization of murine ferritin heavy chain, a tumor necrosis factor-inducible gene. J Biol Chem. 1988;263:12638–12644. [PubMed] [Google Scholar]
- Turrens JF. Mitochondrial formation of reactive oxygen species. J Physiol. 2003;552:335– 344. doi: 10.1113/jphysiol.2003.049478. [DOI] [PMC free article] [PubMed] [Google Scholar]
- Turturro A, Witt WW, Lewis S, Hass BS, Lipman RD, Hart RW. Growth curves and survival characteristics of the animals used in the Biomarkers of Aging Program. J Gerontol A Biol Sci Med Sci. 1999;54:B492–501. doi: 10.1093/gerona/54.11.b492. [DOI] [PubMed] [Google Scholar]
- Vashisht AA, Zumbrennen KB, Huang X, Powers DN, Durazo A, Sun D, Bhaskaran N, Persson A, Uhlen M, Sangfelt O, Spruck C, Leibold EA, Wohlschlegel JA. Control of iron homeostasis by an iron-regulated ubiquitin ligase. Science. 2009;326:718–721. doi: 10.1126/science.1176333. [DOI] [PMC free article] [PubMed] [Google Scholar]
- von Haehling S, Morley JE, Anker SD. From muscle wasting to sarcopenia and myopenia: update 2012. J Cachexia Sarcopenia Muscle. 2012;3:213–217. doi: 10.1007/s13539-012-0089-z. [DOI] [PMC free article] [PubMed] [Google Scholar]
- Wang W, Di X, D’Agostino RB, Jr, Torti SV, Torti FM. Excess capacity of theiron regulatory protein system. J Biol Chem. 2007;282:24650–24659. doi: 10.1074/jbc.M703167200. [DOI] [PubMed] [Google Scholar]
- White K, Munro HN. Induction of ferritin subunit synthesis by iron is regulated at both the transcriptional and translational levels. J Biol Chem. 1988;263:8938–8942. [PubMed] [Google Scholar]
- Whitelaw PF, Hesketh JE. Expression of c-myc and c-fos in rat skeletal muscle. Evidence for increased levels of c-myc mRNA during hypertrophy. Biochem J. 1992;281 (Pt 1):143–147. doi: 10.1042/bj2810143. [DOI] [PMC free article] [PubMed] [Google Scholar]
- Wu KJ, Polack A, Dalla-Favera R. Coordinated regulation of iron-controlling genes, H-ferritin and IRP2, by c-MYC. Science. 1999;283:676–679. doi: 10.1126/science.283.5402.676. [DOI] [PubMed] [Google Scholar]
- Xu J, Knutson MD, Carter CS, Leeuwenburgh C. Iron accumulation with age, oxidative stress and functional decline. PLoS ONE. 2008;3:e2865. doi: 10.1371/journal.pone.0002865. [DOI] [PMC free article] [PubMed] [Google Scholar]
- Xu J, Hwang JC, Lees HA, Wohlgemuth SE, Knutson MD, Judge AR, Dupont-Versteegden EE, Marzetti E, Leeuwenburgh C. Long-term perturbation of muscle iron homeostasis following hindlimb suspension in old rats is associated with high levels of oxidative stress and impaired recovery from atrophy. Exp Gerontol. 2012a;47:100–108. doi: 10.1016/j.exger.2011.10.011. [DOI] [PMC free article] [PubMed] [Google Scholar]
- Xu J, Jia Z, Knutson MD, Leeuwenburgh C. Impaired iron status in aging research. Int J Mol Sci. 2012b;13:2368–2386. doi: 10.3390/ijms13022368. [DOI] [PMC free article] [PubMed] [Google Scholar]
Associated Data
This section collects any data citations, data availability statements, or supplementary materials included in this article.