Abstract
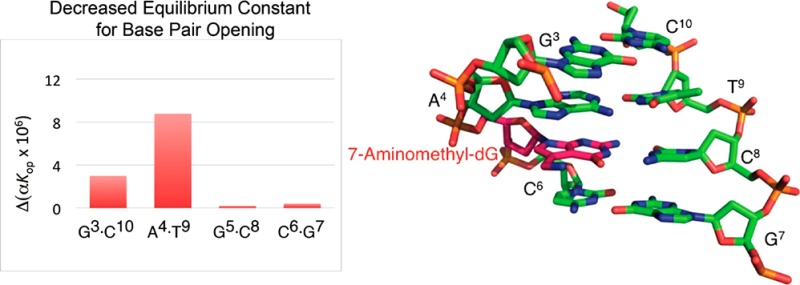
A cationic 7-aminomethyl-7-deaza-2′-deoxyguanosine (7amG) was incorporated site-specifically into the self-complementary duplex d(G1A2G3A4X5C6G7C8T9C10T11C12)2 (X = 7amG). This construct placed two positively charged amines adjacent to the major groove edges of two symmetry-related guanines, providing a model for probing how cation binding in the major groove modulates the structure and stability of DNA. Molecular dynamics calculations restrained by nuclear magnetic resonance (NMR) data revealed that the tethered cationic amines were in plane with the modified base pairs. The tethered amines did not form salt bridges to the phosphodiester backbone. There was also no indication of the amines being capable of hydrogen bonding to flanking DNA bases. NMR spectroscopy as a function of temperature revealed that the X5 imino resonance remained sharp at 55 °C. Additionally, two 5′-neighboring base pairs, A4:T9 and G3:C10, were stabilized with respect to the exchange of their imino protons with solvent. The equilibrium constant for base pair opening at the A4:T9 base pair determined by magnetization transfer from water in the absence and presence of added ammonia base catalyst decreased for the modified duplex compared to that of the A4:T9 base pair in the unmodified duplex, which confirmed that the overall fraction of the A4:T9 base pair in the open state of the modified duplex decreased. This was also observed for the G3:C10 base pair, where αKop for the G3:C10 base pair in the modified duplex was 3.0 × 10⁶ versus 4.1 × 10⁶ for the same base pair in the unmodified duplex. In contrast, equilibrium constants for base pair opening at the X5:C8 and C6:G7 base pairs did not change at 15 °C. These results argue against the notion that electrostatic interactions with DNA are entirely entropic and suggest that major groove cations can stabilize DNA via enthalpic contributions to the free energy of duplex formation.
DNA is a polyanion that is effectively neutralized with diffusible cations even at low salt concentrations.1−3 The formation of electrostatic salt bridges between the nonbridging phosphate oxygens and basic amino acids of DNA binding proteins releases cations to the bulk solvent, providing a non-sequence-specific entropic driving force for protein–DNA binding.4,5 In high-resolution crystallography, mono- and divalent cations are often observed at the major groove edge of guanines.6−11 Positively charged basic amino acid side chains are often observed at the same locations.12 The presence of diffusible and protein-tethered cations suggests that they stabilize the ensemble of nucleic acid, water, and salt. We reported that disruption of such major groove cation binding sites by the substitution of 7-deazaG (c7G)13 or 8-oxoguanine (8oG)14 was destabilizing because of a reduction in the enthalpy term that was not fully compensated by an increase in entropy. To further explore the thermodynamic role of major groove cations in DNA stability, we created a model system to recapitulate the observed locations of major groove monovalent cations by synthesizing 7-aminomethyl-7-deazaguanine (7amG)15 and incorporating it into sites with different flanking sequences.16 The covalent tethering of a cation in the major groove at c7G restored the stability of the DNA to that of the unmodified DNA.16 A 7-hydroxymethyl-7-deazaguanine (7hmG) isostere was shown to be as destabilizing as (or more destabilizing than) the c7G nucleotide, indicating the critical role of the cationic charge in the enthalpic stabilization.16 This effect was in contrast to salt bridge formation involving the phosphate backbone that is considered to be entropy-driven.17 Molecular modeling suggested that the tethered cation introduced by 7amG was located in the major groove and did not form a salt bridge with the flanking bases or backbone. In this study, this important structural feature of the model is confirmed and the local stabilization of base pairing at and flanking the 7amG nucleotide in the 5′-direction is demonstrated. This structural information supports the contention that major groove cations that do not make any electrostatic contact with the DNA can stabilize the duplex because of an enthalpic effect, which may also be used by proteins in their recognition of specific DNA sequences.
Materials and Methods
The unmodified oligodeoxynucleotides were synthesized by the Midland Certified Reagent Co. (Midland, TX) and purified by anion exchange high-performance liquid chromatography (HPLC). The phosphoramidite derivative of 7-aminomethyl-7-deaza-dG (7amG) nucleoside was synthesized as described previously15 and incorporated into 5′-d(GAGAXCGCTCTC)-3′, where X represents 7amG. The purities of the oligodeoxynucleotides were verified by HPLC using a semipreparative reverse-phase column (YMC, C18, 5 μm, 250 mm × 10.0 mm) equilibrated with 0.1 M ammonium formate (pH 7.0). All of the oligodeoxynucleotides were desalted using G-25 Sephadex, lyophilized, and characterized by matrix-assisted laser desorption ionization time-of-flight mass spectrometry (calculated mass for [M – H]−m/z 3674.5, found m/z 3674.8). The oligodeoxynucleotides were annealed in appropriate buffers, being heated to 85 °C for 15 min and and cooled to room temperature. The oligodeoxynucleotide concentrations were determined by UV absorbance at 25 °C using an extinction coefficient of 1.11 × 10⁵ M–1 cm–1 at 260 nm.18
NMR
The modified and unmodified samples were dissolved to a duplex concentration of 0.25 mM in 180 μL of 200 mM NaCl, 50 μM Na2EDTA, and 10 mM NaH2PO4 (pH 7.0). The samples were exchanged with D2O and dissolved in 180 μL of 99.99% D2O to observe nonexchangeable protons in the spectra. For the observation of exchangeable protons, the samples were dissolved in 180 μL of a 9:1 H2O/D2O mixture. The NOESY and DQF-COSY spectra of samples in D2O were collected at 25 °C on a Bruker AV-III 800 MHz spectrometer using a CPTCI probe. For the assignment of exchangeable protons, NOESY experiments with mixing times of 150, 200, and 250 ms and TPPI quadrature detection were conducted. These data were recorded with 2048 real data points in the t2 dimension and 1024 data points in the t1 dimension. The relaxation delay was 2.0 s. The data in the t1 and t2 dimension were zero-filled to give a matrix of 2K × 2K real points. The NMR spectra for the exchangeable protons were recorded at 5, 15, 25, 35, 45, 55, and 65 °C on a Bruker AV-III 600 MHz spectrometer equipped with a CPQCI probe. The NOESY19,20 spectra of unmodified and modified samples in H2O were collected at 5 °C with mixing times of 70 and 250 ms at 600 MHz. Water suppression was achieved by a gradient Watergate pulse sequence.21 Chemical shifts were referenced to water. NMR data were processed with TOPSPIN version 2.0.b.6 (Bruker Biospin Inc., Billerica, MA).
Experimental Distance Restraints
The volumes of cross-peaks for the NOESY spectrum recorded at a mixing time of 250 ms were obtained using SPARKY.22 These were combined with intensities generated from the complete relaxation matrix analysis of a starting structure23 to generate a hybrid intensity matrix. To refine the hybrid intensity matrix and optimize the agreement between calculated and experimental NOE intensities, MARDIGRAS24 was used. The RANDMARDI25 algorithm conducted 50 iterations for each set of data, randomizing peak volumes within limits specified by the input noise level. The molecular motion was assumed to be isotropic. The volume error was defined as one-half the volume of the weakest cross-peak. Calculations were performed using a B-DNA initial structure26 generated using INSIGHT II (Accelyris, Inc., San Diego, CA), and NOE intensities derived from experiments with a mixing time of 250 ms, and with three isotropic correlation times (2, 3, and 4 ns), yielding three sets of distances. Analysis of these data yielded the experimental distance restraints and standard deviations for the distance restraints used in subsequent restrained molecular dynamics calculations. For partially overlapped cross-peaks, the upper bounds on the distances were increased. Additional empirical restraints for base pair, phosphodiester backbone, and deoxyribose pseudorotation were obtained from canonical values derived from B-type DNA.26
Restrained Molecular Dynamics (rMD) Calculations
Classical B-DNA26 was used as the reference to create the starting structure for rMD calculations. The 7amG adduct was constructed by bonding the aminomethyl group to the C7 atom on the G5 nucleotide in both strands, using INSIGHT II. The coordinates, connectivity, and parameters for the models were obtained from xLEaP.27 The restrained electrostatic potential charges for the 7amG adduct were calculated with the B3LYP/6-31G* basis set using GAUSSIAN.28 The starting structure was energy minimized for all atoms using AMBER.29 The rMD calculations were performed with AMBER29 using a simulated annealing protocol with the parm99 force field.30 Calculations performed in vacuo were initiated by coupling to a heating bath with a target temperature of 600 K. The generalized Born method was used to model solvation.31,32 The force constants for empirical hydrogen bonding and all NOE restraints were maintained at 32 kcal mol–1 Å–2. Initially, 20000 steps of a simulated annealing protocol were performed. The system was heated from 0 to 600 K for the first 1000 steps, with a coupling of 0.5 ps. During steps 1001–2000, the system was maintained at 600 K and then cooled to 100 K over 18000 steps with a coupling of 4 ps. The final cooling from 100 to 0 K during steps 18001–20000 was performed with a coupling of 1 ps. Subsequently, a 100000-step simulated annealing protocol with an integrator time step of 1 fs was performed. The system was heated to 600 K in 5000 steps, maintained at 600 K for 5000 steps, and then cooled to 100 K with a time constant of 4.0 ps over 80000 steps. A final cooling stage was applied to relax the system to 0 K with a time constant of 1.0 ps over 10000 steps. After each cycle, a set of structural coordinates was saved for energy minimization. To obtain an average structure, 10 emergent structures were chosen on the basis of the lowest deviations from the experimental distance and dihedral restraints and were energy minimized. Back-calculations of theoretical NMR intensities from the emergent structure were performed using CORMA.33
Measurement of Base Pair Opening
NMR data were collected at 15 °C at 500 MHz using a Bruker AV-III spectrometer equipped with a 5 mm CPQCI probe. The samples were dissolved in 180 mL of a 90% H2O/10% D2O solution containing 100 mM NaCl, 0.05 mM Na2EDTA, 0.011 M NaN3, 1 mM triethanolamine, and 10 mM NaH2PO4 (pH 8.0). The transfer of magnetization from water to the imino protons was followed by observation of the imino protons after a variable mixing time.34 For selective spin inversion of the water protons, a 2 ms 180° sinc pulse with 1000 points was used. To minimize effects of radiation damping during the mixing time, a 0.1 G/cm gradient was used. Water suppression was achieved by a binominal 1–1 echo sequence, jump and return,35 with flanking 1 ms smooth square shape gradients, 15 G/cm. Sixteen values of the variable delay ranging form 1 ms to 15 s were used for each experiment. All data were processed and analyzed with TOPSPIN. Ammonia was used as the acceptor because of its small size and lack of charge and to minimize catalysis due to the presence of OH– ions.34 The ammonia-catalyzed exchange was measured at pH 8.36−40 The ammonia was titrated from stock solutions, with concentrations that ranged from 0.1 to 5 M. The DNA samples contained 1 mM triethanolamine, which was used to monitor the pH of the NMR sample during the titration, in situ, by measuring the chemical shift difference between the two methylene groups.36 The pKa of 9.22 for ammonia at 15 °C was used. The concentration of the ammonia base was calculated from the total ammonia concentration (c0) and the pH as
| 1 |
The data analysis and fits were performed using PRISM version 6.0b (GraphPad Software, Inc., La Jolla, CA). The exchange rates in the absence and presence of added ammonia were calculated from the equation
| 2 |
where Iz(tmix) and Iz,eq are intensities of the imino proton peaks at a given value of tmix and at equilibrium, respectively, kex is the chemical exchange rate, R1w is the longitudinal relaxation rate of water, 3.15 s as determined separately under the same conditions, R1i is the sum of the imino proton relaxation rate and kex, and E is the efficiency of water inversion using the value of −2.41,42 In general, equilibrium constants for base pair opening were calculated by fitting the imino exchange rate data as a function of ammonia concentration to the equation36
| 3 |
where Kop is the equilibrium constant for base pair opening, kop and kcl are the rates for base pair opening and closing, respectively, and kB is the rate constant for exchange catalysis calculated as described by Parker and Stivers.42
Data Deposition
Complete structure factor and data coordinates were deposited in the Nucleic Acid Database (http://ndbserver.rutgers.edu) as PDB entry 2LIA.
Results
Sample Characterization
The [5′-d(GAGAXCGCTCTC)-3′]2 duplex, in which X = G (OL-1a) or 7amG (OL-1b) (Scheme 1), is self-complementary with a pseudodyad axis of symmetry. Thermal melting studies of the OL-1b duplex at a strand concentration of 7 μM indicated a single melting transition with a Tm of 52 °C at 10 mM NaCl and a Tm of 67 °C at 100 mM NaCl. No evidence of a second thermal melting transition, corresponding to the formation of an intramolecular hairpin, was observed.16 A series of 1H NMR spectra were recorded as a function of temperature. These exhibited a single set of imino resonances with good spectral resolution suitable for NMR analyses.
Scheme 1. (A) Structure of the X = 7-Aminomethyl-7-deaza-dG (7amG) Modification and (B) Sequences and Numbering of the Nucleotides for Unmodified OL-1a and Modified OL-1b Duplexes.
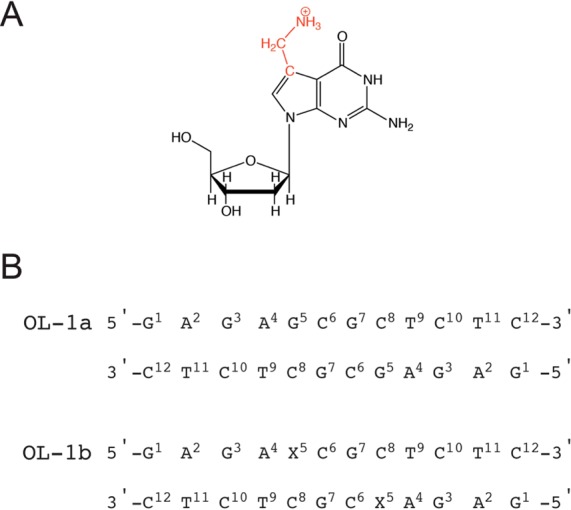
The 7-aminomethyl moiety is colored red.
NMR Assignments
Nonexchangeable DNA Protons
The sequential assignment was accomplished using standard protocols.43,44 An expanded plot of NOE sequential connectivity between the base protons and the deoxyribose H1′ protons exhibited sharp and generally well-resolved cross-peaks (Figure 1). However, there was substantial spectral overlap involving T9 and T11 H6. All sequential NOEs from G1 to C12 were observed. No NOEs showed unusual intensities. At A4, X5, and C6, the NOE cross-peak intensities between the base protons and the deoxyribose H1′ protons were of the same relative magnitudes as those between other bases in the sequence. The 7amG H8 resonance was observed at 6.4 ppm, shifted upfield by approximately 1 ppm with respect to that of the unmodified oligodeoxynucleotide. This was attributed to the differential electronic density for c7G as compared to G. Proton resonances from the neighboring A4 and C6 bases exhibited chemical shift changes of <0.1 ppm, compared with those bases in the unmodified OL-1a duplex. The chemical shifts of the oligodeoxynucleotide nonexchangeable protons are provided in Table S1 of the Supporting Information.
Figure 1.
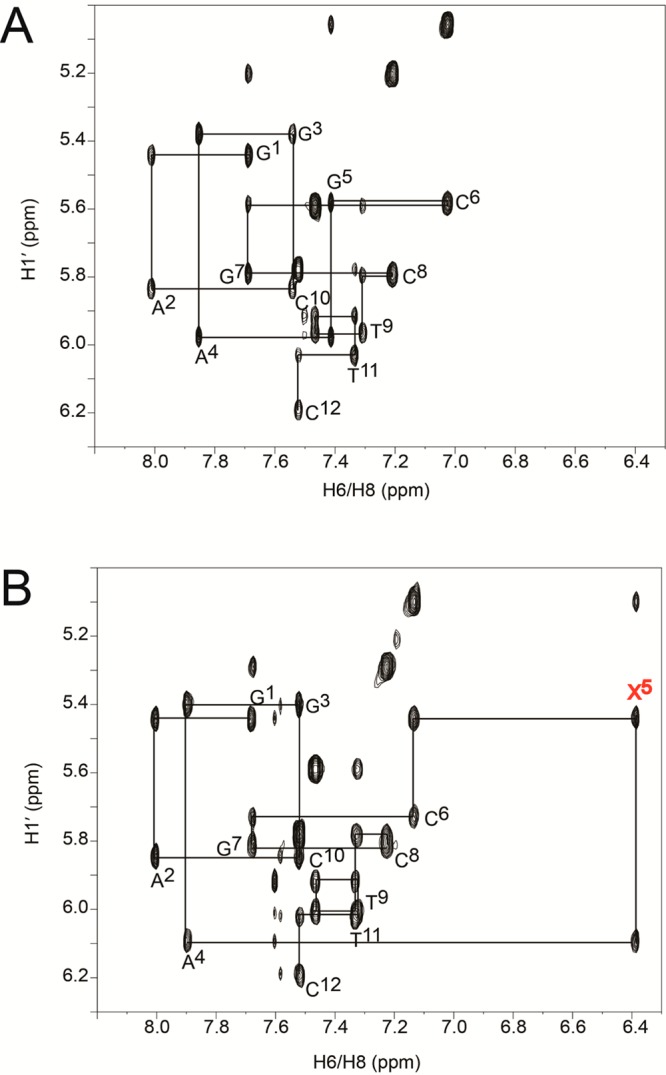
Expanded plots from the aromatic–anomeric region of the 800 MHz NOESY spectra. (A) Sequential NOEs between base aromatic and deoxyribose H1′ protons for the OL-1a duplex. (B) Sequential NOEs between base aromatic and deoxyribose H1′ protons for the OL-1b duplex. The data were collected at 25 °C.
Aminomethyl Protons
The methylene proton resonances of the 7-aminomethyl moiety of c7G were assigned from an analysis of COSY and NOESY spectra. The NOESY spectrum for the OL-1b duplex is shown in Figure 2. Two intense resonances at 3.4 and 3.6 ppm were assigned to the methylene protons. Their stereotopic assignments could not be made. Both of the methylene protons exhibited intense NOEs to imidazole protons A4 H8 and X5 H8. Weaker NOEs were observed from the methylene protons to the A4 deoxyribose H1′, H2′, H2″, and H3′ protons. Weak NOEs between the methylene protons and C6 H5 were also observed.
Figure 2.
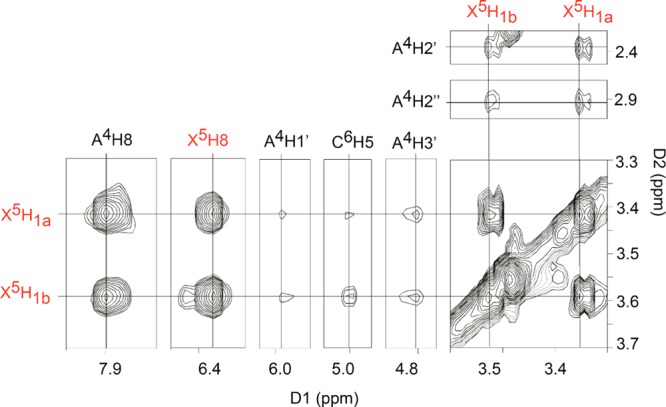
Expanded plot from the 800 MHz NOESY spectrum showing the assignment of the 7amG methylene protons in the OL-1b duplex. The data were collected at 25 °C.
Exchangeable Protons
Figure 3 shows the NOESY spectra for the OL-1a and OL-1b duplexes in the far downfield region of the base imino resonances, showing connectivity of the purine N1H and pyrimidine N3H imino protons. For both duplexes, the resonances were assigned on the basis of their sequential connectivity in NOESY spectra. In both instances, these assignments were supported by their NOE cross-peaks to Watson–Crick base-paired amino protons.45 For the OL-1a duplex, the sequential connectivity was obtained from base pairs G3:C10 → A4:T9 → G5:C8 → C6:G7. Likewise, for the OL-1b duplex, the sequential connectivity was obtained from base pairs G3:C10 → A4:T9 → X5:C8 → C6:G7. The imino resonance from X5 in the OL-1b duplex shifted downfield by 0.2 ppm compared to that of the OL-1a duplex. For both duplexes, the imino proton resonances of the G1:C12 terminal base pair and the A2:T11 penultimate base pair were broadened, which was attributed to rapid exchange with water.
Figure 3.
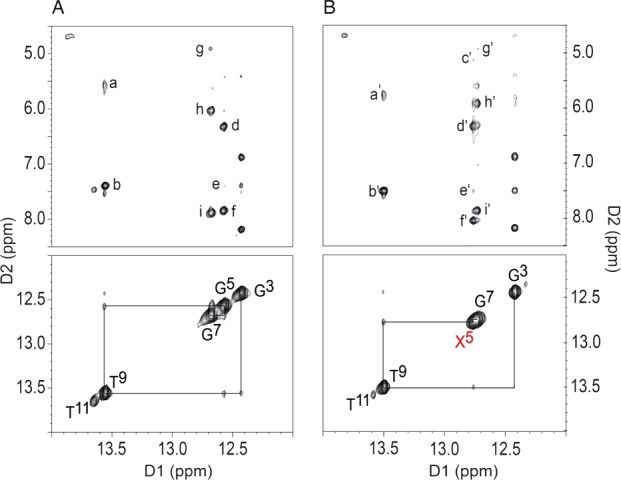
Expanded plots from the 600 MHz NOESY spectra showing NOE connectivity of the guanine N1H and thymine N3H imino protons (lower panels) and the cytosine N4H and adenine N6H amino protons (upper panels). (A) The OL-1a duplex. The cross-peaks are assigned as: a, T9 N3H → A4N6H2; b, T9 N3H → A4 H2; c, G5 N1H → C8 H5; d, G5 N1H → C8N4H1; e, G5 N1H → A4 H2; f, G5 N1H → C8N4H2; g, G7 N1H → C6 H5; h, G7 N1H → C6N4H1; i, G7 N1H → C6N4H2. (B) The OL-1b duplex. The X5 imino resonance is shown in red. The cross-peaks are assigned as: a′, T9 N3H → A4N6H2; b′, T9 N3H → A4 H2; c′, X5 N1H → C8 H5; d′, X5 N1H → C8N4H1; e′, X5 N1H → A4 H2; f′, X5 N1H → C8N4H2; g′, G7 N1H → C6 H5; h′, G7 N1H → C6N4H1; i′, G7 N1H → C6N4H2. The spectra were collected at 5 °C.
Restrained Molecular Dynamics Calculations
A total of 211 experimentally determined NOEs involving the nonexchangeable protons of OL-1b were obtained and converted to experimental distance restraints using MARDIGRAS.24 Of the experimental distance restraints, 114 were intranucleotide restraints and 97 were internucleotide restraints. These are summarized in Table S2 of the Supporting Information. There were a total of 31 experimental distance restraints involving the 7amG base. The spectral overlap involving T9 and T11 H6 (Figure 1) resulted in greater errors in estimating a number of intra- and internucleotide NOEs involving nucleotides T9, C10, and T11. Additional NOEs involving exchangeable protons that did not have a distance calculated by MARDIGRAS were estimated by examining relative peak intensities. The experimental distance restraints were combined with 52 empirical base pairing restraints, and 200 empirical torsion angle restraints, involving the deoxyribose torsion angles and the phosphodiester backbones (Tables S3–S5 of the Supporting Information). The utilization of these empirical base pairing and torsion angle restraints was predicated upon the observation that minimal spectroscopic changes were noted for the OL-1b duplex as compared to the unmodified OL-1a duplex, suggesting that the target structure must be similar to that of canonical B-form DNA, with regard to the conservation of Watson–Crick base pairing and propeller twisting between base pairs. Likewise, it was anticipated that the phosphodiester backbone geometry of canonical B-form DNA was maintained and that the 2′-deoxyribose pseudorotation equilibria remained predominately in the C2′-endo conformation associated with B-form DNA.
To determine the structure of the modified OL-1b duplex, a series of restrained molecular dynamics calculations, using a simulated annealing protocol, and employing the experimental and empirical distance and dihedral angle restraints, was performed. The calculations were initiated from energy-minimized B-form DNA starting structures. The target temperature was 600 K. The convergence of the rMD calculations was assessed for structures having the smallest number of deviations from the experimental distance and dihedral restraints, the lowest van der Waals energies, and the lowest overall energies. Finally, the emergent structures were subjected to 250 iterations of potential energy minimization without restraints and superimposed to obtain the average structure. Figure 4 shows these superimposed structures, and Figure 5 shows the average structure. The structural refinement statistics are summarized in Table 1.
Figure 4.
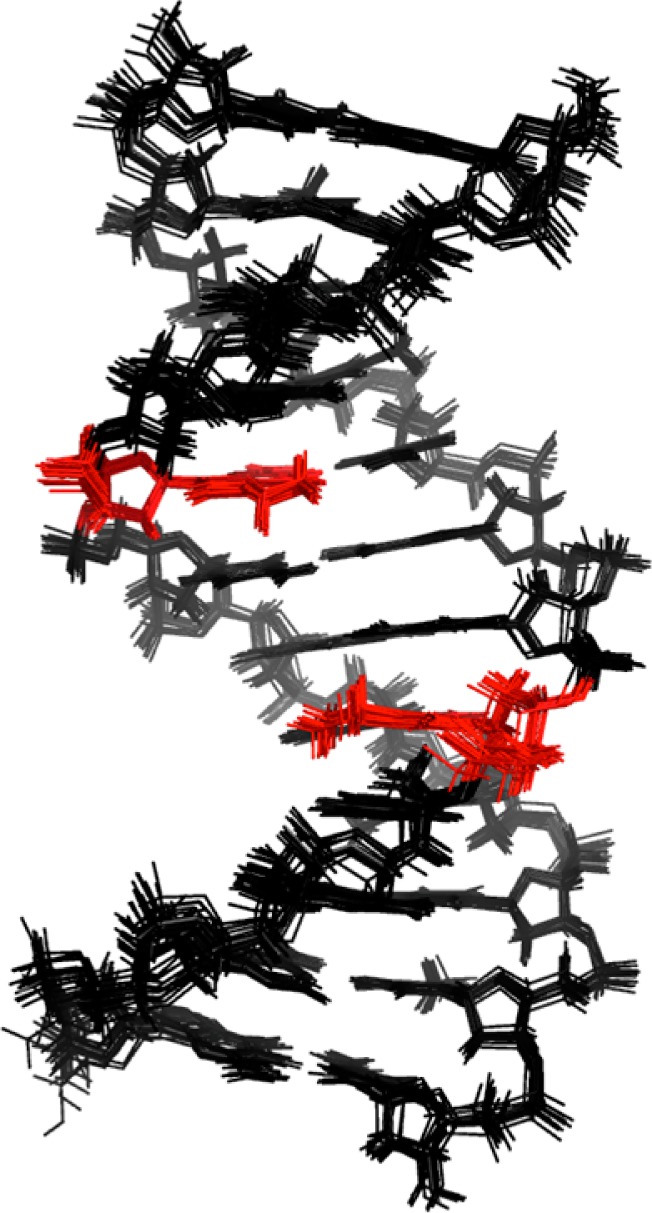
Superposition of emergent structures from the rMD calculations, for the OL-1b duplex. Nucleotide X5 is colored red.
Figure 5.
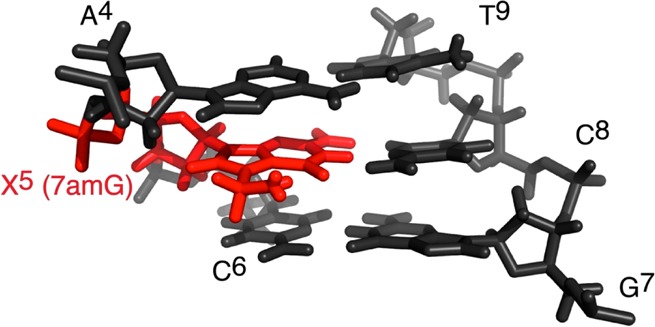
Expanded view of the average potential energy-minimized conformation for the OL-1b duplex emergent from the rMD calculations, viewed from the major groove. Nucleotide X5 is colored red.
Table 1. NMR Restraints and Statistical Analysis of the Refined Structure of the OL-1b Duplex.
| NMR restraints (no.) | |
| total restraints for rMD calculations | 772 |
| experimental NOE distance restraints | 211 |
| intranucleotide NOE restraints | 114 |
| internucleotide NOE restraints | 97 |
| restraints of 7amG base | 31 |
| empirical base pair restraints | 52 |
| empirical torsion angle restraints | 200 |
| backbone torsion angle restraints | 100 |
| deoxyribose torsion angle restraints | 100 |
| structure refinement statisticsa | |
| no. of distance restraint violations | 54 |
| no. of torsion restraint violations | 11 |
| total distance penalty/maximal penalty (kcal/mol) | 2.84/0.01 |
| total torsion penalty/maximal penalty (kcal/mol) | 1.13/0.30 |
| distant restraint force field (kcal mol–1 Å–2) | 32 |
| torsion restraint force field (kcal mol–1 deg–2) | 32 |
| NMR R factor (Rx) (×10–2)b | 8.89 |
| intranucleotide NOEs | 6.13 |
| internucleotide NOEs | 12.6 |
| root-mean-square deviation of refined structures (on all atoms) | 0.45 |
The mixing time used to calculate Rx was 250 ms.
Rx = ∑|(a0)i1/6 – (ac)i1/6|/|(a0)i1/6|, where a0 and ac are the intensities of observed (non-zero) and calculated NOE cross-peaks, respectively.
The precision of the rMD calculations was determined by pairwise root-mean-square deviation (rmsd) calculations of the emergent structures, following potential energy minimization. The greatest pairwise rmsd value was 0.45 Å. The accuracy of the rMD calculations with respect to interproton distances was examined by calculations of theoretical NMR intensities from the emergent average structure using CORMA33 (Figure 6). At nucleotides T9, C10, and T11 in the complementary strand, where spectral overlap prevented more accurate distance measurements from being obtained, the structure was less well refined, as was indicated by the somewhat higher Rx values. Nevertheless, the total sixth-root residual Rx value for the OL-1b duplex was 0.089. The overall intra- and internucleotide sixth-root residual Rx values were 0.061 and 0.126, respectively (Table 1). Thus, the calculated NOE intensities for the average structure showed satisfactory agreement with the experimental NOE data.
Figure 6.
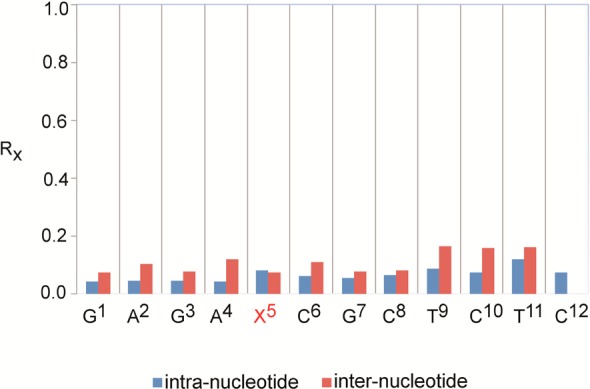
Nucleotide-by-nucleotide Rx sixth-root residuals calculated for the average refined structure of the OL-1b duplex.
Structure of the 7amG-Modified DNA Duplex
The average energy-minimized structure emergent from the rMD calculations was a right-handed duplex with the 7amG aminomethyl moiety located in the major groove (Figures 4 and 5). The cationic amine was 2.8 Å from the major groove face of the modified guanine and was in plane with the X5:C8 base pair. Watson–Crick base pairing at the X5:C8 base pair was intact. No changes in Watson–Crick base pairing were observed elsewhere in the duplex. Figure 7 shows base stacking interactions within the central segment of the OL-1b duplex. The presence of the 7amG modification did not substantially alter base stacking interactions with either the 5′-neighboring A4:T9 base pair or with the 3′-neighboring C6:G7 base pair. The results of helicoidal analysis for the OL-1b duplex conducted with Curves+46 are provided in Tables S6 and S7 and Figure S1 of the Supporting Information.
Figure 7.
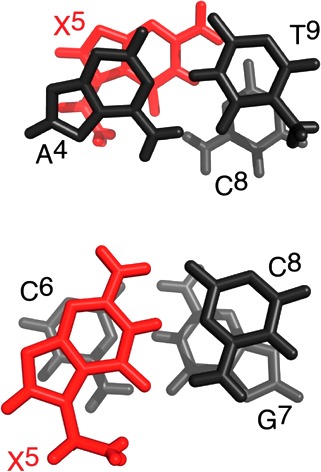
Expanded view of the average structure obtained from the rMD calculations of the OL-1b duplex, showing base stacking interactions: (top) stacking of base pair A4:T9 above base pair X5:C8 and (bottom) stacking of base pair X5:C8 above base pair C6:G7. The X5 base is colored red.
Thermodynamic Analysis
A series of temperature-dependent NMR experiments were performed monitoring the Watson–Crick base-paired guanine N1H and thymine N3H imino proton resonances (Figure 8). In the OL-1b duplex, the X5:C8 base pair N1H imino proton resonance remained sharp at 55 °C, which was consistent with the stabilization effect of 7amG.16 In addition, in the OL-1b duplex at the 5′-flanking A4:T9 base pair, the N3H imino proton resonance was visible at 45 °C, while it was broadened in the unmodified OL-1a duplex. A similar effect was observed for the G3:C10 N1H imino proton, which was visible in the modified OL-1b duplex but broadened at 45 °C in the OL-1a duplex. At 65 °C, neither duplex was completely denatured, which was consistent with thermal melting UV experiments.16 The temperature dependencies on the line widths for base pairs of the unmodified and modified duplexes are compared in Figure S2 of the Supporting Information.
Figure 8.
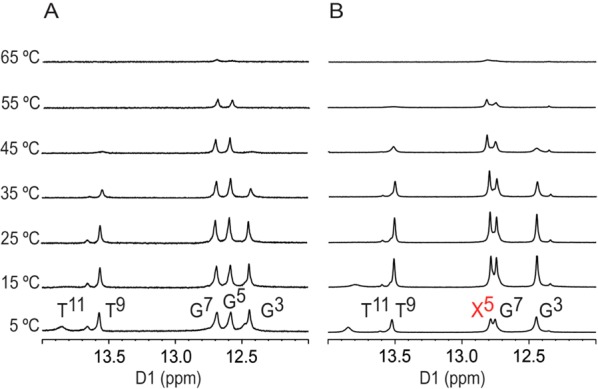
Expansions of 1H NMR spectra showing the imino proton resonances as a function of temperature for (A) the OL-1a duplex and (B) the OL-1b duplex. The X5 imino resonance is colored red. The 600 MHz spectra were collected at 15 °C.
Base Pair Opening
To quantitatively examine base pair opening, the transfer of magnetization from water after variable times was followed by the observation of the guanine N1H and thymine N3H imino protons at 15 °C.34 The imino proton exchange rates were measured in the absence or presence of added ammonia base catalyst34,36 (Figure 9). In general, the exchange of nucleic acid imino protons with solvent follows a two-state model in which the base pair undergoes a conformational change from a closed to an open state, in which the chemical exchange occurs.34 The base pair opened state is exchange competent because the imino proton is accessible to proton acceptors present in solution. As described by Russu and co-workers,47,48 in the EX1 regime, the concentration of proton acceptors is high enough for rapid exchange from the open state (kex,open ≫ kcl), so chemical exchange occurs at each opening event and kex = kop. In the EX2 regime, where the concentration of base catalyst is low (kex,open ≪ kcl), the rate of exchange from the open state is proportional to the observed exchange rate and proton acceptor.47,48
Figure 9.
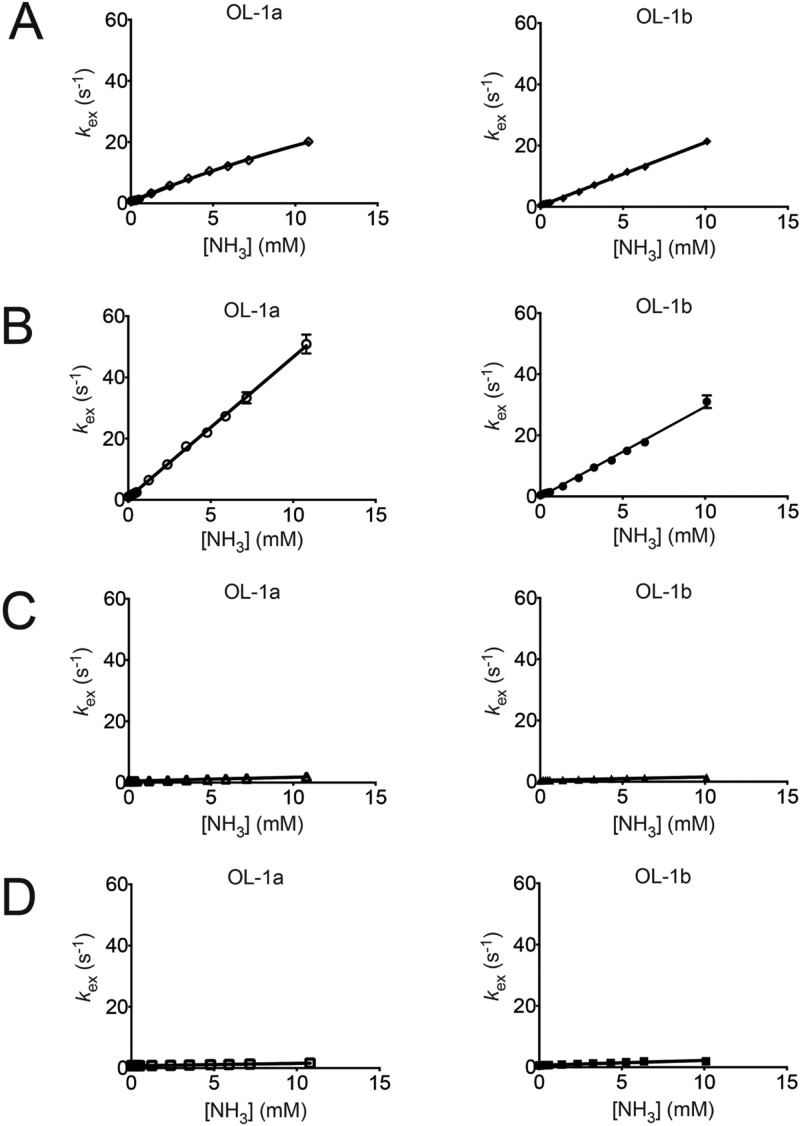
Plots of imino proton exchange rates, kex, obtained by monitoring the transfer of magnetization from water as a function of added ammonia base catalyst. (A) The left panel shows base pair G3:C10 in the OL-1a duplex, and the right panel shows base pair G3:C10 in the OL-1b duplex. (B) The left panel shows base pair A4:T9 in the OL-1a duplex, and the right panel shows base pair A4:T9 in the OL-1b duplex. (C) The left panel shows base pair G5:C8 in the OL-1a duplex, and the right panel shows base pair X5:C8 in the OL-1b duplex. (D) The left panel shows base pair C6:G7 in the OL-1a duplex, and the right panel shows base pair C6:G7 in the OL-1b duplex.
The OL-1b DNA duplex contained the protonated 7amG modification, and we desired to minimize the potential for deprotonation of the latter. Consequently, we decided to work at pH 8. The work of Russu and co-workers36−40 provided precedent. However, at pH 8, the concentration of ammonia base that could be attained during the course of the titrations was limited. During the titrations, the concentration of ammonia base was calculated taking into account the pKa of ammonia at 15 °C and the pH.36 The samples contained triethanolamine as an internal standard, allowing the pH to be monitored, in situ. The pH remained within the range of 8.0–8.2 during the course of the titrations. Additional titrations were conducted on the unmodified OL-1a duplex at pH 9. For the 7amG nucleotide in the OL-1b duplex, the N7 purine has been replaced with a carbon atom. Consequently, NMR was used to examine the imino proton pKa values for the OL-1b duplex. For the 7amG nucleotide, the N1H imino proton pKa was 9.5, somewhat greater than the typical guanine pKa of 9.2. The 7amG nucleotide did not alter the imino proton pKa values of the neighboring base pairs.
Figure 9 shows imino proton exchange rates measured in the absence or presence of added ammonia base catalyst for base pairs G3:C10, A4:T9, G5:C8, and C6:G7 in the OL-1a duplex and base pairs G3:C10, A4:T9, X5:C8, and C6:G7 in the OL-1b duplex. The initial NMR spectra were collected in the absence of ammonia. For both duplexes, OL-1a and OL-1b, it was observed that the measured kex rates increased most rapidly for base pair A4:T9 as ammonia was added. Of the three G:C base pairs that were monitored, the measured kex rates increased most rapidly for base pair G3:C10, which was located between two A:T base pairs. The two central core G:C base pairs, G5:C8 and C6:G7, showed only small increases in kex over the course of the ammonia titrations (Figure 9). With the exception of base pair G3:C10 in the unmodified OL-1a duplex, a linear relation between the ammonia catalyst concentration and kex was observed in all instances. This indicated the presence of the EX2 regime,38,47 for which the concentration of base catalyst was low (kex,open ≪ kcl), and the rate of exchange from the open state was proportional to the observed exchange rate and proton acceptor. For these base pairs at 15 °C and pH 8, chemical exchange was the rate-limiting step and the EX1 base pair opening-limited exchange regime38,47 was not achieved at the highest ammonia concentrations that could be attained. Therefore, only equilibrium constants for base pair opening were determined, by fitting the exchange rates as a function of ammonia concentration as described by eq 3.36,42 The exception was base pair G3:C10 in the unmodified OL-1a duplex (Figure 9). For this base pair, data at low concentrations of ammonia, which exhibited a linear relation between the ammonia catalyst concentration and kex, were fit to eq 3. At the highest concentrations of ammonia, the imino proton exchange rate for base pair G3:C10 in the unmodified OL-1a duplex appeared to be approaching the EX2 regime. Thus, the kex data over the complete range of ammonia concentrations for base pair G3:C10 in the unmodified duplex were also fit to the equation kex = (kopkB[B])/(kcl + kB[B]).38 Figure S3 of the Supporting Information shows representative time courses of transfer of solvent magnetization to the imino protons.
At 15 °C, the equilibrium constants for base pair opening at base pair X5:C8 in the OL-1b duplex and base pair G5:C8 in the OL-1a duplex were both 0.2 × 10⁶. Thus, the aminomethyl moiety in the OL-1b duplex did not alter the thermodynamics of base pair opening at this site. However, the thermodynamics of base pair opening at both the 5′-neighbor base pair A4:T9 and the next nearest 5′-neighbor base pair G3:C10 were altered by the aminomethyl moiety. The equilibrium constant for base pair opening, αKop, for base pair A4:T9 in the modified OL-1b duplex was 8.8 × 10⁶, as compared to the αKop value of 13.8 × 10⁶ for base pair A4:T9 in the unmodified OL-1a duplex. This suggested that the overall fraction of time the A4:T9 base pair of the modified OL-1a duplex was exposed to the solution was reduced, reflecting a reduced probability of imino proton exchange. Similarly, in the modified OL-1b duplex, αKop for the G3·C10 base pair was 3.0 × 10⁶ versus 4.1 × 10⁶ for the same base pair in the unmodified OL-1a duplex.
Discussion
The incorporation of 7amG into the OL-1b duplex precisely positions a cationic charge into the major groove of DNA. This allows the study of thermodynamic and conformational changes induced by site-specific modulation of DNA groove electrostatics. Thermodynamic parameters for the modified OL-1b duplex obtained by UV melting and differential scanning calorimetry (DSC) analyses16 revealed that the 7amG substitution in the OL-1b duplex was stabilizing relative to the unmodified OL-1a duplex (ΔΔG = 2.2 kcal/mol), which was attributed to an enthalpic effect (ΔΔH = 14.7 kcal/mol).16 This contrasts with nonspecific electrostatic effects, which are generally believed to be entropy-driven.17
Structural Basis for Stabilization of DNA by 7amG Substitution
The stabilization of the 7amG-modified OL-1b duplex16 not only involves the modified X5:C8 base pair but also extends in the 5′-direction relative to X5, to involve the A4:T9 and G3:C8 base pairs. Qualitatively, this can be observed in NMR spectra collected as a function of temperature (Figure 8). For the modified OL-1b duplex, the thymine N3H imino proton resonance of the A4:T9 base pair remains visible at 45 °C, whereas in the unmodified OL-1a duplex, this resonance is exchange broadened at 45 °C. Likewise, for the modified OL-1b duplex at 45 °C, the guanine N1H imino proton resonance of base pair G3:C8 is visible, but for the unmodified Ol-1a duplex, the guanine N1H imino proton resonance of the G3:C8 base pair is broadened.
The exchange data provide a quantitative measure of the stabilization of the modified OL-1b duplex16 at the X5:C8 base pair and extending in the 5′-direction. At 15 °C, no change in αKop is observed at the X5:C8 modified base pair (Table 2), which suggests that the four G:C base pairs comprising the central core of the OL-1b duplex are stable. This is consistent with the Tm of 65 °C measured for this duplex.16 In contrast, a significant change is observed for the 5′-neighbor A4:T9 base pair (Table 2), for which the value of αKop decreases from 13.8 × 10⁶ to 8.8 × 10⁶ in the presence of the cationic amine at base pair X5:C8. Likewise, at base pair G3:C10, the value of αKop decreases from 4.1 × 10⁶ to 3.0 × 10⁶ in the presence of the cationic amine tethered at base pair X5:C8. The opposite effect occurs in the 3′-direction. Thus, at base pair C6:G7, the value of αKop increases from 0.2 × 10⁶ to 0.4 × 10⁶ in the presence of the cationic amine tethered at base pair X5:C8. This may be explained by weakened nonspecific cation binding at base pair C6:G7 in the presence of the cationic amine tethered at base pair X5:C8, caused by coulombic repulsion.
Table 2. Calculated Imino Proton Exchange Rates in the Absence of Added Catalyst and Equilibrium Constants for Base Pair Opening, for Base Pairs G3:C10, A4:T9, G5:C8, and C6:G7 in the OL-1a and OL-1b Duplexesa.
|
kex (s–1)b |
αKop ×
106 |
|||
|---|---|---|---|---|
| base | OL-1a | OL-1b | OL-1a | OL-1b |
| G3 | 0.8 ± 0.1 | 0.5 ± 0.1 | 4.1 ± 0.2 | 3.0 ± 0.04 |
| T9 | 1.1 ± 0.05 | 0.5 ± 0.03 | 13.8 ± 0.1 | 8.8 ± 0.2 |
| G5 | 0.5 ± 0.06 | 0.4 ± 0.04 | 0.20 ± 0.002 | 0.20 ± 0.004 |
| G7 | 0.7 ± 0.08 | 0.5 ± 0.03 | 0.20 ± 0.002 | 0.40 ± 0.007 |
Measured at 15 °C.
The observed exchange rate without addition of ammonia catalyst.
Structure of the 7amG-Modified OL-1b Duplex
The location of the cationic amine of 7amG 2.8 Å from the major groove face of the modified guanine and in plane with the X5:C8 base pair is within the range observed in crystal structures for diffusible cations,6−11 and cationic groups on basic amino acid residues of DNA-interacting proteins.49−51 The location of the tethered NH3+ ion is such that it cannot make a salt bridge contact with the phosphate backbone because the nearest phosphate oxygen is >5 Å away. Moreover, the cationic amine is not located within H-bonding distance of the flanking base pairs. If H-bonding were an important factor in the stabilization, then this would have been observed for the hydroxymethyl analogue. This was not the case.16 There is also no evidence of a change in major groove dimension because of the collapse of the phosphate backbone onto the tethered cation, as has been predicted for divalent cations as a source of DNA bending.17
The NMR data indicate that the site-specific positioning of this cationic amine does not greatly alter the structure of the OL-1b duplex, as compared to the unmodified OL-1a duplex. This suggests that the enthalpic stabilization of the OL-1b duplex by the 7amG modification16 is not due to intrinsic differences in either base stacking or Watson–Crick hydrogen bonding (Figure 7). Figure 1 reveals only minor chemical shift changes for the base aromatic and deoxyribose H1′ protons of the two duplexes. A comparison of the chemical shifts of the Watson–Crick imino base-paired protons and amino base-paired protons (Figure 3) also shows minimal differences between the OL-1a and OL-1b duplexes, consistent with the conclusion that the site-specific positioning of the tethered amine in the major groove has a negligible effect upon the structure of this duplex in solution.
Site-Specific Positioning of Cations in the DNA Major Groove
Studies of the regioselectivity of DNA alkylation at the N7-dG position by a series of alkylating agents have revealed that compounds reacting with DNA via methanediazonium ion (CH3N2+) intermediates, such as methylnitrosourea (MNU),52 produce sequence-dependent alkylation patterns.53−55 Similar patterns have been observed for nitrogen mustards,56N-nitrosoureas,57,58 and triazenes.59 These effects are muted if the alkylation is conducted in ssDNA versus dsDNA.60 Collectively, these data suggest that at the microscopic level, the electrostatic landscape of DNA exhibits major groove sequence specificity,61 in addition to the counterion condensation theory of overall DNA charge neutralization,1−3 which is not predicted to exhibit sequence specificity.
Braunlin and co-workers6,62,63 have shown that di- and trivalent ions, including Mg2+, Ca2+, and Co3+, preferentially associate with the major groove of DNA at dG:dC base pairs, and they have proposed that neighboring dG’s provide sequence-specific divalent cation binding sites because they can exploit the spatial relationship between the N7 and O6 atoms of the dG base.6 High-resolution crystallographic experiments often allow the observation of specific cations in the major groove near dG:dC base pairs and in the minor groove near dA:dT base pairs.11 The self-complementary DDD has been crystallized in the presence of Tl+, providing the precise placement of site-specific cations in the major groove,10 which are at locations similar to that observed herein for the 7amG-modified OL-1b duplex.
The replacement of the N7 atom on guanine with carbon alters the electronic properties of the heterocycle. It also eliminates a major groove cation-binding site and removes a potential hydrogen bond acceptor site. Thus, one would anticipate that the introduction of a 7-deaza-dG nucleotide might destabilize the duplex. This has been demonstrated for the [d(GXAATTCC)]2 duplex, where X = 7-deaza-dG. Indeed, incorporation of 7-deaza-dG into the DDD [d(CGCGAATTCXCG)]2, where X = 7-deaza-dG, revealed a thermodynamic effect at the 5′-neighbor base pair, attributed to changes in hydration and cation organization.13 In contrast, the insertion of 7amG into the OL-1b duplex creates 100% occupancy of a cation binding site adjacent to base pair X5:C8.
Summary
The consequences of site-specifically placing a cationic 7-aminomethyl-7-deaza-2′-deoxyguanosine (7amG) into d(GAGAXCGCTCTC)2, where X = 7amG, have been explored. The tethered cationic amines are in plane with the modified base pairs. The X5:C8 base pair is stabilized. Additionally, the two 5′-neighboring A4:T9 and G3:C10 base pairs are stabilized with respect to the exchange of their imino protons with water. The equilibrium constant for base pair opening decreases for base pair A4:T9 as compared to that for base pair A4:T9 in the unmodified duplex, indicating that the overall fraction of base pair A4:T9 in the open state of the modified duplex decreases. A smaller decrease in the equilibrium constant for base pair opening is observed for base pair G3:C10. The fact that the enthalpic stabilization of the modified OL-1b duplex16 not only involves the modified X5:C8 base pair but also extends in the 5′-direction to involve the A4:T9 and G3:C8 base pairs provides a new example of cation-mediated sequence-specific modulation of DNA stability.
Acknowledgments
We thank Prof. Carmelo J. Rizzo and Ms. Albena Kozekova for assistance with the synthesis of the 7amG-modified oligodeoxynucleotide.
Supporting Information Available
1H chemical shifts of the nonexchangeable protons of the OL-1b duplex (Table S1), NOE distance restraints used for the structural refinement of the OL-1b duplex (Table S2), backbone restraints generated for the OL-1b duplex used in rMD calculations (Table S3), deoxyribose restraints generated for the OL-1b duplex used in rMD calculations (Table S4), base pair restraints generated for the OL-1b duplex used in rMD calculations (Table S5), base pairing and base stacking helicoidal parameters of the refined structure of the OL-1b duplex (Table S6), backbone torsion angles of the refined OL-1b duplex with averaged values from two symmetry-related strands (Table S7), backbone torsion angles of the refined OL-1b duplex (Figure S1), line widths of the guanine N1H and thymine N3H imino proton resonances as a function of temperature (Figure S2), and representative time courses of transfer of solvent magnetization to the imino protons for the OL-1a and OL-1b duplexes (Figure S3). This material is available free of charge via the Internet at http://pubs.acs.org.
This work was supported by National Institutes of Health (NIH) Grants P01 CA-160032 and R01 ES-05509 (M.P.S.), R01 CA-76049 (B.G.), and R01 CA-29088 (B.G.). Additional support for core instrumentation was provided by NIH center grants P30 ES-00267, Vanderbilt University Center in Molecular Toxicology, and P30 CA-068485, Vanderbilt-Ingram Cancer Center. Funding for NMR was supplied by NIH Grants S10 RR-05805 and S10 RR-025677 and National Science Foundation Grant DBI 0922862, the latter funded by the American Recovery and Reinvestment Act of 2009 (Public Law 111-5), and by Vanderbilt University.
The authors declare no competing financial interest.
Funding Statement
National Institutes of Health, United States
Supplementary Material
References
- Manning G. S. (1978) The molecular theory of polyelectrolyte solutions with applications to the electrostatic properties of polynucleotides. Q. Rev. Biophys. 11, 179–246. [DOI] [PubMed] [Google Scholar]
- Record M. T. Jr.; Anderson C. F.; Lohman T. M. (1978) Thermodynamic analysis of ion effects on the binding and conformational equilibria of proteins and nucleic acids: The roles of ion association or release, screening, and ion effects on water activity. Q. Rev. Biophys. 11, 103–178. [DOI] [PubMed] [Google Scholar]
- Honig B.; Nicholls A. (1995) Classical electrostatics in biology and chemistry. Science 268, 1144–1149. [DOI] [PubMed] [Google Scholar]
- Privalov P. L.; Dragan A. I.; Crane-Robinson C.; Breslauer K. J.; Remeta D. P.; Minetti C. A. (2007) What drives proteins into the major or minor grooves of DNA?. J. Mol. Biol. 365, 1–9. [DOI] [PMC free article] [PubMed] [Google Scholar]
- Privalov P. L.; Dragan A. I.; Crane-Robinson C. (2011) Interpreting protein/DNA interactions: Distinguishing specific from non-specific and electrostatic from non-electrostatic components. Nucleic Acids Res. 39, 2483–2491. [DOI] [PMC free article] [PubMed] [Google Scholar]
- Braunlin W. H.; Nordenskiold L.; Drakenberg T. (1991) A reexamination of 25Mg2+ NMR in DNA solution: Site heterogeneity and cation competition effects. Biopolymers 31, 1343–1346. [DOI] [PubMed] [Google Scholar]
- Buckin V. A.; Kankiya B. I.; Rentzeperis D.; Marky L. A. (1994) Mg2+ recognizes the sequence of DNA through its hydration shell. J. Am. Chem. Soc. 116, 9423–9429. [Google Scholar]
- Chiu T. K.; Dickerson R. E. (2000) 1 Å crystal structures of B-DNA reveal sequence-specific binding and groove-specific bending of DNA by magnesium and calcium. J. Mol. Biol. 301, 915–945. [DOI] [PubMed] [Google Scholar]
- Kielkopf C. L.; Ding S.; Kuhn P.; Rees D. C. (2000) Conformational flexibility of B-DNA at 0.74 angstrom resolution: d(CCAGTACTGG)2. J. Mol. Biol. 296, 787–801. [DOI] [PubMed] [Google Scholar]
- Howerton S. B.; Sines C. C.; VanDerveer D.; Williams L. D. (2001) Locating monovalent cations in the grooves of B-DNA. Biochemistry 40, 10023–10031. [DOI] [PubMed] [Google Scholar]
- Howerton S. B.; Nagpal A.; Williams L. D. (2003) Surprising roles of electrostatic interactions in DNA-ligand complexes. Biopolymers 69, 87–99. [DOI] [PubMed] [Google Scholar]
- Iuchi S., and Kuldell N. (2005) Zinc Finger Proteins: From Atomic Contact to Cellular Function, Kluwer Academic/Plenum Publishers, Dordrecht, The Netherlands. [Google Scholar]
- Ganguly M.; Wang F.; Kaushik M.; Stone M. P.; Marky L. A.; Gold B. (2007) A study of 7-deaza-2′-deoxyguanosine 2′-deoxycytidine base pairing in DNA. Nucleic Acids Res. 35, 6181–6195. [DOI] [PMC free article] [PubMed] [Google Scholar]
- Singh S. K.; Szulik M. W.; Ganguly M.; Khutsishvili I.; Stone M. P.; Marky L. A.; Gold B. (2011) Characterization of DNA with an 8-oxoguanine modification. Nucleic Acids Res. 39, 6789–6801. [DOI] [PMC free article] [PubMed] [Google Scholar]
- Wang R. W.; Gold B. (2009) A facile synthetic approach to 7-deazaguanine nucleosides via a Boc protection strategy. Org. Lett. 11, 2465–2468. [DOI] [PubMed] [Google Scholar]
- Ganguly M.; Wang R. W.; Marky L. A.; Gold B. (2009) Introduction of cationic charge into DNA near the major groove edge of a guanine·cytosine base pair: Characterization of oligodeoxynucleotides substituted with 7-aminomethyl-7-deaza-2′-deoxyguanosine. J. Am. Chem. Soc. 131, 12068–12069. [DOI] [PMC free article] [PubMed] [Google Scholar]
- Rouzina I.; Bloomfield V. A. (1998) DNA bending by small, mobile multivalent cations. Biophys. J. 74, 3152–3164. [DOI] [PMC free article] [PubMed] [Google Scholar]
- Cavaluzzi M. J.; Borer P. N. (2004) Revised UV extinction coefficients for nucleoside-5′-monophosphates and unpaired DNA and RNA. Nucleic Acids Res. 32, e13. [DOI] [PMC free article] [PubMed] [Google Scholar]
- Jeener J.; Meier B. H.; Bachmann P.; Ernst R. R. (1979) Investigation of exchange processes by 2-dimensional NMR spectroscopy. J. Chem. Phys. 71, 4546–4553. [Google Scholar]
- Wagner R.; Berger S. (1996) Gradient-selected NOESY: A fourfold reduction of the measurement time for the NOESY experiment. J. Magn. Reson., Ser. A 123, 119–121. [DOI] [PubMed] [Google Scholar]
- Piotto M.; Saudek V.; Sklenar V. (1992) Gradient-tailored excitation for single-quantum NMR spectroscopy of aqueous solutions. J. Biomol. NMR 6, 661–665. [DOI] [PubMed] [Google Scholar]
- Goddard T. D., and Kneller D. G. (2006) SPARKY, version 3.113, University of California, San Francisco. [Google Scholar]
- Borgias B. A.; James T. L. (1989) Two-dimensional nuclear Overhauser effect: Complete relaxation matrix analysis. Methods Enzymol. 176, 169–183. [DOI] [PubMed] [Google Scholar]
- Borgias B. A.; James T. L. (1990) MARDIGRAS: A procedure for matrix analysis of relaxation for discerning geometry of an aqueous structure. J. Magn. Reson. 87, 475–487. [Google Scholar]
- Liu H.; Spielmann H. P.; Ulyanov N. B.; Wemmer D. E.; James T. L. (1995) Interproton distance bounds from 2D NOE intensities: Effect of experimental noise and peak integration errors. J. Biomol. NMR 6, 390–402. [DOI] [PubMed] [Google Scholar]
- Arnott S.; Hukins D. W. L. (1972) Optimised parameters for A-DNA and B-DNA. Biochem. Biophys. Res. Commun. 47, 1504–1509. [DOI] [PubMed] [Google Scholar]
- Schafmeister C. E. A., Ross W. S., and Romanovski V. (1995) XLEAP, University of California, San Francisco. [Google Scholar]
- Frisch M. J., Trucks G. W., Schlegel H. B., Scuseria G. E., Robb M. A., Cheeseman J. R., Montgomery J. A. Jr., Vreven T., Kudin K. N., Burant J. C., Millam J. M., Iyengar S. S., Tomasi J., Barone V., Mennucci B., Cossi M., Scalmani G., Rega N., Petersson G. A., Nakatsuji H., Hada M., Ehara M., Toyota K., Fukuda R., Hasegawa J., Ishida M., Nakajima T., Honda Y., Kitao O., Nakai H., Klene M., Li X., Knox J. E., Hratchian H. P., Cross J. B., Adamo C., Jaramillo J., Gomperts R., Stratmann R. E., Yazyev O., Austin A. J., Cammi R., Pomelli C., Pomelli J., Ochterski W., Ayala P. Y., Morokuma K., Voth G. A., Salvador P., Dannenberg J. J., Zakrzewska V. G., Daniels A. D., Farkas O., Rabuck A. D., Raghavachari K., and Ortiz J. V. (2004) GAUSSIAN 03, Gaussian, Inc., Wallingford, CT. [Google Scholar]
- Case D. A.; Cheatham T. E. III; Darden T.; Gohlke H.; Luo R.; Merz K. M. Jr.; Onufriev A.; Simmerling C.; Wang B.; Woods R. J. (2005) The AMBER biomolecular simulation programs. J. Comput. Chem. 26, 1668–1688. [DOI] [PMC free article] [PubMed] [Google Scholar]
- Wang J. M.; Cieplak P.; Kollman P. A. (2000) How well does a restrained electrostatic potential (RESP) model perform in calculating conformational energies of organic and biological molecules?. J. Comput. Chem. 21, 1049–1074. [Google Scholar]
- Tsui V.; Case D. A. (2000) Theory and applications of the generalized Born solvation model in macromolecular simulations. Biopolymers 56, 275–291. [DOI] [PubMed] [Google Scholar]
- Bashford D.; Case D. A. (2000) Generalized Born models of macromolecular solvation effects. Annu. Rev. Phys. Chem. 51, 129–152. [DOI] [PubMed] [Google Scholar]
- Keepers J. W.; James T. L. (1984) A theoretical study of distance determination from NMR. Two-dimensional nuclear Overhauser effect spectra. J. Magn. Reson. 57, 404–426. [Google Scholar]
- Gueron M.; Leroy J. L. (1995) Studies of base pair kinetics by NMR measurement of proton exchange. Methods Enzymol. 261, 383–413. [DOI] [PubMed] [Google Scholar]
- Plateau P.; Gueron M. (1982) Exchangeable proton NMR without base-line distortion, using new strong-pulse sequences. J. Am. Chem. Soc. 104, 7310–7311. [Google Scholar]
- Chen C.; Russu I. M. (2004) Sequence-dependence of the energetics of opening of at basepairs in DNA. Biophys. J. 87, 2545–2551. [DOI] [PMC free article] [PubMed] [Google Scholar]
- Chen C.; Jiang L.; Michalczyk R.; Russu I. M. (2006) Structural energetics and base-pair opening dynamics in sarcin-ricin domain RNA. Biochemistry 45, 13606–13613. [DOI] [PubMed] [Google Scholar]
- Huang Y.; Chen C.; Russu I. M. (2009) Dynamics and stability of individual base pairs in two homologous RNA-DNA hybrids. Biochemistry 48, 3988–3997. [DOI] [PMC free article] [PubMed] [Google Scholar]
- Huang Y.; Weng X.; Russu I. M. (2010) Structural energetics of the adenine tract from an intrinsic transcription terminator. J. Mol. Biol. 397, 677–688. [DOI] [PMC free article] [PubMed] [Google Scholar]
- Huang Y.; Weng X.; Russu I. M. (2011) Enhanced base-pair opening in the adenine tract of a RNA double helix. Biochemistry 50, 1857–1863. [DOI] [PubMed] [Google Scholar]
- Crenshaw C. M.; Wade J. E.; Arthanari H.; Frueh D.; Lane B. F.; Nunez M. E. (2011) Hidden in plain sight: Subtle effects of the 8-oxoguanine lesion on the structure, dynamics, and thermodynamics of a 15-base pair oligodeoxynucleotide duplex. Biochemistry 50, 8463–8477. [DOI] [PMC free article] [PubMed] [Google Scholar]
- Parker J. B.; Stivers J. T. (2011) Dynamics of uracil and 5-fluorouracil in DNA. Biochemistry 50, 612–617. [DOI] [PMC free article] [PubMed] [Google Scholar]
- Patel D. J.; Shapiro L.; Hare D. (1987) DNA and RNA: NMR studies of conformations and dynamics in solution. Q. Rev. Biophys. 20, 35–112. [DOI] [PubMed] [Google Scholar]
- Reid B. R. (1987) Sequence-specific assignments and their use in NMR studies of DNA structure. Q. Rev. Biophys. 20, 2–28. [DOI] [PubMed] [Google Scholar]
- Boelens R.; Scheek R. M.; Dijkstra K.; Kaptein R. (1985) Sequential assignment of imino- and amino-proton resonances in 1H NMR spectra of oligonucleotides by two-dimensional NMR spectroscopy. Application to a lac operator fragment. J. Magn. Reson. 62, 378–386. [Google Scholar]
- Lavery R.; Moakher M.; Maddocks J. H.; Petkeviciute D.; Zakrzewska K. (2009) Conformational analysis of nucleic acids revisited: Curves+. Nucleic Acids Res. 37, 5917–5929. [DOI] [PMC free article] [PubMed] [Google Scholar]
- Every A. E.; Russu I. M. (2008) Influence of magnesium ions on spontaneous opening of DNA base pairs. J. Phys. Chem. B 112, 7689–7695. [DOI] [PMC free article] [PubMed] [Google Scholar]
- Huang Y. G.; Chen C. J.; Russu I. M. (2009) Structural energetics of a DNA-RNA hybrid containing a tract of dA-rU base pairs. J. Biomol. Struct. Dyn. 26, 900–900. [Google Scholar]
- Allen M. D.; Yamasaki K.; Ohme-Takagi M.; Tateno M.; Suzuki M. (1998) A novel mode of DNA recognition by a β-sheet revealed by the solution structure of the GCC-box binding domain in complex with DNA. EMBO J. 17, 5484–5496. [DOI] [PMC free article] [PubMed] [Google Scholar]
- Gajiwala K. S.; Chen H.; Cornille F.; Roques B. P.; Reith W.; Mach B.; Burley S. K. (2000) Structure of the winged-helix protein hRFX1 reveals a new mode of DNA binding. Nature 403, 916–921. [DOI] [PubMed] [Google Scholar]
- Huang K.; Louis J. M.; Donaldson L.; Lim F. L.; Sharrocks A. D.; Clore G. M. (2000) Solution structure of the MEF2A-DNA complex: Structural basis for the modulation of DNA bending and specificity by MADS-box transcription factors. EMBO J. 19, 2615–2628. [DOI] [PMC free article] [PubMed] [Google Scholar]
- Spratt T. E.; Zydowsky T. M.; Floss H. G. (1997) Stereochemistry of the in vitro and in vivo methylation of DNA by (R)- and (S)-N-[2H1,3H]methyl-N-nitrosourea and (R)- and (S)-N-nitroso-N-[2H1,3H]methyl-N-methylamine. Chem. Res. Toxicol. 10, 1412–1419. [DOI] [PubMed] [Google Scholar]
- Briscoe W. T.; Cotter L. E. (1985) DNA sequence has an effect on the extent and kinds of alkylation of DNA by a potent carcinogen. Chem.-Biol. Interact. 56, 321–331. [DOI] [PubMed] [Google Scholar]
- Wurdeman R. L.; Gold B. (1988) The effect of DNA sequence, ionic strength, and cationic DNA affinity binders on the methylation of DNA by N-methyl-N-nitrosourea. Chem. Res. Toxicol. 1, 146–147. [DOI] [PubMed] [Google Scholar]
- Wurdeman R. L.; Church K. M.; Gold B. (1989) DNA methylation by N-methyl-N-nitrosourea, N-methyl-N-nitro-N-nitrosoguanidine, N-nitroso-(α-acetoxyethyl)methylamine, and diazomethane: Mechanism for the formation of N7-methylguanine in sequence-characterized 5′-32P-end-labeled DNA. J. Am. Chem. Soc. 111, 6408–6412. [Google Scholar]
- Mattes W. B.; Hartley J. A.; Kohn K. W. (1986) DNA sequence selectivity of guanine-N7 alkylation by nitrogen mustards. Nucleic Acids Res. 14, 2971–2987. [DOI] [PMC free article] [PubMed] [Google Scholar]
- Gibson N. W.; Mattes W. B.; Hartley J. A. (1985) Identification of specific DNA lesions induced by three classes of chloroethylating agents: Chloroethylnitrosoureas, chloroethylmethanesulfonates and chloroethylimidazotetrazines. Pharmacol. Ther. 31, 153–163. [DOI] [PubMed] [Google Scholar]
- Hartley J. A.; Gibson N. W.; Kohn K. W.; Mattes W. B. (1986) DNA sequence selectivity of guanine-N7 alkylation by three antitumor chloroethylating agents. Cancer Res. 46, 1943–1947. [PubMed] [Google Scholar]
- Hartley J. A.; Mattes W. B.; Vaughan K.; Gibson N. W. (1988) DNA sequence specificity of guanine N7-alkylations for a series of structurally related triazenes. Carcinogenesis 9, 669–674. [DOI] [PubMed] [Google Scholar]
- Wurdeman R. L.; Douskey M. C.; Gold B. (1993) DNA methylation by N-methyl-N-nitrosourea: Methylation pattern changes in single- and double-stranded DNA, and in DNA with mismatched or bulged guanines. Nucleic Acids Res. 21, 4975–4980. [DOI] [PMC free article] [PubMed] [Google Scholar]
- Gold B.; Marky L. M.; Stone M. P.; Williams L. D. (2006) A review of the role of the sequence-dependent electrostatic landscape in DNA alkylation patterns. Chem. Res. Toxicol. 19, 1402–1414. [DOI] [PMC free article] [PubMed] [Google Scholar]
- Braunlin W. H.; Nordenskiold L.; Drakenberg T. (1989) The interaction of calcium(II) with DNA probed by 43Ca-NMR is not influenced by terminal phosphate groups at ends and nicks. Biopolymers 28, 1339–1342. [DOI] [PubMed] [Google Scholar]
- Braunlin W. H.; Drakenberg T.; Nordenskiold L. (1992) Ca2+ binding environments on natural and synthetic polymeric DNA’s. J. Biomol. Struct. Dyn. 10, 333–343. [DOI] [PubMed] [Google Scholar]
Associated Data
This section collects any data citations, data availability statements, or supplementary materials included in this article.


