

SUMMARY
Mutations in the transmembrane (TM) domains of receptor tyrosine kinases (RTKs) have been implicated in the induction of pathological phenotypes. These mutations are believed to stabilize the RTK dimers, and thus promote unregulated signaling. However, the energetics behind the pathology induction has not been determined. An example of a TM domain pathogenic mutation is the Ala391→Glu mutation in fibroblast growth factor receptor 3 (FGFR3), linked to Crouzon syndrome with acanthosis nigricans, as well as to bladder cancer. Here we determine the free energy of dimerization of wild-type and mutant FGFR3 TM domain in lipid bilayers using Förster resonance energy transfer (FRET), and we show that hydrogen bonding between Glu391 and the adjacent helix in the dimer is a feasible mechanism for dimer stabilization. The measured change in the free energy of dimerization due to the Ala391→Glu pathogenic mutation is −1.3 kcal/mole, consistent with previous reports of hydrogen bond strengths in proteins. This is the first quantitative measurement of mutant RTK stabilization in a hydrophobic environment. We show that this seemingly modest value can lead to a large increase in dimer fraction and thus profoundly affect RTK-mediated signal transduction.
Keywords: Receptor tyrosine kinase, fibroblast growth factor receptor 3, hydrogen bond, transmembrane domain, cancer
INTRODUCTION
Fibroblast growth factor receptor 3 (FGFR3) is a receptor tyrosine kinase (RTK) which consists of three extracellular glycosylated Ig-like domains, a transmembrane (TM) domain, and a cytoplasmic catalytic domain. Like all RTKs, FGFR3 transmits biochemical signals by dimerizing in the membrane plane. Ligands (FGFs) and heparin bind to the extracellular domains and stabilize the dimer, which in turn triggers cytoplasmic signaling cascades (50).
FGFR3 is critical for skeletal development. Mutations in FGFR3 can lead to dominant disorders of bone development, including achondroplasia, thanatophoric dysplasia types 1 and 2, hypochondroplasia, and Crouzon syndrome with acanthosis nigricans (37 ;46). Some mutations are in the TM domain, such as the achodroplasia-causing Gly380→Arg, as well as Gly370→Cys, Ser371→Cys, and Tyr373→Cys, causing thanatophoric (lethal) dysplasia. It has been shown that RTK TM domains play an important role in the dimerization process (5 ;29 ;45), and therefore it is not surprising that single amino acid FGFR3 TM domain mutations can profoundly affect the development of the skeletal system. These mutations are believed to stabilize the FGFR3 dimer, thus leading to unregulated signaling and pathologies (31 ;48).
Work in several laboratories has shown that FGFR3 is also involved in tumorigenesis. In particular, an oncogenic role has been demonstrated for FGFR3 in human epithelial cancers and in multiple myelomas (8 ;47). Tumorigenesis is often associated with activating somatic mutations that occur in the TM domain (10 ;47). These are the very same mutations that have been previously identified in autosomal dominant human skeletal disorders and craniosynostosis syndromes (30 ;37 ;40 ;46).
An example of a pathogenic mutation, involved in both a skeletal disorder and in cancer, is the Ala391→Glu mutation in the TM domain of FGFR3. This mutation has been identified as a somatic mutation in bladder cancer (47). As a germ-line mutation, it has been associated with Crouzon syndrome, an autosomal dominant disorder characterized by premature ossification of the skull (craniosynostosis), with acanthosis nigricans (30). Due to the obliterations of the sutures, the skull is unable to grow normally, the eye sockets are shallow (ocular proptosis), and the upper jaw is underdeveloped. Acanthosis nigricans is a skin disorder, characterized by abnormally increased coloration (hyperpigmentation) and thickening (hyperkeratosis) of the skin.
A similar Val664→Glu mutation in Neu, a RTK from the EGFR family, has been shown to be oncogenic (49). Solid state NMR studies have provided structural information that dimer stabilization in Neu occurs via hydrogen bonding of Glu664 to the adjacent TM helix in the dimer (43 ;44). Similarly, Glu391 in the FGFR3 (Ala391→Glu) mutant can be expected to contribute to dimer stabilization by participating in hydrogen bonds, in accordance with structural and thermodynamic arguments presented here.
In the current study, we compare the free energy of dimerization for wild-type and mutant (Ala391→Glu) FGFR3 TM domain in lipid bilayers, and thus determine the change in the free energy of dimerization, ΔΔG™, due to the single pathogenic mutation. The measured ΔΔG™ = −1.3 kcal/mole is consistent with previous reports of hydrogen bond strengths in proteins (14 ;35 ;51). Here we show that this seemingly modest value could lead to a large increase in dimer fraction and thus profoundly affect RTK-mediated signal transduction.
RESULTS
Effect of the Ala391→Glu mutation on secondary structure and membrane disposition
Recently, we reported the synthesis and purification of wild-type FGFR3 TM domain (TMwt, for sequence see Figure 1) (20). This model peptide could, in principle, form biologically irrelevant antiparallel dimers, formed due to interactions between the positive charges on the C-terminus and the negative charges on the N-terminus. This is why, here we work with a sequence variant of wild-type TM domain, RRTM (see Figure 1), in which the two negative charges at the N-terminus are substituted with two Arg. We have shown that TMwtandRRTM exhibit identical dimeric bands on SDS gels (20). Thus, TMwt and RRTM have very similar dimerization propensities (see also “Effect of terminal charges on dimerization” at the end of the “Results” section). In the current study, we therefore compare the behavior of RRTM and a similar variant RRTM(E) carrying the pathogenic Ala391→Glu mutation, thus eliminating electrostatic interactions between termini as a driving force for dimer formation.
Figure 1.
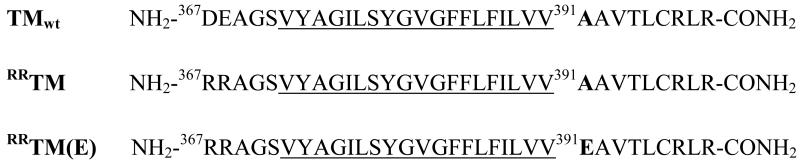
Amino acid sequence of wild-type human FGFR3 TM domain (TMwt) and the two peptides used in this study, RRTM and RRTM(E). The predicted hydrocarbon core-embedded segments, identified using hydropathy analysis (21), are underlined. The Ala391→Glu mutation, shown in bold, has been linked to Crouzon syndrome with acanthosis nigricans (30). It has also been identified as a somatic mutation in bladder cancer (47).
To evaluate the structural consequences of the Ala391→ Glu mutation in FGFR3 TM domain, we first investigated if the mutation affects the helicity of RRTM in organic solvent and in SDS. Figure 2A shows the solution CD spectra of RRTM and RRTM(E) in water/HFIP and in 4% SDS. The CD spectra appear very similar, suggesting that the mutation does not cause a loss of helicity.
Figure 2.

(A) CD spectra (mean residue ellipticity versus wavelength) of RRTM and RRTM(E) in HFIP/MeOH (1:2) and in 4% (140 mM) SDS. The CD spectra are identical within experimental error, suggesting that the mutation does not cause a loss of helicity. (B) Solution CD spectra (mean residue ellipticity versus wavelength) of RRTM and RRTM(E) in POPC vesicles. Peptides were mixed with POPC in HFIP and chloroform, dried, and redissolved in 10 mM phosphate buffer, 500 mM NaCl, pH 7, subjected to three cycles of freeze-thawing, and extruded through 100 nm diameter pores. The spectra are identical, suggesting that the secondary structures of RRTM and RRTM(E) in lipid bilayers are the same.
Figure 2B shows the CD spectra of RRTM and RRTM(E) in POPC vesicles. In these experiments, peptides were mixed with POPC in HFIP and chloroform, dried, and redissolved in 10 mM phosphate buffer, 500 mM NaCl, pH 7, subjected to three cycles of freeze-thawing, and extruded through 100 nm diameter pores. The spectra of RRTM and RRTM(E) are identical, suggesting that the secondary structures of RRTM and RRTM(E) in lipid bilayers are the same.
Next we investigated if the Ala391→ Glu mutation changes the disposition of the helix in the bilayer. In particular, we assessed the tilt of the incorporated RRTM and RRTM(E) in POPC bilayers using oriented CD (OCD). The OCD samples were oriented POPC multilayers containing 5 mole % RRTM and RRTM(E), deposited on a quartz slide from an organic solvent. A background spectrum of a lipid multilayer was subtracted from the OCD spectra of the proteins in the lipid matrix.
OCD provides a relatively easy and quick way to assess the helix tilt, with precision ~ 10 degrees. Figure 3A shows the theoretical OCD spectra for helices that are normal to the bilayer, or tilted 10 or 20 degrees(53). Figure 3B shows the experimental spectra for 5 mole % RRTM and RRTM(E). Comparison between figures 3A and 3B suggests that both peptides adopt transmembrane orientation. As discussed previously (20), the observed difference in amplitude is not statistically significant; the OCD signal of a TM helix is low and thus difficult to measure above the lipid background. The position of the maximum and the shape of the spectrum, however, are more reliable reporters of helix tilt. As seen in Figure 3B, the position of the maximum is not affected by the presence of the mutation. Based on the OCD data, we therefore conclude that the mutation does not induce a measurable (by OCD) change in helix tilt with respect to the bilayer normal.
Figure 3.

(A) Theoretical oriented CD spectra for tilts of 0, 10, and 20 degrees from the bilayer normal.(B) Oriented CD spectra (mean residue ellipticity versus wavelength) of RRTM and RRTM(E) in POPC multilayers. Peptides and lipids (molar ratio 1:20) were mixed in HFIP/choloform, deposited on a quartz slide, and hydrated to form multilayers. Both spectra are consistent with a TM orientation of the helix (see text), and are identical within experimental error. Therefore, the mutation does not cause a measurable change in the disposition of FGFR3 TM domain in bilayers.
Effect of the Ala391→Glu mutation on dimerization: SDS-PAGE
We first assessed the dimerization propensity of RRTM and RRTM(E) using SDS-PAGE. SDS-PAGE has been used to probe the occurrence of TM helix dimerization, and the effect of single amino acid substitutions on dimer stability (24 ;28 ;36). The SDS gel, shown in Figure 4, shows that both RRTM and RRTM(E) exhibit monomeric and dimeric bands, indicative of monomer/dimer coexistence. The intensity of the RRTM(E) dimeric band is much stronger than the intensity of the RRTM dimeric band, indicating that the Ala391→Glu mutation stabilizes the FGFR3 TM domain dimer. Monomer and dimer fractions [D], [M] and [DE], [ME] forRRTM and RRTM(E), respectively, were determined from gels loaded with ~ 4 to 6 nmoles of peptide in 4% SDS, using the Gel Analysis option in the NIH ImageJ software. From these measurements, an “apparent” change in free energy of dimerization was estimated according to:
| (1) |
The calculation, based on 6 different gels, gives ΔΔGapp = −1.7 ± 0.2 kcal/mole.
Figure 4.

SDS-PAGE of RRTM and RRTM(E). 20 μg of peptide, dissolved in sample buffer, were reduced with NuPAGE reducing agent and boiled for 5 minutes prior to loading onto Novex pre-cast tricine gels. The peptides were visualized with Coomassie blue. The two lowest molecular weight standards (molecular weight in kDa) are marked. Both RRTM and RRTM(E) exhibit monomer and dimer bands; the dimer band is stronger forRRTM(E). Therefore, the mutation stabilizes the FGFR3 TM dimer in SDS. Monomer and dimer fractions were calculated using the public domain NIH ImageJ software. Dimer-to-monomer band intensity ratios were estimated as ~1 and ~0.1 for RRTM(E) and RRTM, respectively. An apparent change in dimerization free energy due to the mutation, −1.7 ± 0.2 kcal/mole, was determined as described in the text.
Effect of the Ala391→Glu mutation on dimerization: Förster resonance energy transfer (FRET) in liposomes
We have previously demonstrated that FRET can be used as a tool for probing dimerization in liposomes, an environment that mimics the biological membrane (54). While the measurements are labor-intensive, FRET in liposomes can be measured accurately; the data are reproducible and relevant to processes occurring in biological membranes.
We carried out FRET measurements of the dimerization free energies of RRTM and RRTM(E) using two different sets of FRET pairs: fluorescein/rhodamine (Fl/Rhod) and BODIPY-fluorescein/rhodamine (BODIPY-Fl/Rhod). The FRET measurements require knowledge of the Förster radius, R0, for the donor/acceptor pair. The R0 of fluorescein/rhodamine has been reported as 55 Å (www.molecularprobes.com), and this value has produced an excellent fit in the calculation of the dimerization free energy of wild-type FGFR3, TMwt (25). Still, a question remains about the exact R0 value for fluorescein and rhodamine that are coupled to the peptides, and are likely positioned in the bilayer interface. We therefore determined R0 for both fluorescein/rhodamine and BODIPY-fluorescein/rhodamine, conjugated to the peptides via maleimide linkage, by measuring the fluorescent yields of the donor, QYDONOR, and the degree of overlap between donor emission and acceptor excitation, as described in detail elsewhere (23). The results are shown in Table I. The calculated value of 56 Å (Table I) for Fl/Rhod is in very good agreement with the value R0=55 Å that we have previously used to determine the free energy of dimerization of TMwt (25). The calculated R0 values for fluorescein/rhodamine and BODIPY-fluorescein/rhodamine are very similar.
Table I.
Calculated Förster radii, R0, for the two donor/acceptor pairs used in this study
| Donor/Acceptor Pair |
Donor Quantum
Yield, QYDONOR |
Spectral Overlap,
J (nm4 M−1cm−1) |
R0 (Å) |
|---|---|---|---|
| Fl/Rhod | 0.62 | 4.03 × 10¹⁵ | 56.1 |
| BODIPY-Fl/Rhod | 0.64 | 3.96 × 10¹⁵ | 56.3 |
The quantum yield, QYDONOR, of Fl-RRTM in liposomes was determined by comparing its emission spectra (exc. 439, em. 450-800 nm) with fluorescein emission in 0.1 N NaOH (a standard with quantum yield Q= 0.91). The quantum yield of BODIPY Fl-RRTM was obtained from comparison of the absorbance values at 439 nm and the integrated emission spectra (450 nm – 800 nm) of BODIPY Fl-RRTM and Fl-RRTM in liposomes. The spectral overlap, J, was calculated as described (23). The parameters used in the calculation were: orientation factor, κ2 = 2/3; extinction coefficient of the acceptor (Rhod), ε=93000 M−1 cm−1; refractive index, n=1.33.
Figure 5A shows the fluorescence spectrum of a sample containing 0.1 mole % Fl-RRTM(E) and 0.1 mole % Rhod-RRTM(E) (solid line) in POPC. For comparison, we also show the emission spectra of samples containing 0.1 mole % Fl-RRTM(E) (dashed line) and 0.1 mole % Rhod-RRTM(E) (dotted line). Figure 5B shows a FRET spectrum of 0.2 mole % BODIPY-Fl-RRTM(E) and 0.2 mole % Rhod-RRTM(E) in POPC (solid line), as well as 0.2 mole % BODIPY-Fl RRTM(E) (dashed line) and 0.2 mole % Rhod-RRTM(E) (dotted line). Due to FRET, in figure 5 we observe a decrease in donor fluorescence (around 520 nm) and the appearance of sensitized acceptor fluorescence (around 570 nm). FRET efficiency was calculated from the decrease in donor fluorescence using equation (2), as described in Materials and Methods.
Figure 5.

(A) Fluorescence spectra of Fl/Rhod-labeled RRTM(E) in POPC. Solid line: 0.1mole % Fl-RRTM(E) and 0.1mole % Rhod-RRTM(E). Dashed line: 0.1mole % Fl-RRTM(E). Dotted line: 0.1mole % Rhod-RRTM(E). Samples were prepared as described in Materials and Methods. The excitation was fixed at 439 nm, such that only Fl was directly excited. The emission was scanned from 450 to 800 nm. FRET is obvious (solid lines) from the decrease in Fl fluorescence (around 520 nm) and the appearance of sensitized Rhod fluorescence (around 570 nm). % FRET was calculated from the decrease in Fl fluorescence at 519 nm (equation 2). (B) Fluorescence spectra of BODIPY-Fl/Rhod-labeled RRTM(E) in POPC. Solid line: 0.2mole % BODIPY-Fl-RRTM(E) and 0.2mole % Rhod-RRTM(E). Dashed line:0.2mole % Fl-RRTM(E). Dotted line: 0.2mole % Rhod-RRTM(E) The excitation was fixed at 439 nm, such that only BODIPY-Fl was directly excited. The FRET efficiency was calculated from the decrease in BODIPY-Fl fluorescence at 515 nm (equation 2).
FRET that arises due to proximity effects (i.e. random co-localization of donors and acceptors) was modeled according to the analysis of Wolber and Hudson (52) using R0=56 Å, as described in detail elsewhere (54). The FRET efficiency due to sequence-specific dimerization was therefore obtained by subtracting the predicted FRET efficiency due to proximity from the measured FRET signal (for detailed description, see (54)). Figure 6A shows the FRET efficiency due to sequence specific interactions as a function of the acceptor mole ratio, for a fixed peptide-to-lipid ratio. The linear dependence demonstrates that both peptides form dimers (1 ;25 ;26). Figure 6B shows the FRET efficiency due to sequence specific dimerization for RRTM and RRTM(E), as a function of total peptide concentration (2[D]+[M]). Data were derived from experiments with both Fl/Rhod (circles) and BODIPY-Fl/Rhod (squares), for donor to acceptor ratio of 1. The FRET efficiency is a measure of[D]/(2[D]+[M]) (dimer fraction, or 0.5 × fraction of peptides in the dimeric state), where [D] is the dimer concentration (dimers per lipid) and [M] is the monomer concentration (monomers per lipid) (54). The theoretical curves (dashed line for RRTM and dotted line for RRTM(E)) were calculated according to equation (3) with an association constant K that was determined by fitting the experimental data to the theoretical curves. In this fit, the only varied parameter was K, or the free energy of dimerization ΔG=-RT ln K. Using all the data (both Fl/Rhod and BODIPY-Fl/Rhod data sets), we obtained ΔG = −2.7 kcal/mole for RRTM and ΔG = −4.0 for RRTM(E) (Figure 6). Fitting the separate Fl/Rhod and BODIPY-Fl/Rhod data sets to the theoretical curves produced similar results, namely −2.7 and −4.2 kcal/mole and −2.8 and −3.9 kcal/mole, for RRTM and RRTM(E), respectively .
Figure 6.

(A) FRET efficiency due to sequence-specific interactions as a function of the acceptor mole ratio for RRTM and RRTM(E). The peptide-to-lipid ratio was kept constant at 1:500, while the ratio of BODIPY-Fl-labeled to Rhod-labeled peptides was varied. The dependence on the acceptor mole ratio is linear, indicative of dimer formation.
(B)Energetics of RRTM and RRTM(E) dimerization in POPC. The FRET efficiencies due to sequence-specific dimerization were calculated for Fl/Rhod-labeled peptides (circles) and BODIPY-Fl/Rhod-labeled peptides (squares), using R0 = 56 Å as previously described (25 ;54). The free energy of dimerization was determined by fitting the theoretical curves derived from equation (3) (dashed line for RRTM, dotted line for RRTM(E)) to the experimental data, as described in Materials and Methods. The best estimates for the free energies of dimerization, derived from various optimization schemes (see Table II and text), are ΔG = −2.8 ± 0.1 kcal/mole for RRTM and ΔG = −4.1 ± 0.2 kcal/mole for RRTM(E). Therefore, the change in the free energy of dimerization due to the Ala391→Glu mutation is ΔΔG™ = −1.3 ± 0.2 kcal/mole.
To further examine the robustness of the fits, we subjected all the data to two-parameter fits, by simultaneously varying K (or ΔG) and R0 (or the predicted FRET due to random co-localization of donors and acceptors). The results are shown in Table II for the combined Fl/Rhod and BODIPY-Fl/Rhod data, as well as for the separate Fl/Rhod and BODIPY-Fl/Rhod data sets. The values of R0 in Table II, obtained from the two-parameter fits, are very similar to the independently measured values in Table I. The results in Table II did not depend on the initial guesses for ΔG and R0, indicative of unique robust fits. The best estimates of ΔG for RRTM and RRTM(E) were therefore obtained by averaging all the results from the optimization schemes. Thus, we determined ΔG = −2.8 ± 0.1 kcal/mole for RRTM and ΔG = −4.1 ± 0.2 kcal/mole for RRTM(E). The change in the free energy of dimerization due to the Ala391→Glu mutation is therefore ΔΔG™ = −1.3 ± 0.2 kcal/mole.
Table II.
Results from FRET data fits with two variable parameters: free energy of dimerization, ΔG (kcal/mole) and Förster radius, R0 (Å).
| Donor/Acceptor Pair | ΔG (kcal/mole) | R0 (Å) | |
|---|---|---|---|
| RRTM | Fl/Rhod | −2.7 | 55.4 |
| BODIPY-Fl/Rhod | −2.8 | 55.8 | |
| combined | −2.8 | 54.7 | |
|
| |||
| RRTM(E) | Fl/Rhod | −4.4 | 52.1 |
| BODIPY-Fl/Rhod | −4.0 | 53.6 | |
| combined | −4.1 | 53.4 | |
The calculated ΔG provided the best fit to the experimental data shown in Figure 6B (see text for details). The results do not depend on the initial guesses for ΔG and R0, indicative of unique robust fits.
Structural model
Glu has a hydrogen-bonding capability (43 ;44), and we hypothesized that Glu391 in FGFR3 stabilizes the pathogenic FGFR3 dimer by participating in hydrogen bonds. We therefore sought to determine the feasibility of hydrogen bonding as a dimer stabilization factor in RRTM(E). To do so, we modeled the wild-type FGFR3 TM dimer using the software CHI, and examined if the structure is consistent with the idea that Glu391 hydrogen bonding can stabilize the dimer. A detailed description of the CHI simulations has been published in detail previously (2-4 ;7). As described in Materials and Methods, we used only the hydrophobic residues 372 to 396. Therefore, the predicted structure is independent of the identity of the charges on the N and C termini, which were not included in the simulation.
Generally, CHI modeling produces more than one possible structure, as in the cases of GpA (4), phospholamban (2), and synaptobrevin (15). In our modeling, however, only one symmetric dimer structure was produced for the wild-type FGFR3 TM domain. RTK dimers are symmetric, and we therefore consider this the most likely structure.
The structural model of the FGFR3 TM domain dimer is shown in Figure 7A. The predicted dimer is a left-handed dimer, with a crossing angle between helices of 16.985 degrees. This value is close to the average packing angle for left-handed helices, 20 degrees (6). In the dimer, specific interactions between the helices are mediated by the bulky hydrophobic side chains. The particular residues that mediate the dimer contacts in this model are Leu377, Val381, Phe384, and Ile387. For instance, the side chain of Leu377 on one helix packs against the side chain of Leu377 on the other; the side chain of Phe384 on one helix interacts with Phe383, Phe384, and Ile387 on the other.
Figure 7.

(A) Molecular model of the wild-type TM domain dimer created with the software CHI. Contacts between the two helices are mediated by residues Leu377, Val381, Phe384, and Ile387. The side chains of one helix (blue) pack against the side chains of the other helix (purple). Ala391 (shown in yellow), which is mutated to Glu in Crouzon syndrome with acanthosis nigricans (30) and cancer (47), faces the dimer interface. (B) A putative hydrogen bond between Glu391 (yellow) and Ile387 (pink) in the mutant dimer (see text).
In the wild-type model structure, Ala391, colored yellow in Figure 7A, faces the dimer interface. Using the software package Insight II, we substituted Ala391 with Glu, and then ran molecular dynamics simulations in vacuo to explore various side chain conformations of Glu391. In several cases, we observed conformations that were consistent with a hydrogen bond between Glu391 side chain and the carboxyl group of Ile387 from the adjacent helix (Figure 7B). This hydrogen bond did not alter the wild-type dimerization motif. We therefore propose that (1) the mutant dimer is stabilized via hydrogen bonding and (2) the dimerization motif (Leu377, Val381, Phe384, Ile387) does not change due to the mutation, just a hydrogen bond is added to further stabilize the dimer. We would therefore expect that the dimerization energy for the mutant dimer is the sum of the dimerization energy for wild-type plus the contribution of a hydrogen bond. This is consistent with our findings: the difference in dimerization free energy that that we measure, −1.3 kcal/mole, is very similar to previous measurements of hydrogen bond strengths (14 ;35 ;51).
We note that modeling of the 391E mutant with CHI did not produce a stable symmetric structure. This is not surprising: the force-fields used in CHI describe primarily van der Waals interactions in vacuum and do not provide an adequate description of Glu391 in the heterogeneous bilayer interface.
Effect of terminal charges on dimerization
The value ΔG = −2.8 ± 0.1 kcal/mole that we measured for RRTM is the same as the previously reported ΔG = −3.0 ± 0.5 kcal/mole (25) for TMwt (see Figure 1 for sequence). From the FRET measurements, we therefore conclude that the terminal charges of the peptide have a negligible effect on the energetics of FGFR3 TM domain dimerization. This finding is consistent with previously published SDS-PAGE results (20).
Effect of lipid composition on RRTM(E) dimerization
Finally, we measured the FRET efficiencies for RRTM and RRTM(E) in POPC liposomes containing charged lipids (POPS or POPG). We examined the following lipid mixtures: 80% POPC+20% POPG, 50% POPC+50% POPG, and 80% POPC+20% POPS. The measured FRET efficiencies of RRTM and RRTM(E) did not depend on the lipid compositions, and the calculated dimer fractions were identical for the studied lipid mixtures, indicating that lipid charges do nor affect the dimerization energetics of RRTM and RRTM(E). We note, however, that RTKs are believed to associate with lipid-ordered domains, and further studies with various liposome compositions may be needed to determine whether lipids have any effect on FGFR3 dimerization.
DISCUSSION
Summary of findings
Using FRET in liposomes, a method providing thermodynamic information that is relevant to processes in biological membranes (54), we have determined, for the first time, the change in free energy of dimerization of a RTK TM domain due to a pathogenic mutation. In particular, we have measured the change in free energy of dimerization, ΔΔG™ = −1.3 kcal/mole, due to the Ala391→Glu mutation in FGFR3, a mutation known as the cause for Crouzon syndrome with acanthosis nigricans (30), and cancer (47). Glu391 has hydrogen bonding capabilities, and the measured −1.3 kcal/mole is very similar to previous reports of hydrogen bond strengths in proteins (14 ;35 ;51). Therefore, it can be expected that the mutant dimer is stabilized via hydrogen bonding interactions between Glu391 and the adjacent helix in the dimer.
Structural hypothesis
The role of RTK TM domain structure in signaling was studied by Bell et al. (5), who used simple polyvaline TM sequences and showed that activation of RTKs occurs only when pairs of hydrogen-bonding Glu residues are placed in specific positions in the TM domains. The rotation of the dimer interface did not affect the ability of the TM domains to dimerize, but led to periodic oscillations in kinase activity. Furthermore, inserting residues in the C-terminal TM flanking regions, which caused the kinase domains to rotate with respect to the TM domains, restored the kinase activity of the inactive mutants. Therefore, the orientation of the catalytic domains is controlled by the orientation of the TM domains in the TM dimer. Correct orientation of the catalytic domains can be achieved only via the “correct” signaling-competent TM dimerization motif. We propose that this finding has an important implication: only TM mutations that stabilize the dimer without altering the orientation of the helices in the TM dimer can be over-activating. While some modest changes could be tolerated, a dramatic change in the TM dimer interface should render the receptor inactive. Our structural model in Figure 7 is consistent with this view: in the wild-type dimer structure, the residue in position 391 faces the dimer interface and therefore has the potential to interact with the neighboring helix. We therefore propose that (1) the dimer structures of wild-type and the pathogenic Ala391→Glu mutant are similar and (2) mutant dimer stabilization is a direct consequence of the interaction (most probably hydrogen bonding) between Glu391 and the adjacent helix in the dimer. The exact hydrogen bonding pattern should emerge from solid state NMR studies, currently underway in our laboratory.
We note that we cannot exclude the possibility for the formation of two hydrogen bonds in the mutant homodimer. Furthermore, we cannot exclude the possibility that the two Glu residues hydrogen-bond with each other. Such a scenario, based on the fact that Glu can act simultaneously as a donor and an acceptor, has been proposed for Neu (44), but has not been observed experimentally (43).
Effect of the Ala391→Glu mutation on FGFR3 monomer-dimer equilibrium
The seemingly modest change in the free energy of dimerization that we measure, −1.3 kcal/mole, can have a dramatic effect on the equilibrium between monomers and dimers. Figure 8 shows the dimer fractions for RRTM (dashed line) and RRTM(E) (dotted line) as a function of the peptide-to-lipid ratio, plotted on a logarithmic scale. (Note, these are the theoretical curves from Figure 6B, re-plotted on a semi-logarithmic scale. While the protein concentration range in Figure 6B has been shown to be optimal for FRET measurements (25 ;54), the plot in Figure 8 covers a much wider concentration range). The subtraction of the two lines gives the difference in dimer fraction (solid line) between RRTM(E) and RRTM. We see that the relative increase in dimer fraction due to the mutation (difference in dimer fraction (solid line) as compared to wild-type dimer fraction (dashed line)) depends on the protein concentration. The measured −1.3 kcal/mole, for concentrations below 0.1 mole% protein, increases the dimer fraction several-fold. Therefore, the measured −1.3 kcal/mole could provide a plausible mechanism for pathogenesis due to a single TM domain mutation. Note, however, that at higher concentrations, above 1 mole % protein, the mutation has a modest effect on the monomer-dimer equilibrium.
Figure 8.

Dimer fractions for RRTM (dashed line) and RRTM(E) (dotted line) as a function of the peptide-to-lipid ratio, plotted on a logarithmic scale. (Note, these are the theoretical curves from Figure 6B, re-plotted on a semi-logarithmic scale and covering a much wider range of protein concentrations.) The solid line, obtained via subtraction, is the change in dimer fraction due to the Ala391→Glu mutation. The relative increase in dimer fraction due to the mutation depends on the protein concentration. The measured −1.3 kcal/mole leads to a several-fold increase in dimer fraction for concentrations below 0.1 mole% protein. However, for concentrations above 1 mole % protein, the mutation has a modest effect on the monomer-dimer equilibrium.
Over-activation versus ligand independent activation
Over-activation of RTKs is often viewed in terms of ligand-independent activation. Here we argue that while ligand-independent dimerization leads to over-activation, over-activation may occur even when dimerization is ligand-dependent.
Tanner and Kyte have presented arguments that EGFR’s ligand-binding domains, in the absense of the ligand, may inhibit dimerization due to a steric clash (45). They have proposed that EGF binding leads to a conformational change in the extracellular domain, relieving the steric inhibition and allowing the TM domains to induce dimerization. Recent crystallography studies have confirmed that the structure of the EGFR extracellular domains are different in the absence and presence of ligands; the same is believed to be true for FGFR (11 ;12 ;17 ;32 ;38 ;39 ;42). The only known exception is ErbB2 (Neu) extracellular domain, which does not require a ligand to dimerize and its conformation resembles the ligand-bound state (12). This is why TM domain mutations in Neu and chimeric receptors containing the Neu extracellular domain induce ligand-independent receptor activation (16 ;48). However, when the extracellular domains provide a steric barrier that inhibits dimerization, as in the case of EGFR and FGFRs (42 ;45), the presence of ligands may be required to observe changes in catalytic activity and downstream signaling. In such cases, stabilizing TM domain mutations cannot be expected to always induce observable ligand-independent RTK activation. However, the mutant RTK dimer is expected to be more stable than wild-type in the presence of the ligand, as discussed below.
In Figure 9, we propose “a thermodynamic view” of the process of RTK dimerization in the presence of a stabilizing TM domain mutation. In the absence of the ligand, RTKs exist in a monomer-dimer equilibrium (41), and the free energy of dimerization is ΔG (Figure 9 A). The equilibrium moves towards the dimeric state in the presence of a stabilizing TM domain mutation, such as the Ala391→Glu mutation. In this case, the dimerization free energy becomes ΔG + ΔΔGM, where ΔΔGM describes the increased propensity for dimerization in the presence of the stabilizing TM mutation (Figure 9 B). If the mutation does not affect the dimerization of the soluble domains (see below), we may expect ΔΔGM to be equal to ΔΔG™, which we measure here for the isolated TM domain. Similarly, the equilibrium moves towards the dimeric state in the presence of the ligand such that the dimerization free energy is now ΔG + ΔΔGL (Figure 9 C), where ΔΔGL describes the increased propensity for dimerization upon ligand binding.
Figure 9.

“Thermodynamic view” of RTK dimerization. A: In the absence of the ligand, RTKs exist in a monomer-dimer equilibrium, described by a free energy of dimerization ΔG. B: The equilibrium moves towards the dimeric state in the presence of a stabilizing TM domain mutation, such as the Ala391→Glu mutation, and the free energy becomes ΔG + ΔΔGM. C: The equilibrium moves towards the dimeric state in the presence of the ligand such that the dimerization free energy is now ΔG + ΔΔGL. D: The presence of the mutation and the ligand further stabilizes the dimer; the free energy of dimerization is assumed to be a sum of the three contributions ΔG + ΔΔGL + ΔΔGM (see text). We argue that, for the Ala391→Glu FGFR3 mutation, ΔΔGM is equal to the measured ΔΔG™ = −1.3 kcal/mole.
What if both a stabilizing TM mutation and ligand are present? The simplest assumption is that the TM mutation does not affect the ligand binding domains. This assumption can be justified for TM domain pathogenic mutations that do not alter the dimer interface, as discussed above, just stabilize the dimer. Therefore, it is reasonable to assume that, at least for some pathogenic mutations that do not induce structural changes, the free energy of dimerization is a sum, ΔG + ΔΔGL + ΔΔGM, in the presence of the mutation and the ligand (Figure 9 D). This view suggests that the contribution of the mutation to the energetics of dimerization is the same, ΔΔGM, in the presence and in the absence of the ligand.
The assumption that the FGFR3 Ala391→Glu mutation does not affect the over-all structure of the receptor, and the structure of the extracellular domains in particular, can be justified since (1) The Ala391→Glu mutation does not cause a change in secondary structure or membrane disposition, as demonstrated in Figures 2 and 3, (2) hydropathy analysis (21) suggests that the mutation does not induce a shift in the membrane-embedded section of the protein (see Figure 1), and (3) the structure of wild-type and mutant dimer are expected to be very similar, as discussed in “Structural hypothesis” above. Then, the Ala391→Glu mutation can be expected to stabilize the FGFR3 dimer by ΔΔGM = ΔΔG™, no matter if the ligand is present or not. Therefore, the measured ΔΔG™ should be the mutation-induced change in dimerization free energy that transforms normal FGFR3 signaling into pathogenic in the context of the whole receptor. The results presented here suggest that −1.3 kcal/mole could be sufficient to induce pathological phenotypes.
The view presented in Figure 9 further suggests that TM domain mutations could affect downstream signaling via a ligand-independent (as in Figure 9 B) or ligand-dependent (as in Figure 9 D) mechanism. Both mechanisms may be at play, and their relative importance would likely depend on the local ligand concentration. However, it is possible that the mutation induces an observable pathological phenotype in only one of these cases. This is illustrated in Figure 10: while the mutation always stabilizes the dimer by ΔΔGM = −1.3 kcal/mole, the mutation-induced change in distribution of monomers and dimers depends, in fact, on ligand availability (see caption to Figure 10 for detail). Thus, ligand availability may be an important parameter that affects the outcome of cell culture experiments. Studies of RTK signal transduction that address the effect of pathogenic TM domain mutations on downstream signaling can yield contradicting results, depending on the ligand concentrations used . Therefore, experiments that employ systematic variations in ligand concentrations could lead to better understanding of the consequences of RTK TM domain mutations. In one such study, differences due to TM domain mutations in the erythropoietin receptor were observed only at low ligand concentration (13). Furthermore, the local concentration of ligand (heparin and FGFs) may be one of many factors that determines whether, and to what extent, pathogenic mutations induce observable changes in dimer fraction and, as a consequence, pathological phenotypes.
Figure 10.

The fraction of wild-type and mutant RTK dimers in the plasma membrane could be predicted if the values of ΔG, ΔΔGL, and ΔΔGM, as well as the protein expression level, are known. Plotted here, as a function of receptor concentrations, are: (1) dimer fraction for the wild-type receptors when no ligand is present (solid line, free energy of dimerization ΔG), (2) dimer fraction for the mutant receptors carrying a stabilizing mutation when no ligand is present (dashed line, free energy of dimerization ΔG + ΔΔGM) (3) dimer fraction for the wild-type receptors at saturating ligand concentrations (dotted line, free energy of dimerization ΔG + ΔΔGL), and (4) dimer fraction for the mutant receptors at saturating ligand concentrations (dashed-dotted line, free energy of dimerization ΔG + ΔΔGL + ΔΔGM). In this paper, we measure ΔΔGM = −1.3 kcal/mole for the Ala391→Glu pathogenic mutation in FGFR3. The values of ΔG and ΔΔGL have not been measured yet; these should eventually emerge from FRET measurements of receptor dimerization in cells. This will allow the quantitative predictions of dimer fractions for wild-type receptors [ D] (in the absence of ligands) and [ D L] (at saturating ligand concentrations), as well as the respective changes in dimer fractions due to a pathogenic mutation [ ΔD] and [ ΔD L] . We expect the magnitude of the relative change in dimer fraction ([ ΔD ] / [ D ] or [ ΔD L] / [ D L] ) to be linked to the probability of pathology occurrence. The figure is drawn in such a way that [ ΔD ] / [ D ] is much larger than [ ΔD L] / [ D L], illustrating the mechanism of ligand-independent pathology induction.
MATERIALS AND METHODS
Peptide synthesis
The peptides RRTM and RRTM(E) were synthesized using solid phase peptide synthesis and purified using reverse HPLC, as previously described (20). For the FRET experiments, the single Cys residue in the TM domain, Cys396, was labeled with either fluorescein-maleimide, BODIPY-fluorescein-maleimide or tetramethylrhodamine-maleimide (Molecular Probes). The unreacted dyes were separated from the peptide over an ion exchange resin, and the labeled peptides were further purified using HPLC. Correct molecular weights were confirmed using MALDI-TOF mass spectrometry. The labeling yields were determined by comparing dye concentrations (derived from absorbance measurements) and peptide concentrations (determined by CD). Labeling yields of different batches varied between 70% and 100%. The attachment of dyes to Cys396, a naturally occurring Cys in the TM domain of FGFR3, has been shown to not perturb the helicity and the dimerization propensity of the TM domain (25).
Choice of donor/acceptor pairs and calculations of the Förster radius R0
In the current study, we use 2 FRET pairs: (1) fluorescein/rhodamine, which was shown to be an appropriate donor/acceptor pair for FRET measurements in liposomes (25 ;54), and (2) BODIPY-fluorescein/rhodamine. The latter offers an advantage since the unreacted BODIPY-fluorescein is easier to separate from the labeled peptides prior to HPLC peptide purification. The efficient separation of free BODIPY-fluorescein could be explained by the lack of electrostatic interactions between the neutral BODIPY-fluorescein and the positively charged peptide termini.
The quantum yield, QYDONOR, of Fl-RRTM in liposomes was determined by comparing its emission spectra (exc. 439, em. 450-800 nm) with fluorescein emission in 0.1 N NaOH (a standard with quantum yield Q = 0.91). The quantum yield of BODIPY Fl-RRTM was obtained from comparison of the absorbance values at 439 nm and the integrated emission spectra (450 nm – 800 nm) of BODIPY Fl-RRTM and Fl-RRTM in liposomes. The results are shown in Table I for refractive index n=1.33 and orientation factor Κ2 = 2/3, corresponding to freely rotating dyes. The latter assumption about the orientation factor is justified since (1) Cys396 is very close to the C-terminus of the peptides and the dye is therefore free to rotate and (2) identical values for R0 are obtained when R0 is determined based on the assumption for free rotation (Table I) and when it is fitted independently to the FRET data (Table II).
Circular Dichroism
CD measurements were performed using a Jasco 710 sectropolarimeter, as previously reported (18 ;19 ;33;34). The concentrations of the peptides in the samples, required for calculating molar ellipticities, were determined from absorbance measurements in a Cary 50 (Varian) spectrophotometer. Solution CD spectra of RRTM and RRTM(E) domain were measured in HFIP/water, SDS, and lipid vesicles. For oriented CD measurements, peptides and lipids were co-dissolved in HFIP/chloroform and deposited on a quartz slide to form a mutilamellar sample containing the peptides, as previously described (18 ;19 ;25 ;54). The sample was mounted on a custom designed chamber and hydrated. The sample was rotated around the beam axis in increments of 45 degrees. Eight discreet spectra were collected and averaged to determine the mean value and the standard deviation.
SDS-PAGE
The peptide samples were subjected to SDS-PAGE using 10-20% tricine precast gels (Novex, San Diego, CA). The Tdomains were dissolved in SDS-containing sample buffer, reduced with NuPAGE reducing agent, boiled for 5 minutes, and loaded onto the gels. The peptides were visualized with Coomassie blue. The dimer-monomer ratios were calculated using the public domain NIH ImageJ software.
Preparation of vesicles
Vesicles were prepared as previously described (20 ;25 ;54). Briefly, lipids and proteins were first mixed in HFIP/chloroform, the organic solvents were removed, and the protein/lipid mixture was redissolved in 10 mM phosphate buffer, 500 mM NaCl, pH 7. Samples were then freeze-thawed several times, which substantially decreased the turbidity of the samples. These vesicles were shown to be an appropriate system for measuring FRET in liposomes (54).
Sample homogeneity was assessed using X-ray diffraction and fluorescence techniques as described in details elsewhere (54). X-ray experiments demonstrated the existence of a single phase with a well-defined Bragg spacing. The observed linear dependence of the FRET efficiency on the acceptor ratio for a fixed peptide concentration (Figure 6A) is indicative of a monomer-dimer equilibrium and no higher order aggregates and no protein dissolution from the lipid matrix (1 ;27).
Förster Resonance Energy Transfer (FRET)
FRET experiments in vesicles were carried out using a Fluorolog fluorometer (Jobin Yvon). For both donor/acceptor pairs, the excitation wavelength was set at 439 nm, and emission spectra were collected from 450 nm to 800 nm. FRET was measured in liposomes containing known concentrations of donor- and acceptor-labeled proteins. Liposomes containing only donor-labeled proteins served as the “no FRET control”. Energy transfer, E, was calculated from measurements of donor intensity at 519 or 515 nm for Fl/Rhod and BODIPY-Fl/Rhod, respectively, in the absence and presence of the acceptor according to:
| (2) |
where ID and IDA are the donor intensities of samples containing only donor-labeled proteins and samples with both donor- and acceptor-labeled proteins, respectively. These results were corrected for FRET arising due to random co-localization of donors and acceptors as described (25 ;54). Data derived from batches with labeling yields < 100% were corrected for incomplete labeling as described (25 ;54), and data for different batches were combined for the free energy fits shown in Figure 6B.
Free energy calculations
We have previously reported that the measured FRET signal depends only on the protein-to-lipid ratio (54). As expected, it does not depend on the peptide and lipid concentrations of the samples, i.e. on the amount of buffer added to hydrate the protein/lipid mixture. The monomer/dimer equilibrium in liposomes is therefore defined by the association constant:
| (3) |
where [D] is the dimer molar concentration in the lipid vesicles (dimers per lipid) and [M] is the monomer molar concentration in the lipid vesicles (monomers per lipid). K is determined by fitting the calculated FRET efficiencies (or dimer fractions) to the experimental data (as in Figure 6B). The free energy of dimerization is given by:
| (4) |
Molecular modeling
The dimer was modeled using the software CHI (i.e., “CNS searching of helix interactions”), as previously described (2 ;4 ;7). To mimic the low dielectric constant of the membrane interior, the simulations were carried out in vacuum (dielectric constant=1). For the modeling, we have used residues 372-396 (i.e. the flanks on the N and C termini were not included in the simulation). First, a dimer was created with both a right-handed and a left-handed crossing angle. Dimer conformations were searched with rotation angles from 0 to 360 degrees. Molecular dynamic simulations, followed by simulated annealing and energy minimization, were carried out for all rotation angles with a step of 45 degrees. Finally, clusters of ten or more final structures were identified using a cutoff of 1 Å mean square deviation. The average structure of each cluster was calculated and refined by energy minimization.
ACKNOWLEDGEMENTS
We thank Jamie Spangler and Xue Han for peptide synthesis. We are grateful to Dr. Paul Adams for providing us with the CHI software, and to Dr. Tihomir Hristov and Anastasia Gentilcore for assistance with structure modeling. We thank Drs. Daniel Donoghue, Michael Edidin, James Bowie, William C. Wimley, Michael Wiener, Clair Francomano, Jay Gargus, and Ethylin Jabs for stimulating discussions. This work was supported by Research Scholar Grant # RSG-04-201-01 from the American Cancer Society to K.H.
ABBREVIATIONS
- FRET
Förster resonance energy transfer
- TM
transmembrane
- RTK
receptor tyrosine kinase
- FGFR3
fibroblast growth factor receptor 3
- Fl
fluorescein
- Rhod
rhodamine
- POPC
1-palmitoyl-2-oleoyl-sn-glycero-3-phosphocholine
- POPS
1-palmitoyl-2-oleoyl-sn-glycero-3-phosphoserine
- POPG
1-palmitoyl-2-oleoyl-sn-glycero-3-phosphoglycerol
- HFIP
hexafluoroisopropanol
- SDS-PAGE
sodium dodecyl sulfate-polyacrylamide gel electrophoresis
Reference List
- 1.Adair BD, Engelman DM. Glycophorin a helical transmembrane domains dimerize in phospholipid bilayers - a resonance energy transfer study. Biochemistry. 1994;33:5539–5544. doi: 10.1021/bi00184a024. [DOI] [PubMed] [Google Scholar]
- 2.Adams PD, Arkin IT, Engelman DM, Brünger AT. Computational searching and mutagenesis suggest a structure for the pentameric transmembrane domain of phospholamban. Nature Struct. Biol. 1995;2:154–162. doi: 10.1038/nsb0295-154. [DOI] [PubMed] [Google Scholar]
- 3.Adams PD, Brunger AT. Towards prediction of membrane protein structure. In: von Heijne G, editor. Membrane protein assembly. R.G.Landes Co.; Austin,TX.: 1997. p. 97. [Google Scholar]
- 4.Adams PD, Engelman DM, Brünger AT. Improved prediction for the structure of the dimeric transmembrane domain of glycophorin A obtained through global searching. Proteins. 1996;26:257–261. doi: 10.1002/(SICI)1097-0134(199611)26:3<257::AID-PROT2>3.0.CO;2-B. [DOI] [PubMed] [Google Scholar]
- 5.Bell CA, Tynan JA, Hart KC, Meyer AN, Robertson SC, Donoghue DJ. Rotational coupling of the transmembrane and kinase domains of the Neu receptor tyrosine kinase. Mol. Biol. Cell. 2000;11:3589–3599. doi: 10.1091/mbc.11.10.3589. [DOI] [PMC free article] [PubMed] [Google Scholar]
- 6.Bowie JU. Helix packing in membrane proteins. J. Mol. Biol. 1997;272:780–789. doi: 10.1006/jmbi.1997.1279. [DOI] [PubMed] [Google Scholar]
- 7.Brunger AT, Adams PD, Clore GM, DeLano WL, Gros P, Grosse-Kunstleve RW, Jiang J-S, Kuszewski J, Nilges M, Pannu NS, Read R, Rice LM, Simonson T, Warren GL. Crystallography and NMR system: a new software suite for macromolecular structure determination. Acta Cryst. D. 1998;54:905–921. doi: 10.1107/s0907444998003254. [DOI] [PubMed] [Google Scholar]
- 8.Cappellen D, de Oliveira C, Ricol D, Diez de Medina SG, Bourdin J, Sastre-Garau X, Chopin D, Thiery JP, Radvanyi F. Frequent activating mutations of FGFR3 in human bladder and cervix carcinomas. Nat. Genet. 1999;23:18–20. doi: 10.1038/12615. [DOI] [PubMed] [Google Scholar]
- 9.Carpenter CD, Ingraham HA, Cochet C, Walton GM, Lazar CS, Sowadski JM, Rosenfeld MG, Gill GN. Structural-Analysis of the Transmembrane Domain of the Epidermal Growth-Factor Receptor. J. Biol. Chem. 1991;266:5750–5755. [PubMed] [Google Scholar]
- 10.Chesi M, Brents LA, Fly SA, Bais C, Robbiani DF, Mesri E, Kuehl WM, Bergsagel PL. Activated fibroblast growth factor receptor 3 is an oncogene that contributes to tumor progression in multiple myeloma. Blood. 2001;97:729–736. doi: 10.1182/blood.v97.3.729. [DOI] [PubMed] [Google Scholar]
- 11.Cho HS, Leahy DJ. Structure of the extracellular region of HER3 reveals an interdomain tether. Science. 2002;297:1330–1333. doi: 10.1126/science.1074611. [DOI] [PubMed] [Google Scholar]
- 12.Cho HS, Mason K, Ramyar KX, Stanley AM, Gabelli SB, Denney DW, Leahy DJ. Structure of the extracellular region of HER2 alone and in complex with the Herceptin Fab. Nature. 2003;421:756–760. doi: 10.1038/nature01392. [DOI] [PubMed] [Google Scholar]
- 13.Constantinescu SN, Keren T, Socolovsky M, Nam HS, Henis YI, Lodish HF. Ligand-independent oligomerization of cell-surface erythropoietin receptor is mediated by the transmembrane domain. Proceedings of the National Academy of Sciences of the United States of America. 2001;98:4379–4384. doi: 10.1073/pnas.081069198. [DOI] [PMC free article] [PubMed] [Google Scholar]
- 14.Fersht AR, Shi JP, Knilljones J, Lowe DM, Wilkinson AJ, Blow DM, Brick P, Carter P, Waye MMY, Winter G. Hydrogen-Bonding and Biological Specificity Analyzed by Protein Engineering. Nature. 1985;314:235–238. doi: 10.1038/314235a0. [DOI] [PubMed] [Google Scholar]
- 15.Fleming KG, Engelman DM. Computation and mutagenesis suggest a right-handed structure for the synaptobrevin transmembrane dimer. Proteins-Structure Function and Genetics. 2001;45:313–317. doi: 10.1002/prot.1151. [DOI] [PubMed] [Google Scholar]
- 16.Galvin BD, Hart KC, Meyer AN, Webster MK, Donoghue DJ. Constitutive receptor activation by Crouzon syndrome mutations in fibroblast growth factor receptor (FGFR) 2 and FGFR2/Neu chimeras. Proceedings of the National Academy of Sciences of the United States of America. 1996;93:7894–7899. doi: 10.1073/pnas.93.15.7894. [DOI] [PMC free article] [PubMed] [Google Scholar]
- 17.Garrett TPJ, Mckern NM, Lou MZ, Elleman TC, Adams TE, Lovrecz GO, Zhu HJ, Walker F, Frenkel MJ, Hoyne PA, Jorissen RN, Nice EC, Burgess AW, Ward CW. Crystal structure of a truncated epidermal growth factor receptor extracellular domain bound to transforming growth factor alpha. Cell. 2002;110:763–773. doi: 10.1016/s0092-8674(02)00940-6. [DOI] [PubMed] [Google Scholar]
- 18.Hristova K, Dempsey CE, White SH. Structure, location, and lipid perturbations of melittin at the membrane interface. Biophys. J. 2001;80:801–811. doi: 10.1016/S0006-3495(01)76059-6. [DOI] [PMC free article] [PubMed] [Google Scholar]
- 19.Hristova K, Wimley WC, Mishra VK, Anantharamaiah GM, Segrest JP, White SH. An amphipathic α-helix at a membrane interface: A structural study using a novel x-ray diffraction method. J. Mol. Biol. 1999;290:99–117. doi: 10.1006/jmbi.1999.2840. [DOI] [PubMed] [Google Scholar]
- 20.Iwamoto T, You M, Li E, Spangler J, Tomich JM, Hristova K. Synthesis and initial characterization of FGFR3 transmembrane domain: Consequences of sequence modifications. Biochim. Biophys. Acta. 2005;1668:240–247. doi: 10.1016/j.bbamem.2004.12.012. [DOI] [PubMed] [Google Scholar]
- 21.Jayasinghe S, Hristova K, White SH. Energetics, stability, and prediction of transmembrane helices. J. Mol. Biol. 2001;312:927–934. doi: 10.1006/jmbi.2001.5008. [DOI] [PubMed] [Google Scholar]
- 22.Kashles O, Szapary D, Bellot F, Ullrich A, Schlessinger J, Schmidt A. Ligand-Induced Stimulation of Epidermal Growth-Factor Receptor Mutants with Altered Transmembrane Regions. Proceedings of the National Academy of Sciences of the United States of America. 1988;85:9567–9571. doi: 10.1073/pnas.85.24.9567. [DOI] [PMC free article] [PubMed] [Google Scholar]
- 23.Lakowicz JR. Principles of Fluorescence Spectroscopy. Kluwer Academic/Plenum Publishers; New York: 1999. pp. 1–698. [Google Scholar]
- 24.Lemmon MA, Treutlein HR, Adams PD, Brunger AT, Engelman DM. A Dimerization Motif for Transmembrane Alpha-Helices. Nature Struct. Biol. 1994;1:157–163. doi: 10.1038/nsb0394-157. [DOI] [PubMed] [Google Scholar]
- 25.Li E, You M, Hristova K. SDS-PAGE and FRET suggest weak interactions between FGFR3 TM domains in the absence of extracellular domains and ligands. Biochemistry. 2005;44:352–360. doi: 10.1021/bi048480k. [DOI] [PubMed] [Google Scholar]
- 26.Li M, Reddy LG, Bennett R, Silva ND, Jr., Jones LR, Thomas DD. A fluorescence energy transfer method for analyzing protein oligomeric structure: Application to phospholamban. Biophys. J. 1999;76:2587–2599. doi: 10.1016/S0006-3495(99)77411-4. [DOI] [PMC free article] [PubMed] [Google Scholar]
- 27.Li M, Reddy LG, Bennett R, Silva ND, Jones LR, Thomas DD. A fluorescence energy transfer method for analyzing protein oligomeric structure: Application to phospholamban. Biophys. J. 1999;76:2587–2599. doi: 10.1016/S0006-3495(99)77411-4. [DOI] [PMC free article] [PubMed] [Google Scholar]
- 28.Melnyk RA, Partridge AW, Deber CM. Transmembrane domain mediated self-assembly of major coat protein subunits from Ff bacteriophage. J. Mol. Biol. 2002;315:63–72. doi: 10.1006/jmbi.2001.5214. [DOI] [PubMed] [Google Scholar]
- 29.Mendrola JM, Berger MB, King MC, Lemmon MA. The single transmembrane domains of ErbB receptors self-associate in cell membranes. J. Biol.Chem. 2002;277:4704–4712. doi: 10.1074/jbc.M108681200. [DOI] [PubMed] [Google Scholar]
- 30.Meyers GA, Orlow SJ, Munro IR, Przylepa KA, Jabs EW. Fibroblast-Growth-Factor-Receptor-3 (Fgfr3) Transmembrane Mutation in Crouzon-Syndrome with Acanthosis Nigricans. Nat. Genet. 1995;11:462–464. doi: 10.1038/ng1295-462. [DOI] [PubMed] [Google Scholar]
- 31.Monsonego-Ornan E, Adar R, Rom E, Yayon A. FGF receptors ubiquitylation: dependence on tyrosine kinase activity and role in downregulation. FEBS Lett. 2002;528:83–89. doi: 10.1016/s0014-5793(02)03255-6. [DOI] [PubMed] [Google Scholar]
- 32.Ogiso H, Ishitani R, Nureki O, Fukai S, Yamanaka M, Kim JH, Saito K, Sakamoto A, Inoue M, Shirouzu M, Yokoyama S. Crystal structure of the complex of human epidermal growth factor and receptor extracellular domains. Cell. 2002;110:775–787. doi: 10.1016/s0092-8674(02)00963-7. [DOI] [PubMed] [Google Scholar]
- 33.Olah GA, Huang HW. Circular dichroism of oriented α helices. I. Proof of the exciton theory. J. Chem. Phys. 1988;89:2531–2538. [Google Scholar]
- 34.Olah GA, Huang HW. Circular dichroism of oriented α helices. II. Electric field oriented polypeptides. J. Chem. Phys. 1988;89:6956–6962. [Google Scholar]
- 35.Pace CN, Shirley BA, McNutt M, Gajiwala K. Forces contributing to the conformational stability of proteins. FASEB J. 1996;10:75–83. doi: 10.1096/fasebj.10.1.8566551. [DOI] [PubMed] [Google Scholar]
- 36.Partridge AW, Melnyk RA, Deber CM. Polar residues in membrane domains of proteins: Molecular basis for helix-helix association in a mutant CFTR transmembrane segment. Biochemistry. 2002;41:3647–3653. doi: 10.1021/bi0120502. [DOI] [PubMed] [Google Scholar]
- 37.Passos-Bueno MR, Wilcox WR, Jabs EW, Sertié AL, Alonso LG, Kitoh H. Clinical spectrum of fibroblast growth factor receptor mutations. Human Mutation. 1999;14:115–125. doi: 10.1002/(SICI)1098-1004(1999)14:2<115::AID-HUMU3>3.0.CO;2-2. [DOI] [PubMed] [Google Scholar]
- 38.Plotnikov AN, Hubbard SR, Schlessinger J, Mohammadi M. Crystal structures of two FGF-FGFR complexes reveal the determinants of ligand-receptor specificity. Cell. 2000;101:413–424. doi: 10.1016/s0092-8674(00)80851-x. [DOI] [PubMed] [Google Scholar]
- 39.Plotnikov AN, Schlessinger J, Hubbard SR, Mohammadi M. Structural basis for FGF receptor dimerization and activation. Cell. 1999;98:641–650. doi: 10.1016/s0092-8674(00)80051-3. [DOI] [PubMed] [Google Scholar]
- 40.Radvanyi F, Thiery JP, Billerey C, van der Kwast TH, Zafrani ES, Chopin D. Fibroblast growth factor receptor: from chondrodysplasia to bladder cancer. M S-Medecine Sciences. 2001;17:1189–1191. [Google Scholar]
- 41.Sako Y, Minoghchli S, Yanagida T. Single-molecule imaging of EGFR signalling on the surface of living cells. Nature Cell Biology. 2000;2:168–172. doi: 10.1038/35004044. [DOI] [PubMed] [Google Scholar]
- 42.Schlessinger J. Ligand-induced, receptor-mediated dimerization and activation of EGF receptor. Cell. 2002;110:669–672. doi: 10.1016/s0092-8674(02)00966-2. [DOI] [PubMed] [Google Scholar]
- 43.Smith SO, Smith C, Shekar S, Peersen O, Ziliox M, Aimoto S. Transmembrane interactions in the activation of the Neu receptor tyrosine kinase. Biochemistry. 2002;41:9321–9332. doi: 10.1021/bi012117l. [DOI] [PubMed] [Google Scholar]
- 44.Smith SO, Smith CS, Bormann BJ. Strong hydrogen bonding interactions involving a buried glutamic acid in the transmembrane sequence of the neu/erbB-2 receptor. Nature Struct. Biol. 1996;3:252–258. doi: 10.1038/nsb0396-252. [DOI] [PubMed] [Google Scholar]
- 45.Tanner KG, Kyte J. Dimerization of the extracellular domain of the receptor for epidermal growth factor containing the membrane-spanning segment in response to treatment with epidermal growth factor. J. Biol. Chem. 1999;274:35985–35990. doi: 10.1074/jbc.274.50.35985. [DOI] [PubMed] [Google Scholar]
- 46.Vajo Z, Francomano CA, Wilkin DJ. The molecular and genetic basis of fibroblast growth factor receptor 3 disorders: The achondroplasia family of skeletal dysplasias, Muenke craniosynostosis, and Crouzon syndrome with acanthosis nigricans. Endocrine Reviews. 2000;21:23–39. doi: 10.1210/edrv.21.1.0387. [DOI] [PubMed] [Google Scholar]
- 47.van Rhijin B, van Tilborg A, Lurkin I, Bonaventure J, de Vries A, Thiery JP, van der Kwast TH, Zwarthoff E, Radvanyi F. Novel fibroblast growth factor receptor 3 (FGFR3) mutations in bladder cancer previously identified in non-lethal skeletal disorders. European Journal of Human Genetics. 2002;10:819–824. doi: 10.1038/sj.ejhg.5200883. [DOI] [PubMed] [Google Scholar]
- 48.Webster MK, Donoghue DJ. Constitutive activation of fibroblast growth factor receptor 3 by the transmembrane domain point mutation found in achondroplasia. EMBO J. 1996;15:520–527. [PMC free article] [PubMed] [Google Scholar]
- 49.Weiner DB, Liu J, Cohen JA, Williams WV, Greene MI. A Point Mutation in the Neu Oncogene Mimics Ligand Induction of Receptor Aggregation. Nature. 1989;339:230–231. doi: 10.1038/339230a0. [DOI] [PubMed] [Google Scholar]
- 50.Wilkie AOM, Morriss-Kay GM, Jones EY, Heath JK. Functions of fibroblast growth factors and their receptors. Curr. Biol. 1995;5:500–507. doi: 10.1016/s0960-9822(95)00102-3. [DOI] [PubMed] [Google Scholar]
- 51.Williams DH, Searle MS, Mackay JP, Gerhard U, Maplestone RA. Toward An Estimation of Binding Constants in Aqueous-Solution - Studies of Associations of Vancomycin Group Antibiotics. Proceedings of the National Academy of Sciences of the United States of America. 1993;90:1172–1178. doi: 10.1073/pnas.90.4.1172. [DOI] [PMC free article] [PubMed] [Google Scholar]
- 52.Wolber PK, Hudson BS. An analytic solution to the Förster energy transfer problem in two dimensions. Biophys. J. 1979;28:197–210. doi: 10.1016/S0006-3495(79)85171-1. [DOI] [PMC free article] [PubMed] [Google Scholar]
- 53.Wu Y, Huang HW, Olah GA. Method of oriented circular dichroism. Biophys. J. 1990;57:797–806. doi: 10.1016/S0006-3495(90)82599-6. [DOI] [PMC free article] [PubMed] [Google Scholar]
- 54.You M, Li E, Wimley WC, Hristova K. FRET in liposomes: measurements of TM helix dimerization in the native bilayer environment. Analytical Biochemistry. 2005;340:154–164. doi: 10.1016/j.ab.2005.01.035. [DOI] [PMC free article] [PubMed] [Google Scholar]