

Abstract
Background
A growing body of evidence has linked vitamin D deficiency to increased risk of cardiovascular disease. Vitamin D deficiency is also more common in African Americans for whom an increased cardiovascular disease risk exists. This study sought to test the hypothesis that 16 weeks of 60,000 IU monthly supplementation of oral vitamin D3 would improve flow-mediated dilation (FMD) in African Americans, whereas no change would be observed in the placebo group.
Methods
A randomized, double blind, placebo controlled clinical trial was conducted. Fifty-seven African American adults were randomly assigned to either the placebo group or vitamin D group.
Results
Following 16 weeks of placebo (n=23; mean age 31±2 years) or 60,000 IU monthly oral vitamin D3 (n=22; mean age 29±2 years), serum concentrations of 25 hydroxyvitamin D increased from 38.2±3.0 nmol/L to 48.7±3.2 nmol/L and 34.3±2.2 nmol/L to 100.9±6.6 nmol/L, respectively. No changes in serum parathyroid hormone, serum calcium, or urine calcium/creatinine were observed following either treatment. Following 16 weeks of treatment, significant improvements in FMD were only observed in the vitamin D group (1.8±1.3%), whereas the placebo group had no change (-1.3±0.6%). Similarly, the vitamin D group exhibited an increase in absolute change in diameter (0.005±0.004 cm) and FMD/shear (0.08±0.04 %/s-1, AUC × 103) following treatment, whereas no change (-0.005±0.002 cm and -0.02±0.02 %/s-1, AUC, respectively) was observed following placebo.
Conclusions
Supplementation of 60,000 IU monthly oral vitamin D3 (~2000 IU per day) for 16 weeks is effective at improving vascular endothelial function in African American adults.
Keywords: Vitamin D, Endothelial Function, African American, Cardiovascular Disease
INTRODUCTION
Treatment of traditional cardiovascular disease risk factors have been shown to reduce all-cause mortality; however, further understanding of emerging non-traditional risk factors such as vitamin D deficiency, as it relates to cardiovascular disease risk, is warranted. Recently, a body of cross-sectional data has indicated a “link” between low vitamin D status and elevated cardiovascular disease risk1.
Brachial artery flow-mediated dilation (FMD) has been recognized as a valid and reliable non-invasive assessment of nitric oxide dependent vasodilation and endothelial function. Not only has endothelial dysfunction been proposed to manifest atherosclerotic cardiovascular disease, endothelial dysfunction determined by the FMD test has been identified as an independent predictor of future cardiovascular events2. To our knowledge, there have only been two studies to evaluate the effect of vitamin D supplementation on FMD; however, both studies investigated Caucasian subjects who were vitamin D deficient3, 4.
Thus, the present study sought to test the hypothesis that 16 weeks of 60,000 IU monthly supplementation of oral vitamin D3 (~2000 IU per day5) would increase concentrations of vitamin D and contribute to improvements in FMD in African Americans, whereas no change in FMD would be observed in the placebo group. A dose of 2,000 IU/day vitamin D3 was chosen in the present study because it has previously been recognized as the Tolerable Upper Intake Level, and considered to have no adverse health effects6.
METHODS
Subjects
Seventy African American subjects reported to the Georgia Prevention Institute for onsite screening. Subjects between the ages of 19 and 50 were recruited in 2009 during the months of November and December through community flyers and word of mouth. Only apparently healthy, African American men and women with no overt cardiovascular, pulmonary, or metabolic disease were included into the study. Subjects were excluded if they 1) were hypertensive, 2) had hyperlipidemia, 3) had evidence of diabetes (screening glycocylated hemoglobin (HbA1c) > 6.5) or gastrointestinal disorders, 4) were taking any medications known to affect calcium and/or vitamin D metabolism, 5) were taking any vasoactive medications, and 6) were taking any vitamin, mineral, or herbal supplements. All subjects provided written informed consent prior to study initiation. The protocol was approved by the Human Assurance Committee of the Medical College of Georgia.
Experimental Design
A double-blind, randomized, placebo controlled clinical trial (clinical trials.gov #NCT01141192) was conducted. Following screening, all eligible subjects were randomly assigned into either the vitamin D group or placebo group by the Medical College of Georgia’s Clinical Research Pharmacy. Participants were asked to fast for at least 12 hours prior to the testing. When they arrived at the Georgia Prevention Institute in the morning, a fasting blood draw was performed and the first spot urine was collected. All doses were dispensed by the Clinical Research Pharmacy and given to the subjects by the investigators. Subjects were then instructed to report to the Georgia Prevention Institute for investigator supervised dosing every 4 weeks, for a total of 16 weeks from February to May. For each dosing visit, the experimental group received 60,000 IU oral vitamin D3 (Bio-Tech Pharmacal Inc, Fayetteville, AR) whereas the control group received an identical size, shape, and color placebo (microcrystalline cellulose, fumed silica). All testing was conducted at baseline and 16 weeks.
Subject Characteristics
Testing at baseline and 16 weeks included anthropometric assessments of height, weight, and body mass index (BMI). Additionally, resting blood pressure was evaluated in all subjects using established protocols7. Total body fat (%) was determined using dual-energy x-ray absorptiometry (QDR-4500W; Hologic, Waltham, MA). Total cholesterol, high density lipoproteins (HDL), low-density lipoproteins (LDL) and triglycerides were obtained using the Cardiochek point of care device (Polymer Technology Systems, Indianapolis, IN). Glycocylated hemoglobin (HbA1c) was determined using the Bayer A1cNow+ point of care device (Bayer HealthCare LLC, Sunnyvale, CA).
Biochemical Analysis of 25 Hydroxyvitamin D, Parathyroid Hormone, and Calcium
Serum 25(OH)D concentrations were determined from fasting blood using an enzyme immunoassay (Immunodiagnostic Systems, Fountain Hills, AZ) according to the manufacturer’s specifications. Analytical reliability of the 25(OH)D assays was monitored though participation in DEQAS (Vitamin D External Quality Assessment Scheme) and was deemed acceptable. The intra- and inter assay coefficient of variations for serum 25(OH)D were 5.9% and 6.6%, respectively.
Bioactive intact parathyroid hormone (PTH) was determined in serum using an ELISA (Immutopics, Inc., San Clemente CA) according to the manufacturer’s specifications. The intra-assay coefficient of variations for serum PTH was 5.7%.
Both serum and urine Ca2+ were determined using the Biovision Colorimetric Calcium Assay Kit (Biovision, Mountain View, CA) according to the manufacturer’s specifications. The intra-assay coefficient of variations for serum and urine calcium were, (5.9% and 7.0%), respectively
Flow-Mediated Dilation (FMD)
Brachial artery FMD was performed in accordance with the recent tutorial on the Ultrasound Assessment of FMD8. Briefly, using a 12 MHz linear transducer, simultaneous B-mode and blood velocity profiles (duplex mode) of the brachial artery were obtained (Logiq e, GE Medical Systems, Milwaukee, WI). A forearm occlusion cuff (D.E. Hokanson, Bellevue, WA), placed immediately distal to the medial epicondyle, was rapidly inflated to 250 mm Hg for 5 minutes (E-20 rapid cuff inflator, D.E. Hokanson, Bellevue, WA) to induce arterial occlusion and subsequent reactive hyperemia of the brachial artery. ECG gaiting (Accusync 72, Accusync Medical Research Corporation, Milford, CN) was utilized to capture end-diastolic arterial diameters for automated offline analysis of brachial artery vasodilation (Medical Imaging Applications, Coralville, Iowa). Hyperemic diameter and blood velocity were recorded every 4 seconds for the first 20 seconds and every 5 seconds for the remainder of the 2 minute collection period. Peak diameter was determined by the highest 5 second average following cuff release according to recent recommendations8. FMD is expressed as a percent increase in peak diameter from baseline diameter. In our lab, the intra-observer reliability for FMD analysis (coefficient of variations) for baseline diameter, FMD, and FMD/shear are 0.5%, 12.8%, and 12.2%, respectively. Additionally, the intra-class correlation coefficients for baseline diameter, FMD, and FMD/shear are 0.999, 0.951, and 0.963, respectively.
Shear Rate
Cumulative shear rate (area under the curve, s-1, AUC) was determined using the trapezoidal rule, every four seconds for the first 20 seconds following cuff release, and every 5 seconds thereafter for the remainder of the 2 minute data collection period. To normalize FMD for the vasodilatory stimulus (shear rate), FMD was divided by the cumulative shear rate AUC defined by the attainment of peak dilation and presented as FMD/shear, as previously described9.
Statistical Analysis
Descriptive statistics and independent t-tests were performed to identify differences in subject characteristics between groups. Overall, a three-way mixed factorial 2×2×2 (Group × Sex × Time) analysis of variance (ANOVA) was performed to identify differences in serum 25(OH)D, serum PTH, serum Ca2+, urine Ca2+, baseline diameter, peak diameter, absolute change in diameter, FMD, shear rate, FMD/shear, and time to peak vasodilation. When indicated by a significant interaction, simple main effects were performed to identify where the specific differences exist. Subsequently, conclusions were drawn because all independent variables consisted of only two levels and 1 degree of freedom. Where noted, within group analysis represents the time main effect whereas between groups analysis represents the treatment main effect. Regression analyses were performed to identify the relationships among adiposity, vitamin D, and FMD. All statistics were performed using commercially available software (SPSS Inc., Chicago, IL, USA: v.15.0) and multiple comparisons were corrected using the Bonferroni test. Data are reported as mean ± SEM. Significance was set at p<0.05.
RESULTS
Subject Characteristics
Of the 70 subjects screened, only 57 were found eligible and randomized into the study; however, 8 subjects (4 in each group) were unobtainable/unresponsive to follow up and were dropped from the study. Additionally, four subjects (2 in each group) were unavailable for FMD testing. Therefore, the analyses are comprised of a total of 45 subjects whom completed both baseline and post testing; 23 in the placebo group and 22 in the vitamin D group. Baseline subject characteristics are presented in Table 1. The changes in subject characteristics (post testing – pre testing) following 16 weeks of treatment are presented in Table 2.
Table 1.
Baseline Subject Characteristics
| Variable | Placebo | 2000 IU | p-value |
|---|---|---|---|
| N | 23 | 22 | - |
| Men (%) | 52 | 41 | 0.65 |
| Age (yrs) | 31±2 | 29±2 | 0.19 |
| Height (cm) | 1.72±0.02 | 1.70±0.02 | 0.65 |
| Weight (kg) | 85.5±4.3 | 87.2±5.2 | 0.54 |
| BMI (m2/kg) | 29.1±1.5 | 30.4±1.8 | 0.35 |
| Body fat (%) | 29.8±2.7 | 31.1±2.5 | 0.48 |
| SBP (mm Hg) | 123±3 | 124±4 | 0.19 |
| DBP (mm Hg) | 75±2 | 74±2 | 0.60 |
| TC (mg/dL) | 154+8 | 136±6 | <0.01 |
| HDL (mg/dL) | 49±3 | 52±3 | 0.97 |
| LDL (mg/dL) | 101±8 | 71±7 | 0.18 |
| TG (mg/dL) | 81±5 | 67±4 | 0.13 |
| HbA1c (mg/dL) | 5.4±0.1 | 5.6±0.2 | 0.22 |
| 25(OH)D (nmol/L) | 38.2±3.0 | 34.3±2.2 | 0.40 |
| PTH (pg/ml) | 24.8±2.8 | 21.0±2.6 | 0.31 |
| Ca (mg/dL) / Cr (mg/dL) | 0.10±0.07 | 0.12±0.08 | 0.70 |
Values are mean±sem. Abbreviations: BMI, Body mass index; SBP, Systolic blood pressure; DBP, Diastolic blood pressure; TC, Total cholesterol; HDL, High density lipo-protein; LDL, Low density lipo-protein; TG, Triglycerides; HbA1c, Hemoglobin A1c; 25(OH)D, 25-hydroxyvitamin D; PTH, Serum parathyroid hormone; Ca/Cr, Urine calcium: creatinine.
Table 2.
Parameters of Vascular Endothelial Function Testing at baseline and 16-weeks following supplementation
| Variable | Placebo | 2000 IU | ||||
|---|---|---|---|---|---|---|
| Baseline | 16 weeks | p-value | Baseline | 16 weeks | p-value | |
| Baseline diameter (cm) | 0.351±0.015 | 0.350±0.016 | 0.85 | 0.332±0.056 | 0.332±0.011 | 0.82 |
| Peak diameter (cm) | 0.374±0.015 | 0.369±0.016 | 0.44 | 0.356±0.01 | 0.362±0.013 | 0.39 |
| Absolute change (cm) | 0.023±0.003 | 0.018±0.002 | 0.15 | 0.025±0.003 | 0.029±0.003* | 0.17 |
| Time to peak vasodilation (s) | 38±3 | 43±4 | 0.24 | 54±6† | 43±3 | 0.02 |
Note: P-values denote within group effects.
Significant (p=0.01) from Placebo 16 weeks
Significant (p=0.02) from Placebo Baseline
25 Hydroxyvitamin D, Parathyroid Hormone, and Calcium
Figure 1 illustrates the percent change in serum 25(OH)D, serum PTH, and urinary Ca2+ normalized by creatinine from pre to post test. No differences in concentrations of 25(OH)D were observed between groups at baseline. A Treatment × Time interaction (F1,41 = 66.5; p<0.001) was detected such that a robust increase in 25(OH)D was observed in the vitamin D group, whereas the placebo group exhibited a slight increase in 25(OH)D (Figure 1). No differences in PTH, either between groups (p=0.35) or within groups (p=0.28), were observed at baseline or at 16 weeks (Figure 1). Urinary Ca2+ normalized by creatinine was also unchanged following treatment between groups (p=0.70) and within groups (p=0.48) (Figure 1). Additionally, serum Ca2+ was unchanged in the placebo (9.5±0.2 mg/dl vs. 9.7±0.3 mg/dl; p=0.61) and vitamin D (10.1±0.4 mg/dl vs. 9.7±0.4 mg/dl; p=0.25) groups at baseline and 16 weeks, respectively.
Figure 1.
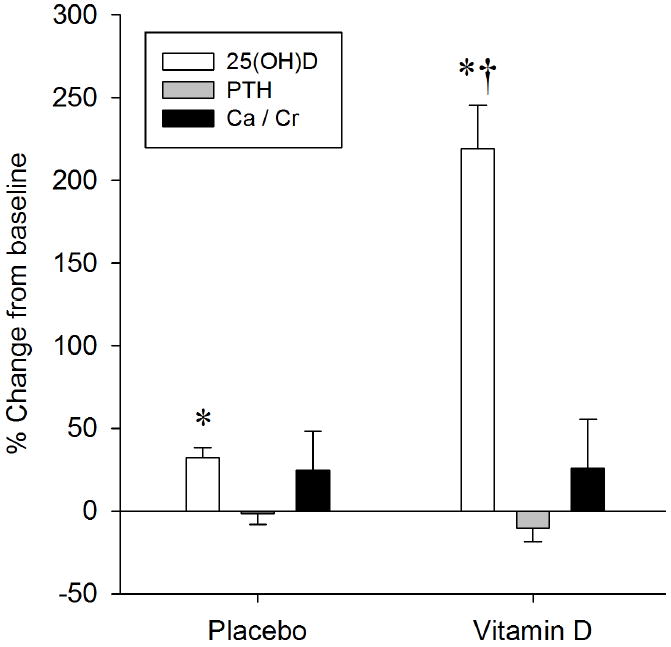
The effect of 16 weeks of placebo or vitamin D supplementation on 25 hydroxyvitamin D (25(OH)D), serum parathyroid hormone (PTH), and urinary calcium (Ca) / Creatinine (Cr) ratio. Data are presented as percent change from baseline. *Significant change from baseline. †Significant change from placebo.
Flow-Mediated Dilation (FMD) Testing
The parameters of FMD testing at baseline and following 16 weeks of placebo and vitamin D supplementation are presented in Table 2.
Baseline and Peak Diameter
Overall, men exhibited a larger baseline diameter (F1,41 = 54.1; p<0.001) compared to women (0.40±0.01 cm vs. 0.30±0.01 cm, respectively). However, at either pretesting or following 16 weeks of placebo or vitamin D treatment, no differences in baseline diameter was observed within groups (p=0.92) or between groups (p=0.35). A greater peak diameter (F1,41 = 57.3; p<0.001) following cuff release was observed in men (0.42±0.01 cm) compared to women (0.32±0.01 cm); however, no differences in peak diameter were observed within groups (p=0.94) or between groups (p=0.65) either at pretesting or following 16 weeks of placebo or vitamin D treatment.
Flow-Mediated Dilation
No Treatment × Sex (p=0.50) or Time × Sex (p=0.48) interactions were detected for FMD between men and women. Additionally, FMD was similar (p=0.08) between groups. Therefore sex data were pooled within each group. Figure 2 illustrates the FMD, shear rate, and FMD normalized by shear rate findings. At baseline, no differences (p=0.11) in FMD was observed between groups. A significant Treatment × Time interaction (F1,41 = 4.2; p=0.047) was detected to indicate that the placebo and vitamin D groups responded differently to 16 weeks of respective treatment. Simple main effects further identified a significantly greater FMD in the vitamin D group compared to the placebo group at 16 weeks (Figure 2A). A similar Treatment × Time interaction (F1,41 = 4.2; p=0.048) for absolute change in diameter was also detected to indicate a greater change (p=0.01) in diameter following 16 weeks with vitamin D treatment compared to placebo.
Figure 2.

The effect of 16 weeks of placebo or vitamin D treatment on A) flow-mediated dilation, B) shear rate area under the curve (AUC), and C) flow-mediated dilation normalized for shear rate. *Significant from vitamin D at baseline. †Significant from placebo at 16 weeks.
Shear Rate
A greater (p<0.01) shear rate was observed in women (49212±3534 s-1, AUC) compared to men (33559±3968 s-1, AUC); however, no differences in shear rate AUC were detected between groups (Figure 2B). Accordingly, when sex data were pooled within groups, a significant (p<0.01) time main effect was observed to indicate an overall greater shear rate at baseline compared to 16 weeks (Figure 2B).
Flow-mediated Dilation Normalized for Shear Rate (FMD/Shear)
Figure 2C illustrates the FMD normalized for shear rate (FMD/Shear). Overall, FMD/shear was similar (p=0.62) between sexes at both pretest and 16 weeks. Additionally, no differences (p=0.24) in baseline FMD/Shear was observed between groups. Similar to the findings for FMD and absolute change in diameter, a significant Treatment × Time interaction (F1,41 = 4.2; p=0.048) was observed for FMD/shear. Simple main effects further identified 1) an improvement in FMD/Shear in the vitamin D group at 16 weeks compared to baseline whereas no change (p=0.50) was observed in the placebo group (Figure 2C), and 2) a greater (p=0.05) FMD/shear in the vitamin D group compared to the placebo group at 16 weeks (Figure 2C).
Time to Peak Vasodilation (TTP)
A Treatment × Time interaction (F1,41 = 5.3; p=0.03) was also detected in TTP to indicate the placebo and vitamin D groups each had a different response to 16 weeks of respective treatment. Simple main effects identified 1) the TTP was greater (p=0.02) at baseline in the vitamin D group compared to placebo, and 2) a significant (p=0.047) decrease in TTP vasodilation following supplementation only in the vitamin D group (Table 2).
DISCUSSION
Consistent with our original hypothesis, the present study observed an improvement in flow-mediated dilation following 60,000 IU (~2000 IU per day) of vitamin D3 in African Americans, whereas no change in endothelial function was observed following 16 weeks of placebo treatment.
Based on the current recommended vitamin D guidelines10, at baseline only 3 out of 23 subjects in the placebo group (13%) and 2 out of 22 subjects in the vitamin D group (9%) were classified as having insufficient (50-75 nmol/L) levels of vitamin D. All of the remaining subjects in both groups, except for one (in the placebo group), would have been classified as vitamin D deficient (< 50 nmol/L). At 16 weeks, only one subject in the placebo group achieved sufficiency (the same subject who was sufficient at baseline), whereas 73% of the vitamin D group achieved sufficient 25(OH)D concentrations (>75 nmol/L). The study was conducted between February and May in an attempt to limit the exposure of UVB radiation from the sun. Consequently, the additional sun exposure closer to post testing may have contributed to the slight but statistically significant increase in 25(OH)D in the placebo group (Figure 1).
Endothelial Function and Vitamin D
The FMD test has been indicated to represent an independent predictor of cardiovascular disease risk 2, 11 and has been referred to as a bio-assay of nitric oxide bioavailability and a non-invasive barometer of endothelial function 12. To our knowledge, our study is unique in that it is the first clinical trial to investigate the effect of oral vitamin D3 on FMD in African Americans; a population at great risk for both vitamin D deficiency and cardiovascular disease. The improvement in FMD we observed in African Americans following 16 weeks of vitamin D supplementation (Figure 2) is consistent with the limited FMD and vitamin D findings previously reported3, 4. Tarcin and colleagues3 observed a significant 3.4% improvement in FMD following 3 months of inter-muscular injections of vitamin D3 (300,000 IU) in 23 young (mean age 23±3 years; BMI = 23±4 kg/m2) asymptomatic, vitamin D deficient (below 25nmol/L) Turkish subjects. However, a placebo group was not included. In addition, Sugden and colleagues4 observed a significant 2.4% improvement in FMD, eight weeks following a single, oral, mega dose of 100,000 IU vitamin D2 in 17 patients (mean age 65±10 years; BMI = 32±6 kg/m2) with Type 2 diabetes. It is important to note that different doses, routes of administration, and forms of vitamin D were utilized in previous studies investigating FMD. In the present study, the vitamin D group received 60,000 IU of oral vitamin D3 every 4 weeks for a total of 16 weeks. This dose equates to approximately 2,000 IU vitamin D3 per day. Moreover, an advantage of the present study was the 100% compliance by having the subjects come to the laboratory for dosing.
Based on the present findings, it is reasonable to accept that vitamin D supplementation improves NO bioavailability. The direct mechanism of action is unknown; however, possible mechanisms by which vitamin D contributes to improvements in endothelial function include 1) inhibition of vascular smooth muscle proliferation, 2) suppression of vascular calcification, 3) down-regulation of pro-inflammatory cytokines, 4) up-regulation of anti-inflammatory cytokines, and 5) regulation of the renin-angiotensin system 13. Accordingly, further evidence to support vitamin D’s role as an anti inflammatory has recently emerged. Jablonski and colleagues14 observed an association between low concentrations of 25(OH)D and both elevated inflammatory markers and endothelial dysfunction14. When inflammation was inhibited through pharmacological intervention, endothelial function improved. Therefore, it is plausible that vitamin D controls the inflammatory environment to subsequently improve NO bioavailability.
FMD Parameters and Vitamin D
The present study incorporated many additional FMD parameters (presented in Table 2) which provide a novel comprehensive evaluation of vascular endothelial function that were not included in previous studies. Most notable are the shear and time to peak vasodilation (TTP) findings. Shear rate area under the curve (AUC) up until the time to peak vasodilation has been proposed to be the stimulus for the vasodilatory response15. Accordingly, based on the significantly smaller vessel diameter in women compared to men, it is unsurprising that shear rate was greater in the women. More importantly, no differences in shear rate between groups were observed. Moreover, when FMD was normalized for the shear stimulus (FMD/shear), results were consistent with the main FMD findings (Figure 2).
At baseline, TTP was longer in the vitamin D group compared to the placebo group; however, a significant decrease in TTP was only observed in the vitamin D group following 16 weeks of supplementation. The decrease in TTP following vitamin D supplementation in the present study may not only represent an increase in endothelium sensitivity to shear, but also represent a surrogate of reduced cardiovascular risk16, which is also consistent with the main FMD findings.
Consistent with the findings of Sugden et al4, albeit a significant Treatment × Time interaction for FMD, we did not observe any relationships between vitamin D and FMD. In contrast, a significant association between FMD and 25(OH)D in the vitamin D deficient group was observed by Tarcin et al3. The subjects investigated by Tarcin and colleagues were lean (BMI=23), whereas our findings and those of Sugden and colleagues were observed in overweight/obese individuals (BMI ~ 30 kg/m2 and 32 kg/m2, respectively). Based on previous reports indicating the relationship between adiposity and vitamin D, and now the present findings, it is plausible that adiposity may play an important role in the relationship between vitamin D and FMD.
Experimental Considerations
First, although the present study observed a Treatment by Time interaction for FMD, the sample size of this study was relatively small. Therefore, our findings should be replicated in a larger population. Second, our findings were observed following 16 weeks of supplementation. Accordingly, long-term clinical trials (e.g., 12 months) are warranted to demonstrate the sustainability of the profound vitamin D3 effects on FMD. Finally, although FMD has been demonstrated to be associated with cardiovascular disease risk and events, further studies are warranted to address the protective effects of vitamin D supplementation on other cardiovascular risk factors and outcomes.
Conclusions
In conclusion, suboptimal levels of vitamin D have been indicated to represent an emerging, non-traditional risk factor of cardiovascular disease. For the first time, the present study has identified an improvement in endothelial function following 16 weeks of 60,000 IU monthly oral vitamin D supplementation in African American adults. These findings indicate that monthly dosing of 2000 IU oral vitamin D is effective at improving vascular endothelial function in African Americans.
Acknowledgments
This study was funded by the Medical College of Georgia Diabetes and Obesity Discovery Institute (JW). YD is supported by NIH NHLBI grant HL077230. RAH is supported by the American Heart Association 10SDG3050006.
Footnotes
DISCLOSURES:
None.
References
- 1.Swales HH, Wang TJ. Vitamin D and cardiovascular disease risk: emerging evidence. Curr Opin Cardiol. 2010;22:513–517. doi: 10.1097/HCO.0b013e32833cd491. [DOI] [PubMed] [Google Scholar]
- 2.Yeboah J, Crouse JR, Hsu FC, Burke GL, Herrington DM. Brachial flow-mediated dilation predicts incident cardiovascular events in older adults: the Cardiovascular Health Study. Circulation. 2007;115:2390–2397. doi: 10.1161/CIRCULATIONAHA.106.678276. [DOI] [PubMed] [Google Scholar]
- 3.Tarcin O, Yavuz DG, Ozben B, Telli A, Ogunc AV, Yuksel M, Toprak A, Yazici D, Sancak S, Deyneli O, Akalin S. Effect of vitamin D deficiency and replacement on endothelial function in asymptomatic subjects. J Clin Endocrinol Metab. 2009;94:4023–4030. doi: 10.1210/jc.2008-1212. [DOI] [PubMed] [Google Scholar]
- 4.Sugden JA, Davies JI, Witham MD, Morris AD, Struthers AD. Vitamin D improves endothelial function in patients with Type 2 diabetes mellitus and low vitamin D levels. Diabet Med. 2008;25:320–325. doi: 10.1111/j.1464-5491.2007.02360.x. [DOI] [PubMed] [Google Scholar]
- 5.Maalouf J, Nabulsi M, Vieth R, Kimball S, El-Rassi R, Mahfoud Z, El-Hajj Fuleihan G. Short- and long-term safety of weekly high-dose vitamin D3 supplementation in school children. J Clin Endocrinol Metab. 2008;93:2693–2701. doi: 10.1210/jc.2007-2530. [DOI] [PMC free article] [PubMed] [Google Scholar]
- 6.Yates AA, Schlicker SA, Suitor CW. Dietary Reference Intakes: the new basis for recommendations for calcium and related nutrients, B vitamins, and choline. J Am Diet Assoc. 1998;98:699–706. doi: 10.1016/S0002-8223(98)00160-6. [DOI] [PubMed] [Google Scholar]
- 7.Kapuku GK, Treiber FA, Davis HC, Harshfield GA, Cook BB, Mensah GA. Hemodynamic function at rest, during acute stress, and in the field: predictors of cardiac structure and function 2 years later in youth. Hypertension. 1999;34:1026–1031. doi: 10.1161/01.hyp.34.5.1026. [DOI] [PubMed] [Google Scholar]
- 8.Harris RA, Nishiyama SK, Wray DW, Richardson RS. Ultrasound assessment of flow-mediated dilation. Hypertension. 2010;55:1075–1085. doi: 10.1161/HYPERTENSIONAHA.110.150821. [DOI] [PMC free article] [PubMed] [Google Scholar]
- 9.Harris RA, Nishiyama SK, Wray DW, Tedjasaputra V, Bailey DM, Richardson RS. The effect of oral antioxidants on brachial artery flow-mediated dilation following 5 and 10 min of ischemia. Eur J Appl Physiol. 2009;107:445–453. doi: 10.1007/s00421-009-1147-x. [DOI] [PubMed] [Google Scholar]
- 10.Institute of Medicine FaNB, Standing Committee on the Scientific Evaluation of Dietary Reference Intakes Vitamin D. Dietary Reference Intakes for Calcium, Phosphorus, Magnesium, Vitamin D, and Fluoride. Washington, DC: National Academy Press; 1997. pp. 250–287. [Google Scholar]
- 11.Yeboah J, Folsom AR, Burke GL, Johnson C, Polak JF, Post W, Lima JA, Crouse JR, Herrington DM. Predictive value of brachial flow-mediated dilation for incident cardiovascular events in a population-based study: the multi-ethnic study of atherosclerosis. Circulation. 2009;120:502–509. doi: 10.1161/CIRCULATIONAHA.109.864801. [DOI] [PMC free article] [PubMed] [Google Scholar]
- 12.Green D. Point: Flow-mediated dilation does reflect nitric oxide-mediated endothelial function. J Appl Physiol. 2005;99:1233–1234. doi: 10.1152/japplphysiol.00601.2005. discussion 1237-1238. [DOI] [PubMed] [Google Scholar]
- 13.Zittermann A, Schleithoff SS, Koerfer R. Putting cardiovascular disease and vitamin D insufficiency into perspective. Br J Nutr. 2005;94:483–492. doi: 10.1079/bjn20051544. [DOI] [PubMed] [Google Scholar]
- 14.Jablonski KL, Chonchol M, Pierce GL, Walker AE, Seals DR. 25-Hydroxyvitamin D Deficiency Is Associated With Inflammation-Linked Vascular Endothelial Dysfunction in Middle-Aged and Older Adults. Hypertension. 2011 doi: 10.1161/HYPERTENSIONAHA.110.160929. [DOI] [PMC free article] [PubMed] [Google Scholar]
- 15.Pyke KE, Tschakovsky ME. Peak vs. total reactive hyperemia: which determines the magnitude of flow-mediated dilation? J Appl Physiol. 2007;102:1510–1519. doi: 10.1152/japplphysiol.01024.2006. [DOI] [PubMed] [Google Scholar]
- 16.Black MA, Cable NT, Thijssen DH, Green DJ. Importance of measuring the time course of flow-mediated dilatation in humans. Hypertension. 2008;51:203–210. doi: 10.1161/HYPERTENSIONAHA.107.101014. [DOI] [PubMed] [Google Scholar]
- 17.Wortsman J, Matsuoka LY, Chen TC, Lu Z, Holick MF. Decreased bioavailability of vitamin D in obesity. Am J Clin Nutr. 2000;72:690–693. doi: 10.1093/ajcn/72.3.690. [DOI] [PubMed] [Google Scholar]