Abstract
Chronic kidney disease (CKD) has become a worldwide public health problem. However, its effect on osseointegration of dental implants is largely unknown. The aim of this study is to investigate whether CKD impairs the quality of the osseointegration of titanium implants. Uremia was induced by 5/6 nephrectomy in mice, and serum levels of BUN, FGF23, PTH and ALP were significantly increased. For in vitro tests, bone marrow mesenchymal stem cells (BMMSCs) were obtained and cultured on titanium discs. There was no significant difference in term of expression of osteogenic marker genes including Osx, Col-1, Ocn, and Opn, as quantified by qPCR. Moreover, Alizarin Red S staining showed comparable mineralized nodules formation. Histomorphometrical analysis of experimental implants inserted in the femurs of CKD mice revealed a trend of decreased BIC ratio at 2-week healing. The strength of bone-implant integration, as measured by a push-in method, was significantly lower for the CKD group at 2 weeks, although a comparable level was reached at 4 weeks. These results demonstrated that CKD only negatively affects the osseointegration of titanium implants at the early stage.
Keywords: Dental implants, Chronic kidney diseases, Bone mineralization, Osseointegration, Parathyroid hormone (PTH), Fibroblast growth factor 23 (FGF23)
Introduction
Chronic kidney disease (CKD) has become a worldwide public health problem, with growing prevalence, high cost and severe complications [1–3]. Studies have shown that the prevalence of CKD in USA and Norway was 13.0% and 10.2%, respectively [4,5]. More recently, a cross-sectional survey of a nationally representative sample of Chinese adults revealed that the overall prevalence of CKD was 10.8% [6]. The number of patients with CKD in this rapid developing country was estimated to be 119.5 million, the highest prevalence in the world.
In CKD patients, the normal physiological mechanisms regulating blood levels of calcium, phosphate, vitamin D, parathyroid hormone (PTH) and fibroblast growth factor 23 (FGF23) are disturbed, which subsequently impact on the bone structural integrity [7,8] and lead to chronic kidney disease-mineral and bone disorders (CKD-MBD) [9]. In CKD patients, histological evidence of bone disease affected 84% of all subjects (32% osteitis fibrosa, 20% mixed bone disease, 8% osteomalacia, 6% mild disease and 18% adynamic bone disease) [10]. More severely, only 2% of dialysis patients have normal histomorphometric analyses of bone biopsy. A recent study examined the characterization of the mandibular bone in a mouse model of chronic kidney disease, and the results showed a significant reduction in cortical bone thickness [11].
The chronic kidney disease is also regarded as a risk factor of periodontitis [12–15]. Borawski reported that the loss of clinical attachment level of the CKD patients was significantly higher than that of general population subjects, indicating a high severity of periodontitis in the renal failure patients [16].
Although chronic kidney disease has been considered as a worldwide public health problem, its effect on dental implant treatment is largely unknown. A quite common opinion in both the oral and nephrological literature suggests that osseous periodontal surgical procedures such as bone grafting or dental implants may be contraindicated in patients with significant renal osteodystrophy [14,17]. Others, however, investigated the quantity and quality of the alveolar bone of dialysis patients, which showed that the residual bone volumes were adequate for implant insertion, suggesting this type of treatment is applicable to CKD patients [18].
The aim of this study is to investigate the effect of CKD on osteogenic differentiation of bone marrow mesenchymal stem cells (BMMSCs) and peri-implant bone formation in a CKD mouse model, so as to determine to what extent CKD impairs the osseointegration of titanium implants.
Materials and methods
Animals
Female C57BL mice at age of 9-week-old were purchased from Charles River Laboratories International Inc. (Wilmington, MA). The animals were kept under climate-controlled conditions and fed with standard diet. All studies were approved by the Institutional Animal Care and Use Committee at the Harvard Medical School (Boston, MA).
Surgical procedure to induce uremia
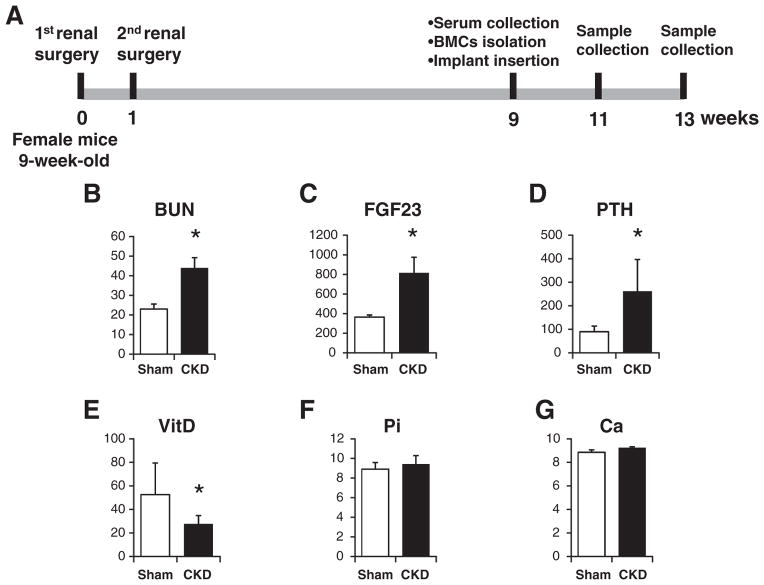
The CKD mice were established by a two-step 5/6 nephrectomy to induce uremia as described previously [19]. Briefly, the first procedure involves electrocautery of the left kidney. It was approached through a 2-cm-long lumber incision and exposed by fine dissection of the surrounding tissues including the peri-renal fat and adrenal gland. The entire cortex of the right kidney was cauterized except for a 2-mm area around the hilum. The kidney was then returned to the renal fossa, and the subcutaneous tissues were sutured with 6–0 silk. The skin was closed with surgical clips. After 1 week, a total nephrectomy of the right kidney was performed by ligation of the renal hilum with a 5–0 silk suture and surgical excision of the kidney. The wound was closed as the first surgery. Sham surgery consisted of anesthetic, flank incision exposing the kidney, and closure of the abdominal wall. The illustration of the work flow is shown in Fig. 1A.
Fig. 1.
Illustration of the work flow and serum biochemical measurements. (A) Illustration of the work flow. (B) Serum BUN. (C) Serum FGF23. (D) Serum PTH. (E) Serum vitamin D. (F) Serum phosphate. (G) Serum calcium. *: p < 0.05.
Serum biochemical assays
Eight weeks after the secondary surgery, blood of the mice was collected by cheek pouch. Serum biochemistry was performed using commercially available kits: Blood urea nitrogen (BUN) (Roche Diagnostics, Indianapolis, IN); FGF23 (Immutopics, San Clemente, CA), PTH (Immutopics, San Clemente, CA); 1,25(OH)2D (Immunodiagnostic Systems Ltd., Fountain Hills, AZ); Calcium and Phosphate (Stanbio Laboratory, Boerne, TX). For the assay of serum ALP activity, the serum was diluted 25 times and measured using a SensoLyte® pNPP Alkaline Phosphatase Assay Kit (AnaSpec Inc., Fremont, CA).
Primary culture of BMMSCs on titanium disks
Eight weeks after the secondary surgery, five mice from each group were sacrificed and the femurs were dissected. The bone marrow of the femurs was flushed, pooled together, and cultured with alpha-modified Eagle’s medium supplemented with 10% fetal bovine serum and antibiotic-antimycotic solution. At about 80% confluence, cells were detached and seeded onto SLA titanium disks at a density of 3 × 10⁴ cells/cm2, with osteogenic medium, which contains 50 ug/ml ascorbic acid and 10 mM Na-β-glycerophosphate. The culture medium was renewed every other day.
Alkaline phosphatase staining
After 10 days, cultured BMMSCs were washed twice with saline, and fixed in citrate buffered acetone for 30 seconds, followed by gently rinse in deionized water for 1 min. Cells were incubated with 120 mM Tris buffer (pH 8.4) containing 0.9 mM naphthol AS-MX phosphate and 1.8 mM fast blue RR covered from light at room temperature. After 30 min, the cells were rinsed thoroughly in deionized water.
Alizarin Red S staining
After 21 days, cells were washed three times with PBS and fixed in 10% neutral formalin for 5 min. Cells were then incubated in 2 wt% Alizarin Red S solution (pH 4.2) for 10 min at room temperature and rinsed with distilled water. The color intensity of the stain was evaluated as an indicator for mineralization.
RNA extraction and quantitative real-time RT-PCR
Total RNA was extracted after 8-day culture using Rneasy Mini kits (Qiagen, Valencia, CA). The detailed procedures for real-time RT-PCR were described previously [20].
Implant surgery
Eight weeks after the second surgery of renal ablation, the mice were subjected to implant placement by the method described by Xu et al. [21]. Titanium implants with SLA surface (1 mm in diameter and 4 mm in length) were obtained from Institut Straumann AG (Basel, Switzerland). They were cut to the length of 2 mm before insertion. After careful exposure of the distal aspects of the femurs via skin incision and muscle dissection, implant sites were prepared on both sides of the anterior-distal surfaces of the femurs by sequential drilling under cooled sterile saline irrigation with 0.7- and 1.0-mm surgical stainless steel twist drills. Then, the implants were press-fitted into the holes reaching primary stability. After the insertion of the implant, the muscles were carefully sutured with 6–0 silk, which covered the implant and further guaranteed its protection in the biological environment. Then the skin was closed with 5–0 silk. Ten mice were allocated to each group.
Implant biomechanical push-in test
One side of the femur containing a cylindrical implant of each mouse was harvested and embedded into auto-polymerizing resin with the top surface of the implant level. The testing machine (AG-TA electronic universal testing machine, SHIMADZU, Japan) equipped with a pushing rod (diameter = 0.8 mm) was used to load the implant vertically downward at a crosshead speed of 1 mm/min. The push-in value was determined by measuring the peak of the load–displacement curve.
Histological preparation
After 2 and 4 weeks of healing after the implant placement, the other side of the femur carrying an implant of each mouse was harvested and fixed in 10% buffered formalin for 1 week at 4 °C. Specimens were dehydrated and embedded in light-curing epoxy resin (Technovit 7200VLC, Hereaus Kulzer, Wehrheim, Germany). Embedded specimens were sawed perpendicular to the longitudinal axis of the implants at a site 0.5 mm from its apical end. Then the specimens were ground to about 50 μm thickness with a grinding system (Exakt Apparatebau, Norderstedt, Germany). Sections were stained with Stevenel’s blue and Van Gieson’s picro fuchsin stain, and observed by light microscopy.
Histomorphometric measurement
Images of the implant and peri-implant bone tissues were digitized and histomorphometrically analyzed with NIH Image J (National Institutes of Health, USA). Bone-implant contact (BIC) was calculated as the linear percentage of direct bone-to-implant contact to the total surface of the implant.
Statistical analysis
All values are presented as mean ± SD. Statistically significant differences were assessed by independent Student t test. A p value of less than 0.05 was considered to be statistically significant.
Results
Serum biochemistry
Significant differences were observed between the sham group and the CKD group in multiple parameters measured, indicating the successful establishment of the uremic mouse model. Serum BUN (Fig. 1B), FGF23 (Fig. 1C), and PTH (Fig. 1D) in the CKD group were increased about 2.0-fold, 2.3-fold, and 3.0-fold, respectively, compared to the sham control group. Meanwhile, the level of active form of VitD was significantly decreased from 52.53 ± 26.91 pmol/L to 27.51 ± 7.22 pmol/L (Fig. 1E). The measurement also revealed no significant increase in serum phosphate (Fig. 1F) and calcium (Fig. 1G) levels in the CKD group compared to the sham group.
Analysis of osteoblastic differentiation markers
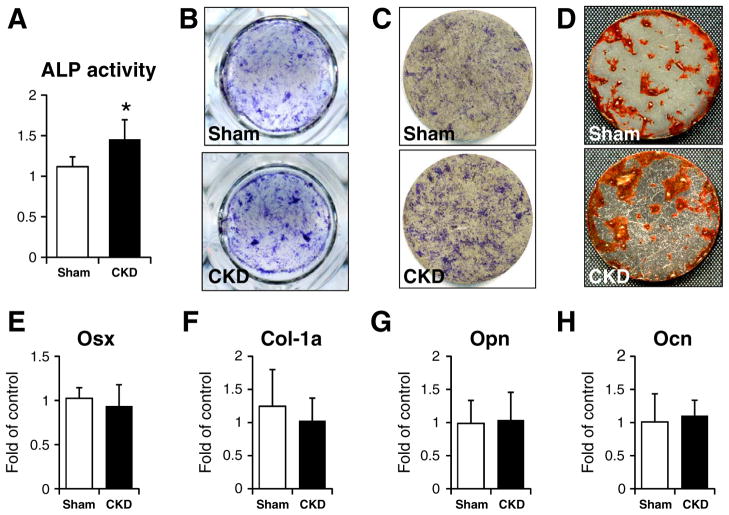
As shown in Fig. 2A, serum ALP activity was significantly increased in the CKD mice. This observation was further confirmed by the ALP staining of BMMSCs cultured either in 24-well plates (Fig. 2B) or on the titanium discs (Fig. 2C). In both situations, BMMSCs derived from CKD mice showed more intensive signals.
Fig. 2.
Analysis of osteoblastic differentiation markers. (A) serum ALP activity. (B) ALP staining of cells seeded on titanium discs. (C) ALP staining of cells cultured on titanium discs. (D) Alizarin S staining of cells cultured on titanium discs. Gene expression of Osx (E), Col-1a (F), Opn (G) and Ocn (H). *: p < 0.05.
After culture for 21 days, the cells from the CKD and sham groups were stained with Alizarin Red S, and demonstrated similar staining intensity, indicating that both of them could mineralize normally in vitro (Fig. 2D).
We then quantified the expression of osteogenic marker genes, including Osterix (osx), collagen type I (Col-1a), Osteopontin (Opn) and osteocalcin (Ocn). No significant difference was observed for all four markers (Figs. 2E–H).
Histology and histomorphometry
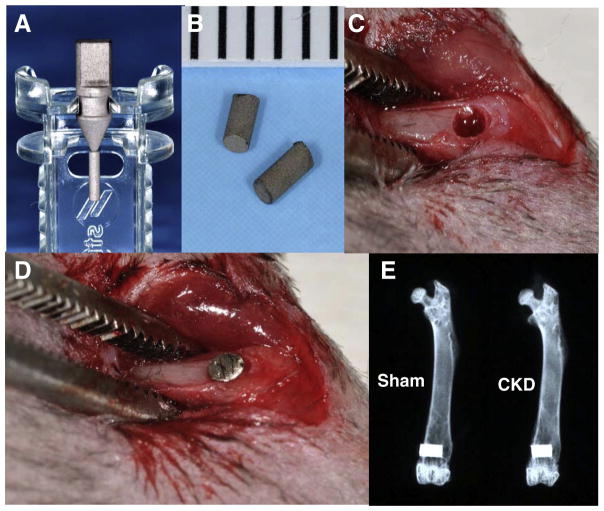
Titanium implants were placed as described in Methods, and as shown in Fig. 3. As anticipated, all mice survived during the observation period and no inflammation at the implant site was observed. The ex vivo X-ray examination of the femurs showed that the implants were surrounded with bone without any notable gap, indicating successful osteointegration for both groups (Fig. 3E).
Fig. 3.
Implant surgery. (A&B) Experimental titanium implants. (C) Implant sites prepared in the distal end of femur. (D) Implant inserted into the distal end of femur. (E) X-ray examination of the femurs with implants.
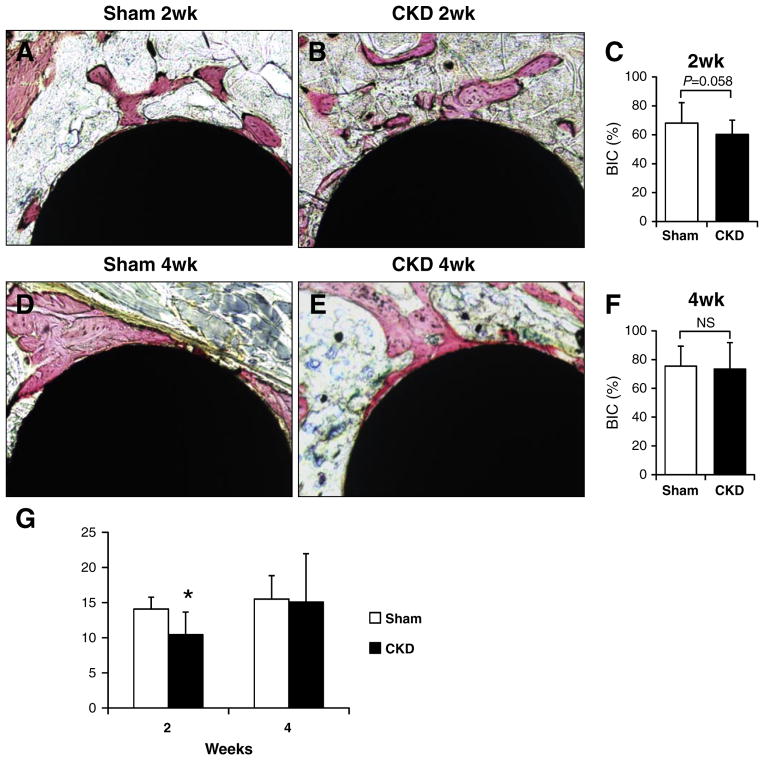
The observation of histological sections confirmed a direct bone-implant contact at both 2 weeks (Figs. 4A&B) and 4 weeks (Figs. 4D&E). Further histomorphometrical analyses did not reveal statistically significant differences for peri-implant BIC ratio at 2 weeks (Fig. 4C). However, it was noticeable that the BIC ratios for CKD and sham groups at the early healing stage (2 weeks) were 60.23 ± 9.92% and 68.08 ± 14.11%, respectively. The p value (p = 0.058) was very close to a significant difference, suggesting a trend of decreased BIC ratio for the CKD group at the 2-week healing. At 4-week healing, the BIC for the CKD group increased to 73.42 ± 18.36%, which is comparable to that of sham group (75.43 ± 13.90%, p < 0.05) (Fig. 4F).
Fig. 4.
Histology and biomechanical test. (A&B) Representative images of the histological sections at 2-week healing. (C) Bone-implant contact ratio at 2-week healing. (D&E) Representative images of the histological sections at 4-week healing. (F) Bone-implant contact ratio at 4-week healing. (G) Resistance of push-in tests. *: p < 0.05.
The strength of bone–titanium integration
At the early healing stage of week 2, the strength of bone–implant integration, measured by a push-in method, was significantly lower for the CKD group (14.09 ± 1.69 N), compared to that of sham one (10.23 ± 3.11 N) (Fig. 4G). At the late-stage of healing (4-week), there is no significant difference between both groups (p < 0.05).
Discussion
In the present study, an uremic mouse model was prepared and it was investigated on the effect of CKD on the osseointegration of titanium implants. In vitro studies showed that there was no significant difference in terms of expression of osteogenic marker genes, including Osx, Col-1, Ocn, and Opn, although BMMSCs derived from CKD mice exhibited increased ALP activity. Meanwhile, these cells showed comparable mineralized nodule formation. These data suggest that BMMSCs derived from CKD mice are able to differentiate and mineralize normally in vitro. However, we need to emphasize here that cells cultured in vitro are excluded and protected from the abnormal in vivo environment found during CKD, such as abnormal serum VitD, FGF23 and PTH levels, thereby maybe explaining the similar results with BMMSCs. Therefore, in vivo experiments were performed to verify the effect of CKD on osseointegration. X-ray examination and histological evaluation confirmed the successful osseointegration of titanium implants for both groups, indicating that dental implant treatment is applicable in our mouse model. However, it is notable that the biomechanical resistance of the CKD group was significantly decreased at 2-week of healing. Meanwhile, the BIC of the CKD group at 2 week is very close to significantly lower than that of control. These data indicate that CKD impaired the osseointegration of titanium implants at early healing stage.
In this study, a CKD mouse model was established using the 5/6 nephrectomy technique. This method is widely used to imitate the clinical status of CKD patients. The amount of several biochemical markers of the uremic condition as serum BUN, FGF23, PTH and ALP of CKD group were significantly increased, while the level of the active form VitD was diminished. These data are in agreement with previous studies published by other authors [22].
Our in vivo data indicate that there is a trend of decreased BIC ratio for the CKD group at the early stage of healing. This is consistence with the biomechanical push-in results, which showed significantly lower strength of bone-implant integration. The mechanism of the impaired osseointegration for CKD mice is still unknown. Studies have shown that the bone strength of CKD patients decreases significantly. Alem et al. [23] demonstrated a four-fold increase in risk of hip fracture in men and women treated by hemodialysis. Kidney failure leads to metabolic and mineral disorders, such as increased PTH and FGF23, as well as VitD deficiency. These troubles may adversely affect the bone remodeling process. Elevated PTH exerts its effects primarily on bone and stimulates osteoclasts to mobilize calcium from bone tissue to normalize serum calcium, resulting in bone resorption and reduced bone mass [24]. FGF23 is a hormone mainly produced from bone [25] and is a key regulator of serum phosphate [26]. FGF23 itself has also been recognized as an inhibitor of mineralization [27,28]. Studies demonstrated that FGF23 treatment of primary calvaria osteoblasts from wild-type mice or osteoblastic MC3T3-E1 cells leads to an inhibition of mineralization [27,28].
This study provides substantial in vitro and in vivo data on the effects of chronic kidney disease on implant osseointegration. The CKD mice are an established model bearing close resemblance to chronic kidney disease in humans. Although experimental factors, such as age, race, sex, pathogenic mechanism, and living environment, are well controlled in animal models, their biological response may differ from that of human. In addition, the bone architecture of the femur is different from human jaw bone. Moreover, the kidney disease is a staged process. Therefore, clinical trials are expected in the future to investigate the effect of CKD on osseointegration.
In conclusion, this study examined for the first time the effect of chronic kidney disease on osseointegration of titanium implants using an uremic mouse model. Although cells cultured on titanium discs showed normal differentiation and mineralization, and all implants reached osseointegration successfully in vivo, the chronic kidney disease impaired BIC ratio and strength of bone-implant integration at 2-week of healing. There is no significant difference for two groups after a longer healing period (4 weeks). These data imply that dental implant treatment might be applicable for CKD patients, but special requirements in terms of bone healing time may need to be taken in consideration.
Acknowledgments
This work was supported by grants from the National Natural Science Foundation of China (NSFC 30901696), New Century Excellent Talents in University (NCET-12-0379) and International Team of Implantology (ITI 717_2010) to QY, and the National Institute of Diabetes and Digestive and Kidney Diseases (NIDDK, R01-073944) to BL.
References
- 1.Saran R, Hedgeman E, Huseini M, Stack A, Shahinian V. Surveillance of chronic kidney disease around the world: tracking and reining in a global problem. Adv Chronic Kidney Dis. 2010;17:271–81. doi: 10.1053/j.ackd.2010.03.001. [DOI] [PubMed] [Google Scholar]
- 2.Gilbertson DT, Liu J, Xue JL, Louis TA, Solid CA, Ebben JP, et al. Projecting the number of patients with end-stage renal disease in the United States to the year 2015. J Am Soc Nephrol. 2005;16:3736–41. doi: 10.1681/ASN.2005010112. [DOI] [PubMed] [Google Scholar]
- 3.Levey AS, Atkins R, Coresh J, Cohen EP, Collins AJ, Eckardt KU, et al. Chronic kidney disease as a global public health problem: approaches and initiatives - a position statement from Kidney Disease Improving Global Outcomes. Kidney Int. 2007;72:247–59. doi: 10.1038/sj.ki.5002343. [DOI] [PubMed] [Google Scholar]
- 4.Hallan SI, Coresh J, Astor BC, Asberg A, Powe NR, Romundstad S, et al. International comparison of the relationship of chronic kidney disease prevalence and ESRD risk. J Am Soc Nephrol. 2006;17:2275–84. doi: 10.1681/ASN.2005121273. [DOI] [PubMed] [Google Scholar]
- 5.Coresh J, Selvin E, Stevens LA, Manzi J, Kusek JW, Eggers P, et al. Prevalence of chronic kidney disease in the United States. JAMA. 2007;298:2038–47. doi: 10.1001/jama.298.17.2038. [DOI] [PubMed] [Google Scholar]
- 6.Zhang L, Wang F, Wang L, Wang W, Liu B, Liu J, et al. Prevalence of chronic kidney disease in China: a cross-sectional survey. Lancet. 2012;379:815–22. doi: 10.1016/S0140-6736(12)60033-6. [DOI] [PubMed] [Google Scholar]
- 7.Pelletier S, Chapurlat R. Optimizing bone health in chronic kidney disease. Maturitas. 2010;65:325–33. doi: 10.1016/j.maturitas.2009.12.021. [DOI] [PubMed] [Google Scholar]
- 8.Ott SM. Bone disease in CKD. Curr Opin Nephrol Hypertens. 2012;21:376–81. doi: 10.1097/MNH.0b013e32835421f6. [DOI] [PubMed] [Google Scholar]
- 9.Moe S, Drueke T, Cunningham J, Goodman W, Martin K, Olgaard K, et al. Definition, evaluation, and classification of renal osteodystrophy: a position statement from Kidney Disease: Improving Global Outcomes (KDIGO) Kidney Int. 2006;69:1945–53. doi: 10.1038/sj.ki.5000414. [DOI] [PubMed] [Google Scholar]
- 10.KDIGO. Clinical practice guideline for the diagnosis, evaluation, prevention, and treatment of Chronic Kidney Disease-Mineral and Bone Disorder (CKD-MBD) Kidney Int. 2009:S1–S130. doi: 10.1038/ki.2009.188. Suppl. [DOI] [PubMed] [Google Scholar]
- 11.Lee MM, Chu EY, El-Abbadi MM, Foster BL, Tompkins KA, Giachelli CM, et al. Characterization of mandibular bone in a mouse model of chronic kidney disease. J Periodontol. 2010;81:300–9. doi: 10.1902/jop.2009.090379. [DOI] [PMC free article] [PubMed] [Google Scholar]
- 12.Chen LP, Chiang CK, Chan CP, Hung KY, Huang CS. Does periodontitis reflect inflammation and malnutrition status in hemodialysis patients? Am J Kidney Dis. 2006;47:815–22. doi: 10.1053/j.ajkd.2006.01.018. [DOI] [PubMed] [Google Scholar]
- 13.Naugle K, Darby ML, Bauman DB, Lineberger LT, Powers R. The oral health status of individuals on renal dialysis. Ann Periodontol. 1998;3:197–205. doi: 10.1902/annals.1998.3.1.197. [DOI] [PubMed] [Google Scholar]
- 14.Craig RG, Kotanko P, Kamer AR, Levin NW. Periodontal diseases–a modifiable source of systemic inflammation for the end-stage renal disease patient on haemodialysis therapy? Nephrol Dial Transplant. 2007;22:312–5. doi: 10.1093/ndt/gfl604. [DOI] [PubMed] [Google Scholar]
- 15.Cengiz MI, Sumer P, Cengiz S, Yavuz U. The effect of the duration of the dialysis in hemodialysis patients on dental and periodontal findings. Oral Dis. 2009;15:336–41. doi: 10.1111/j.1601-0825.2009.01530.x. [DOI] [PubMed] [Google Scholar]
- 16.Borawski J, Wilczynska-Borawska M, Stokowska W, Mysliwiec M. The periodontal status of pre-dialysis chronic kidney disease and maintenance dialysis patients. Nephrol Dial Transplant. 2007;22:457–64. doi: 10.1093/ndt/gfl676. [DOI] [PubMed] [Google Scholar]
- 17.Stellingsma C, Vissink A, Meijer HJ, Kuiper C, Raghoebar GM. Implantology and the severely resorbed edentulous mandible. Crit Rev Oral Biol Med. 2004;15:240–8. doi: 10.1177/154411130401500406. [DOI] [PubMed] [Google Scholar]
- 18.Dijakiewicz M, Wojtowicz A, Dijakiewicz J, Szycik V, Rutkowski P, Rutkowski B. Is implanto-prosthodontic treatment available for haemodialysis patients? Nephrol Dial Transplant. 2007;22:2722–4. doi: 10.1093/ndt/gfm317. [DOI] [PubMed] [Google Scholar]
- 19.Gagnon RF, Gallimore B. Characterization of a mouse model of chronic uremia. Urol Res. 1988;16:119–26. doi: 10.1007/BF00261969. [DOI] [PubMed] [Google Scholar]
- 20.Sun N, Zou H, Yang L, Morita K, Gong P, Shiba T, et al. Inorganic polyphosphates stimulate FGF23 expression through the FGFR pathway. Biochem Biophys Res Commun. 2012;428:298–302. doi: 10.1016/j.bbrc.2012.10.051. [DOI] [PubMed] [Google Scholar]
- 21.Xu B, Zhang J, Brewer E, Tu Q, Yu L, Tang J, et al. Osterix enhances BMSC-associated osseointegration of implants. J Dent Res. 2009;88:1003–7. doi: 10.1177/0022034509346928. [DOI] [PMC free article] [PubMed] [Google Scholar]
- 22.El-Abbadi MM, Pai AS, Leaf EM, Yang HY, Bartley BA, Quan KK, et al. Phosphate feeding induces arterial medial calcification in uremic mice: role of serum phosphorus, fibroblast growth factor-23, and osteopontin. Kidney Int. 2009;75:1297–307. doi: 10.1038/ki.2009.83. [DOI] [PMC free article] [PubMed] [Google Scholar]
- 23.Alem AM, Sherrard DJ, Gillen DL, Weiss NS, Beresford SA, Heckbert SR, et al. Increased risk of hip fracture among patients with end-stage renal disease. Kidney Int. 2000;58:396–9. doi: 10.1046/j.1523-1755.2000.00178.x. [DOI] [PubMed] [Google Scholar]
- 24.Cozzolino M, Dusso AS, Slatopolsky E. Role of calcium-phosphate product and bone-associated proteins on vascular calcification in renal failure. J Am Soc Nephrol. 2001;12:2511–6. doi: 10.1681/ASN.V12112511. [DOI] [PubMed] [Google Scholar]
- 25.Yoshiko Y, Wang H, Minamizaki T, Ijuin C, Yamamoto R, Suemune S, et al. Mineralized tissue cells are a principal source of FGF23. Bone. 2007;40:1565–73. doi: 10.1016/j.bone.2007.01.017. [DOI] [PubMed] [Google Scholar]
- 26.Bergwitz C, Juppner H. Regulation of phosphate homeostasis by PTH, vitamin D, and FGF23. Annu Rev Med. 2010;61:91–104. doi: 10.1146/annurev.med.051308.111339. [DOI] [PMC free article] [PubMed] [Google Scholar]
- 27.Shalhoub V, Ward SC, Sun B, Stevens J, Renshaw L, Hawkins N, et al. Fibroblast growth factor 23 (FGF23) and alpha-klotho stimulate osteoblastic MC3T3. E1 cell proliferation and inhibit mineralization. Calcif Tissue Int. 2011;89:140–50. doi: 10.1007/s00223-011-9501-5. [DOI] [PMC free article] [PubMed] [Google Scholar]
- 28.Sitara D, Kim S, Razzaque MS, Bergwitz C, Taguchi T, Schuler C, et al. Genetic evidence of serum phosphate-independent functions of FGF-23 on bone. PLoS Genet. 2008;4:e1000154. doi: 10.1371/journal.pgen.1000154. [DOI] [PMC free article] [PubMed] [Google Scholar]


