

Summary
High-grade gliomas are aggressive and uniformly fatal tumors, composed of a heterogeneous population of cells that include many with stem cell-like properties. The acquisition of stem-like traits might contribute to glioma initiation, growth and recurrence. Here we investigated the role of the transcription factor myeloid Elf-1 like factor (MEF, also known as ELF4) in glioma. We found that MEF is highly expressed in both human and mouse GBMs and its absence impairs gliomagenesis in a PDGF-driven glioma mouse model. We show that modulation of MEF levels in both mouse neural stem cells and human glioblastoma cells, has a significant impact on neurosphere formation. Moreover, we identify Sox2 as a direct downstream target of MEF. Taken together, our studies implicate MEF as a previously unrecognized gatekeeper gene in gliomagenesis by promoting stem cell characteristics through Sox2 activation.
INTRODUCTION
Malignant gliomas represent the most prevalent primary brain tumor in adults and inevitably have a poor prognosis. Despite the implementation of new therapeutic strategies, the median survival of patients with Glioblastoma multiforme (GBM), the most aggressive glioma variant, is only 14-16 months and these tumors remain rapidly and uniformly fatal (Wen and Kesari, 2008).
GBMs are very heterogeneous tumors that contain both neoplastic and non-neoplastic cells, including endothelial, stromal and inflammatory cells (Charles et al., 2011). A fraction of cells within the tumor, identified as glioma stem-like cells (GSCs), shares some common features with normal neural stem cells (NSCs); they are multipotent and have the property of self-renewal. These cells may either derive from adult undifferentiated stem and progenitor cells or they could acquire stem-like properties as a result of the genetic alterations that promote the tumorigenic process (Holmberg et al., 2011). When implanted into the brain of immunodeficient animals these GSCs are capable of generating new tumors at high efficiency (Galli et al., 2004). Moreover, GSCs are remarkably resistant to the chemotherapy and radiotherapy (Dean et al., 2005) used as standard first-line treatment of patients with malignant gliomas. Indeed, acquisition of stem-like characteristics likely contributes to the malignant nature of high-grade gliomas and may be responsible for the initiation, growth and recurrence of these tumors.
MEF (myeloid Elf-1 like factor, also known as ELF4) is a member of the ETS family of transcription factors, which contains over 30 family members. Several ETS proteins can function as oncogenes and show aberrant expression in solid tumors as well as in hematological malignancies (Sashida et al., 2010). While MEF has been proposed to function as a tumor suppressor gene in some contexts, it could contributes to tumor formation in mice as well as in human (Mikkers et al., 2002) (Sashida et al., 2010). Insight into its mechanism of action has come from studies done in fibroblasts demonstrating MEF’s ability to induce transformation by stimulating Mdm2 expression, thereby down-regulating p53-dependent responses, and by inhibiting activation of INK4a, thereby allowing unrestrained phosphorylation of the retinoblastoma (Rb) protein (Sashida et al., 2009). Some of the ETS proteins are known to play a role in brain tumors (Uht et al., 2007), though so far no published data are available regarding the role of MEF in normal brain or in brain tumor biology. Here we show that MEF is highly expressed in GBMs and it contributes to gliomagenesis by promoting stem cell traits, through direct activation of Sox2 expression.
RESULTS
MEF is highly expressed in human gliomas and its loss impairs glioma formation in mice
GBM represents a heterogeneous disease and recent genomic analyses have quantified the expression level of a wide variety of genes (2008). We analyzed the TCGA data set for GBMs and found MEF expression significantly elevated in the tumor samples (n=195) as compared to non tumor brain tissue (n=10) (p<0.0001; Student’s t test) (Fig 1A and Table S1), without evidence for amplification at the genomic level. Because MEF has previously been shown to block the p53 pathway, we examined the p53 status of these tumors and found no correlation between MEF expression levels and p53 mutation or deletion, suggesting that MEF may function in p53 independent manner in glioma (Fig S1A).
Fig 1. MEF in human and mouse gliomas.
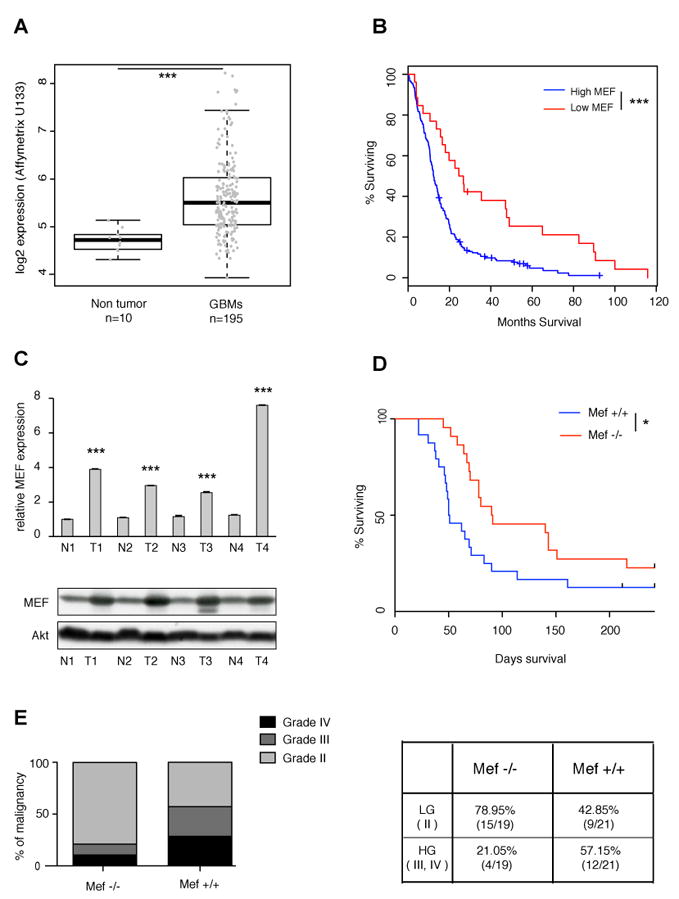
(A) MEF expression in the TCGA data set obtained from human GBM samples (n=195) and non tumor brain tissue (n=10) (***p=2.366e-09, Student’s t test). (B) Kaplan Meier survival curves of TCGA GBM patients: low level of MEF (calculated as less than one standard deviation from the mean of diploid tumors) significantly correlates with better overall survival (***log-rank p value p=0.000386). (C) Top panel: MEF mRNA level detected by RT PCR is higher in PDGF driven mouse GBMs (T) compared to normal tissue (N). Data are normalized to GAPDH expression. Results are presented as mean ± SD (***p<0.0001, Student’s t test); bottom panel: western blot showing that MEF protein level is higher in PDGF driven mouse GBMs compared to normal tissue. (D) Kaplan Meyer survival curves of PDGF gliomas generated in Ntva Mef+/+ vs. Mef-/- mice. MEF loss increases overall survival and reduces gliomagenesis (log-rank p value *p=0.02). (E) Left panel: mouse gliomas lacking MEF show significantly lower percentage of high-grade versus low-grade tumors (Fisher’s exact test *p=0.027); right panel: contingency table presenting the number of HG tumors vs. LG tumors in the two different genetic backgrounds. See also Fig S1.
A search conducted in the Oncomine website (https://www.oncomine.org) revealed that in the Sun data set (Sun et al., 2006), which includes 81 human GBMs (grade VI), 25 anaplastic astrocytomas (grade III) and 50 oligodendrogliomas (grade II), MEF expression is significantly higher in GBMs than lower grade gliomas (p<0.0001) (Fig S1B). To confirm these data we analyzed MEF expression by qPCR in 25 human glioma surgical samples from Memorial Sloan-Kettering Cancer Center (MSKCC) (6 oligodendrogliomas, 7 anaplastic oligodendrogliomas, 2 anaplastic astrocytomas and 10 glioblastomas) and found that MEF is significantly elevated in high-grade versus low-grade gliomas (p=0.02, Student’s t test) (Fig S1C). However, this difference might reflect a lower ratio of tumor cells versus non tumor cells in the low-grade samples.
Lower levels of MEF were associated with a better prognosis in a small cohort of acute myeloid leukemia patients (Fukushima et al., 2003). We examined the TCGA GBM patient survival data and found that low levels of MEF significantly correlated with better overall survival in GBMs as well (log rank test p=0.0008; Fig 1B). Gene expression profiling studies have identified four molecular subclasses of GBMs based on transcriptional signatures: Classical, Mesenchymal, Proneural and Neural. Each of these subtypes has been associated with specific signaling alterations, such as EGFR, Ras and PDGFR pathway activation, respectively (Verhaak et al., 2010). When the patients were stratified according to GBM subtypes, the Proneural subclass showed the lowest level of MEF expression (Fig S1D) and, within this subtype, lower levels of MEF also correlated with better overall survival (Fig S1E). When we looked at the IDH1 status we found that the tumors with the lowest MEF levels within the Proneural group were predominantly IDH1 mutant tumors, whereas IDH1 wild type Proneural tumors had a range of MEF levels similar to the other tumor types (data not shown).
To determine whether MEF plays an active role in gliomagenesis we used the RCAS/PDGF mouse glioma model, which closely resembles the human Proneural GBM subtype. RCAS/tv-a system utilizes avian leukosis virus based vectors (RCAS) to mediate gene transfer into somatic cells, engineered to be transgenic for its receptor (tv-a). Specifically, we used Nestin tv-a (Ntv-a) mice, where the tv-a receptor is under the control of the Nestin promoter, a well-known marker of progenitor and neural/glial cells. First, we evaluated MEF expression in a Ink4a/Arf null background, in which PDGF is able to uniformly generate high-grade gliomas, that share hallmark histological features with human GBMs (Dai et al., 2001). Using qPCR and western blot analysis, we found higher levels of MEF mRNA and protein in these tumors as compared to the contralateral normal brain tissues (Fig 1C).
Next, to determine if lack of MEF impacts on PDGF induced gliomagenesis, Mef-/- mice were crossed with Ntv-a mice (which carry a wild-type Ink4a/Arf locus) to generate Ntv-a Mef+/+ and Ntv-a Mef-/- mice. A survival analysis of the two cohorts revealed that loss of MEF significantly impaired PDGF-induced glioma formation, with MEF null mice living an average of 129 days (n=22) and the wild-type mice living 59 days (n=24) (p<0.02, log rank test) (Fig 1D). The tumors were then scored and graded by histological features (see Experimental procedures for details). Tumors lacking MEF showed less aggressive features, with significantly fewer high-grade gliomas (p=0.02, Fisher’s exact test) (Fig 1E). Thus, MEF can affect both glioma formation and progression.
MEF promotes proliferation of both mouse primary brain cultures and human glioma cell lines
As MEF has been shown to promote the transition of cells from G1 to S (Liu et al., 2006; Sashida et al., 2009) we evaluated its effect on proliferation, using both mouse primary brain cultures and human glioma cell lines. The primary cultures were generated from the whole brain of newborn pups and to investigate potential p53-independent effects, we used cells from Mef+/+ and Mef-/- mice and also from p53-/-/ Mef+/+ and p53-/-/Mef-/- mice. Cells lacking MEF grew more slowly than the control cells (Fig 2A and B), while its overexpression in p53-/- cells (Fig S2A) increased proliferation (Fig 2C). Similarly, the overexpression of MEF in the human U87MG and T98G glioma cell lines (Fig S2B and C) resulted in higher rates of cell proliferation (Fig 2D and E). These data confirm the role of MEF in promoting the growth of both mouse primary brain cultures and human glioma cell lines.
Fig 2. Mef promotes proliferation of both primary brain cultures and human glioma cell lines.
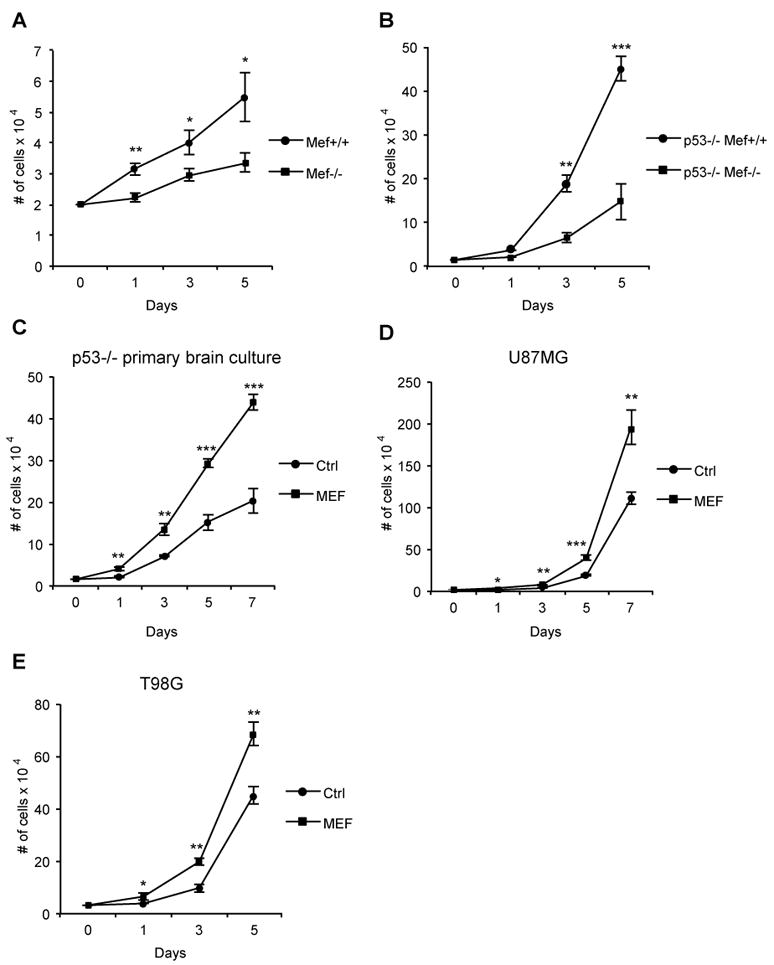
(A, B) Growth curve of primary brain cultures derived from Mef-/-, Mef+/+ (A) and p53-/-/Mef-/-, p53-/-/Mef+/+ (B) newborn mice. (C-E) Growth curve of primary brain cells derived from p53-/- newborn mice (C), human U87MG and T98G glioma cell lines (D and E). Results are presented as mean ± SD from a representative of three experiments performed in triplicate. *p<0.05; **p<0.001; ***p<0.0001 (Student’s t test). See also Fig S2.
MEF promotes stem cell characteristics in mouse neural stem cells and human glioma cell lines
In recent years, an increasing number of studies have investigated the connection between malignancy and ‘‘stemness”, focusing on how stem/progenitors cells, as well as neoplastic cells change their properties during the process of malignant transformation. Several transcription factors are known to induce pluripotent stem cells from differentiated cells, as well as to maintain multipotency of neural stem cells (Patel and Yang, 2010). Because MEF contributes to glioma formation and aggressiveness in vivo, we explored the possible role of MEF in promoting stem cell characteristics.
Neural stem cells and GSCs can be grown as spheres in culture, in the absence of serum but in the presence of basic fibroblast growth factor (bFGF) and epidermal growth factor (EGF). Although sphere-forming assays cannot be considered an exact readout of in vivo stem cell activity, they are useful to measure the in vitro potential of cells to exhibit stem cell-like traits (Pastrana et al., 2011), therefore we investigated whether MEF could influence the ability to form neurospheres.
Freshly isolated Mef-/- and Mef+/+ cells from postnatal non neoplastic brains were plated at different cell densities (10, 5 and 1 cells/μl) in 24 well plates and grown in neurosphere medium for 2 weeks to allow them to generate neurospheres. We then performed serial passages over the course of 8 weeks, generating secondary, tertiary, and quaternary spheres. Spheres were mechanically dissociated every 2 weeks and at each passage sphere number was assessed. We found that at a density of 1 cells/μl lack of MEF significantly decreased generation of secondary, tertiary and quaternary neurospheres (Student’s t test p<0.0001, at each passage) (Fig 3A). Similar results were obtained at higher cell concentrations (5 and 10 cells/μl) (Fig S3A). Moreover, cells lacking MEF underwent morphological changes over time, with some of them becoming attached to the bottom of the wells and presenting short elongation processes (Fig S3B). To understand whether the decreased sphere forming ability seen in Mef-/- cells was accompanied by increased differentiation, we grew cells from dissociated spheres in 5% serum medium without FGF and EGF to evaluate their differentiation potential. Phase contrast images revealed clear differences in the morphology of the Mef+/+ and Mef-/- cells, suggesting that differentiation is more profound in cells lacking MEF (Fig 3B). Immunofluorescence staining showed a significant reduction in Nestin + cells (p = 0.0006), together with a significant increase in both Olig2 and GFAP + cells (p<000.1 and p = 0.0481 respectively, Student’s t test) in Mef-/- cells (Fig 3C and D). These differences were detected also by western blot analysis (Fig 3E). Interestingly, most of the GFAP positive Mef-/- cells showed the stellate morphology typical of astrocytes and a brighter signal, which was confirmed by increased GFAP protein levels measured by western blot (Fig 3E). We failed to detect Tuj-1 positive cells in 3 of the 4 Mef-/- samples, while an average of 14.4% Tuj-1 positive cells was found in 4 different Mef+/+ samples (data not shown), which suggests that MEF might also contribute to differentiation toward the neuronal lineage.
Fig 3. MEF promotes stem cell traits of both primary brain cultures and glioma cell lines.
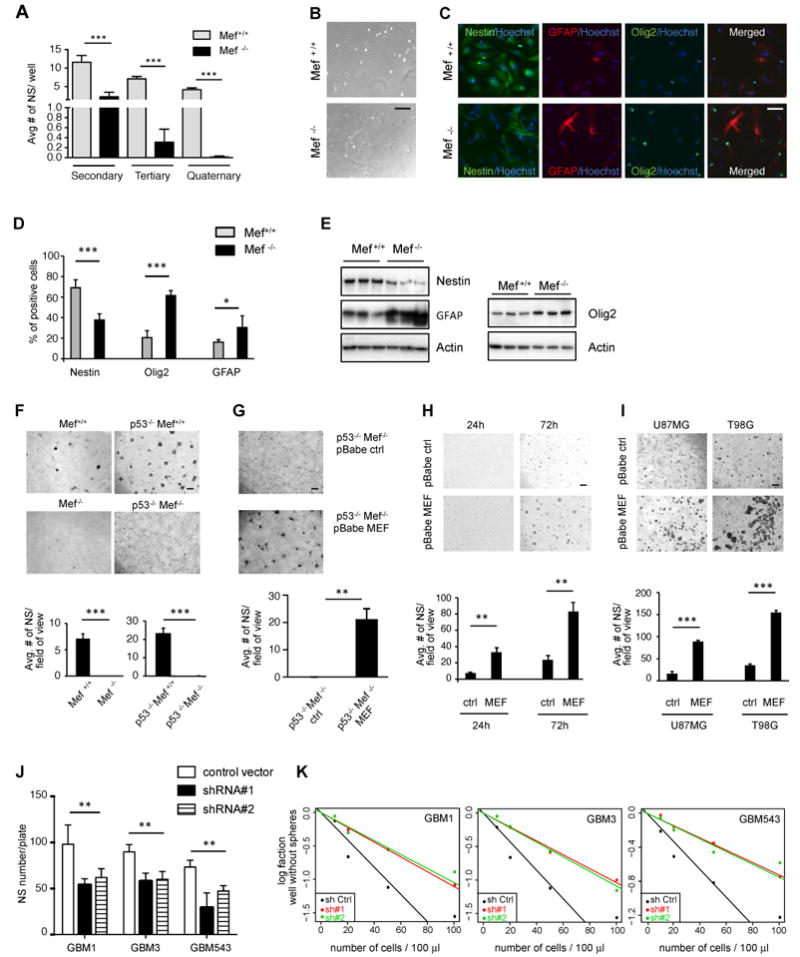
(A) Neurospheres isolated from newborn pups, with Mef+/+ and Mef-/- genetic background respectively: MEF loss led to impaired neurosphere formation after serial passages. (B) Phase contrast images showing morphological changes between Mef+/+ and Mef-/- brain cells grown in 5% serum, without bFGF and EGF, for 5 days to favor differentiation. (C and D) Immunofluorescence staining and quantification of Mef+/+ and Mef-/- brain cells grown in the above condition to favor differentiation. Positive staining is quantified as percentages of total Hoechst positive cells per image (10 fields of images were taken for each cell, derived from 4 Mef-/- and 4 Mef+/+ mouse brains); scale bars indicate 5μm. (E) Western blot comparing 3 Mef-/- vs to Mef+/+ brain cells: lack of MEF lead to decreased Nestin and increased Olig2 and GFAP protein levels. (F) Mef+/+, Mef-/-, p53-/-/Mef+/+ and p53-/-/Mef-/- primary brain cultures grown in neurosphere conditions. Scale bars indicate 100μm. (G) Re-expression of MEF in p53-/-Mef-/- cells rescues their ability to form neurospheres when cultured in neurosphere conditions. (H) Micrograph showing p53-/- primary brain cells transfected with pBabe-empty and pBabe-MEF retroviral vectors, cultured in neurosphere conditions. Bar graphs on the bottom show average neurosphere number per field of view. (I) MEF overexpressing human U87 and T98G cell lines, cultured in neurosphere conditions, form more neurospheres compared to control. Bar graphs on the bottom show average neurosphere number per field of view. (J) Graph bar showing decreased neurosphere formation after MEF knock down in patients-derived human primary GBMs (GBM1, 3 and 543). (K) Graph represent limiting dilution neurosphere assays in patients-derived human primary GBMs (GBM1, 3 and 543) infected with pGipz control vector and pGipz MEF sh RNAs #1 and #2. Results are presented as mean ± SD from a representative of three experiments performed in triplicate, unless otherwise specified. *p<0.05; **p<0.005; ***p<0.0001 (Student’s t test). See also Fig S3.
To determine whether lack of MEF could influence the stem cell potential under more strict conditions, we generated primary cell cultures obtained from the whole brain of newborn pups, forced them to grow in serum for two passages and switched them to neurosphere medium. To evaluate possible p53-independent effects, primary brain cultures were isolated from different genetic backgrounds (Mef+/+, Mef-/-, p53-/-/Mef+/+ and p53-/-/ Mef-/-). Four days after the switch to neurosphere medium, cells lacking MEF failed to form spheres, while both the Mef+/+ and the p53-/-/Mef+/+ cells were able to do so (p=0.0003 and p=0.0001 respectively, Student’s t test) (Fig 3F). The impaired neurosphere formation of the p53-/-/Mef-/- cells could be rescued by MEF re-expression (p=0.00145, Student’s t test) (Fig 3G and Fig S3C).
We then investigated whether MEF overexpression could induce reprogramming signals under the same strict conditions, influencing the sphere-forming ability of different primary and glioma cells. We first overexpressed MEF in primary brain cultures obtained from p53 null pups, using retroviral vectors (Fig S2A). After antibiotic selection, the cells were grown in serum for 2 passages and then switched to neurosphere medium. We found that cells overexpressing MEF formed more neurospheres than the control cells (p=0.0012 at 24 hours, p= 0.0017 at 72 hours; Student’s t test) (Fig 4H). Similar differences upon MEF overexpression were observed in the U87MG and T98G human glioma cell lines (p<000.1 and p<000.1 respectively, Student’s t test) (Fig 3I).
Fig 4. Sox2 gene is regulated by MEF.
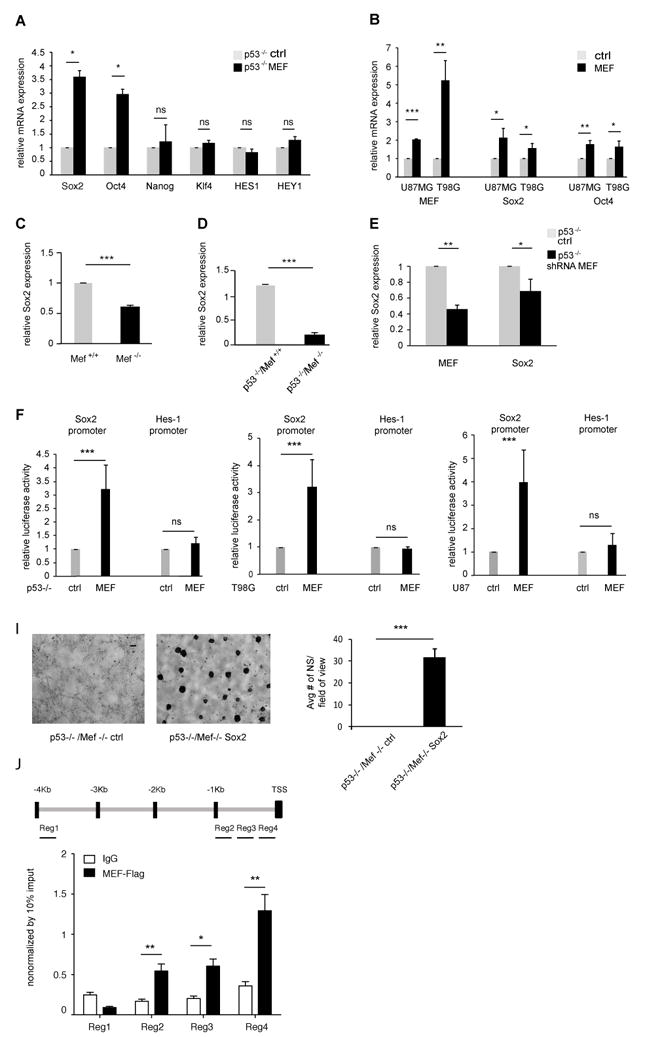
(A, B) MEF overexpression in p53-/- primary brain cells as well as in U87MG and T98G human glioma cell lines led to increased Sox2 expression. Data are normalized to GAPDH expression. (C, D) Lack of MEF decreases Sox2 expression. Data are normalized to GAPDH expression. (E) Acute knock down of MEF in p53-/- primary brain cells led to decreased Sox2 expression. Data are normalized to GAPDH expression. (F-H) Dual luciferase assays showing that MEF activates Sox2 promoter in p53-/- primary brain cells as well as T98G and U87MG human glioma cell lines. (I) Sox2 overexpression in p53-/-/Mef-/- primary brain cultures grown in neurosphere conditions rescues their ability to form neurospheres. Scale bar indicates 100μm. Bar graph shows average neurosphere number per field of view. (J) ChIP experiments were performed on T98G glioma cells using antibody to Flag. Plotted values are relative enrichments (y-axis) to 10% input and measured for sites in the SOX2 promoter (x-axis). Antibody against IgG was used as a nonspecific control. Results are presented as mean ± SD from a representative of three experiments performed in triplicate. *p<0.05; **p<0.001; ***p<0.0001 (Student’s t test). See also Fig S4.
Lastly, we evaluated the impact of MEF on stem-like properties using human primary GSCs, with various genetic profiles. Tumor samples, isolated from patients suffering from GBMs, undergoing surgery at Memorial Sloan-Kettering Cancer Center, were dissociated and initially grown in neurosphere medium as a monolayer on plastic cell culture dishes coated with 10ng/ml laminin. Specifically we used the following cells: GBM1 (++PDGFRA, +EGFR, MET, CDK6, -PTEN, --CDKN2A), GBM3 (++EGFR, +MET, CDK6, -CDKN2A, PTEN, carrying EGFRvIII mutation), and GBM543 (++PDGFRA, ++CDK4, +(EGFR, MET, CDK6), -PTEN) (Ozawa et al., 2010; Pulvirenti et al., 2011). Using lentiviral vectors to express shRNAs, we silenced MEF expression (Fig S3D) and found that decreased MEF levels lead to a significant decrease in neurosphere formation in all of these three GSC lines (p<0.0001 for both sh#1 and sh#2), as compared to non-targeting shRNA control (Fig 3J). Moreover, when we performed limiting dilution neurosphere assays, we confirmed that MEF knockdown leads to a reduced frequency of sphere forming cells (p<000.1 for both shRNAs in each GSC lines, ELDA software) (Fig 3K).
Taken together, these data suggest a role for MEF in promoting stem cell-like features in both primary brain cultures and glioma cell lines.
Sox2 gene is a direct target of MEF and rescues sphere forming ability in MEF defective cells
To investigate possible mechanisms behind the ability of MEF to promote stem-cell traits, we measured the expression level of several genes related to pluripotency, including Sox2, Oct4, Nanog, Klf4, Hes-1 and Hey1, in MEF-transduced p53-/- primary brain cells. Among these genes, we found that Sox2 and Oct4 expression was significantly increased by MEF. We observed a 3.6-fold increase in Sox2 gene expression and a 3-fold increase in Oct4 expression level (p=0.02 and p=0.013 respectively, Student’s t test) (Fig 4A). Similarly, in U87MG and T98G cells MEF induced a 2.1 (p=0.017) and 1.6 (p=0.018) fold increase in Sox2 levels respectively and a 1.8 (p=0.0025) and 1.6 (p=0.0199) fold increase in Oct4 levels (Fig 4B).
The Sox2 promoter is known to contain ETS binding sites (Wiebe et al., 2000), while they have not been identified in the Oct4 promoter, therefore we focused on Sox2 as a possible direct downstream target of MEF. We analyzed Sox2 expression in Mef+/+ vs. Mef-/- and p53-/-/Mef+/+ vs. p53-/-/Mef-/- primary brain cells and found a significant reduction in Sox2 levels in the absence of MEF (p<0.0001, Student’s t test) (Fig 4C, D). To exclude the possibility that developmental adaptation to the lack of MEF resulted in decreased Sox2 expression, we acutely knocked down MEF in p53 null primary brain cultures (∼60%) and found a significant reduction in Sox2 expression (p=0.015 and p=0.0059 respectively, Student’s t test) (Fig 4E). Thus, both the acute loss and chronic absence of MEF substantially decreases Sox2 expression.
To test whether MEF can activate the Sox2 promoter, we transiently transfected a Sox2 promoter driven luciferase reporter plasmid (Kuwabara et al., 2004) into p53 null primary brain cells, together with MEF or an empty vector control. As shown in Fig 4F, MEF induced a more than 3 fold increase in luciferase activity from the Sox2 promoter (p<0.0001, Student’s t test) while having no effect on Hes1 promoter driven luciferase activity. We also investigated whether MEF activates the Sox2 promoter in human glioma cell lines and found a similar upregulation (p<0.0001, Student’s t test) (Fig 4G and H).
Having identified Sox2 as a transcriptional target of MEF, we investigated whether Sox2 overexpression could rescue the decrease in neurosphere formation seen in cells lacking MEF. We overexpressed Sox2 in p53-/-/Mef-/- primary brain cultures (Fig S4B) and grew them in neurosphere conditions. The absence of neurospheres seen in cells lacking MEF was rescued by Sox2 overexpression (p=0.00018, Student’s t test) indicating that Sox2 acts downstream of MEF to promote neurosphere formation (Fig 4I).
To confirm that Sox2 gene regulation by MEF was direct, we performed Chromatin Immunoprecipitation (ChIP) assays using T98G glioma cells, that were transduced with a pBabe retroviral vector expressing a Flag tagged MEF cDNA or a control vector. Using an anti-FLAG ChIP assay, we found that in human glioma cells MEF protein is recruited to specific regions of the SOX2 gene (which covered -1.964, -1.672 and -1.324 kb from the transcription starting site (TSS); p values: 0.0009, 0.003, 0.0008 respectively). No direct binding was observed at the farthest region (-3.841 kb) (Fig 4J).
DISCUSSION
The regulation of stemness is of interest to many disciplines, including developmental biology, regenerative medicine, degenerative disease and cancer. Normal stem cells are known to play critical roles in tissue development, differentiation and organogenesis (Vierbuchen et al., 2010). Several transcription factors, such as Notch, Id1, Sox2, Oct4 and others, have been reported to control different aspects of stemness, influencing the delicate balance between stem cell maintenance and the promotion of stem cell differentiation. In recent years, many studies have shown that genes involved in normal stem cell biology also play a relevant role in tumorigenesis (Nam and Benezra, 2009) (Venere et al., 2011).
Malignant gliomas are highly aggressive cancers composed of a heterogeneous cell population, a fraction of which exhibits stem-like characteristics (Vescovi et al., 2006). Whether GSCs arise from normal neural stem cells or from neoplastic cells that have acquired stem cell traits is still unclear, however, it has been proposed that the acquisition of stem cell characteristics through the activation of stem cell gene signatures can confer malignant potential to gliomas (Holmberg et al., 2011).
We have shown that MEF (also known as ELF4), a member of the ETS family of transcription factors, contributes to gliomagenesis and promotes stem-like characteristics. MEF is highly expressed in both human and mouse GBMs, and GBM patients with low levels of MEF show a significantly better overall survival. This finding was replicated in the RCAS/PDGF model where gliomas that lack MEF had less aggressive histological features and better overall survival.
Genes overexpressed in cancer can affect many different biological processes including growth, stress response, block of apoptosis and stemness. Uncontrolled proliferation is a key aspect of cancer cell behavior and we found that MEF promotes the proliferation of both mouse primary brain cultures and human glioma cell lines, contributing to the pathogenesis of gliomas. Another key feature of glioma malignancy is the activation of neural and pluripotent stem cell gene expression signatures. We found that mouse primary brain cells lacking MEF and its silencing in human primary glioblastoma stem-like cells have an impaired capacity to generate spheres, together with an increased differentiation potential. Conversely, MEF overexpression increases neurosphere formation of both mouse primary brain cells and glioma cell lines. Collectively, our data suggest that MEF plays a role in promoting stem-like traits, which might reflect changes in the stem cell signature of both neoplastic and non neoplastic cells.
We have further implicated MEF in promoting stem cell traits through direct activation of Sox2 expression. The HMG-box transcription factor Sox2 is known to play an important role in maintaining stem cell self-renewal within the central nervous system (CNS) and this activity is present in gliomas as well (Pevny and Nicolis, 2010). Sox2 has been described to act as an oncogene in different human cancers including gliomas (Basu-Roy et al., 2011). While the role of Sox2 in normal brain and glioma cells has been well documented, the transcription factors that activate its expression in these contexts are less clear (Denysenko et al., 2010; Ikushima et al., 2009). We identified Sox2 as a direct target of MEF in mouse primary brain cells and human glioma cell lines, as either acute or chronic modulation of MEF levels affected Sox2 gene expression and promoter activation. MEF directly binds to Sox2 promoter in T98G glioma cells. We observed that overexpression of Sox2 in p53-/-/Mef-/- cells was sufficient to rescue the impaired ability of these cells to form neurospheres. Thus, our data suggest that Sox2 is downstream of MEF and may be responsible for its ability to modulate stem-like characteristics.
Given the cellular heterogeneity and molecular complexity of gliomas, it is unclear in which contexts the stem cell property of self renewal might represent a feature associated with increased tumorigenic potential (Barrett et al., 2012). Additionally, the so called “glioma stem-like cells” within different tumors may vary in terms of proliferation rates which might impact their aggressiveness regardless of their self renewal properties. To date, it is often difficult to distinguish between the contributions of proliferation versus self-renewal to the process of gliomagenesis, nonetheless self-renewal inevitably entails proliferative events. Adding to the intricacy, acquisition of reprogramming signals generated by alterations in specific genes or pathways (Notch, Id1, Sox2, Oct4, etc.) might differentially impact on these two diverse aspects.
Our work defines the role of MEF in promoting stem cell features in both primary mouse brain cells and human glioblastoma cells via direct regulation of Sox2 expression provides novel insights into the multifaceted regulation of stemness. Further work is necessary to better define the MEF/Sox2-mediated acquisition of stem cell traits and whether it modulates the response to chemotherapy and radiotherapy.
EXPERIMENTAL PROCEDURES
TCGA analysis
TCGA data was downloaded from the TCGA Data Portal (http://tcga-data.nci.nih.gov/) or the cBio Cancer Genomics Portal (Cerami et al., 2012) (http://cbioportal.org). Subtype information was retrieved from Verhaak et al. 2010. Low MEF expression in the TCGA data set was defined using the median expression data (median of three platforms, see Verhaak et al. 2010) as one standard deviation lower than the mean of all tumors. All other analyses were performed using data from the Affymetrix U133 microarray platform. Expression data was available for 196 tumors and 10 normal brain samples (Table S1).
Generation of primary brain cultures, primary brain neurosphere and neurosphere formation assay
The Mef+/+, Mef-/-, p53-/- and p53-/-Mef-/- primary brain cultures were prepared with mechanical dissociation of the whole brain from newborn mice. The cells were then filtered through a 70 μm Nylon strainer and plated in 10 cm culture dishes (procedure derived with minor modifications from the previously described experimental method) (Dai et al., 2001). Mouse primary brain cultures as well as T98G and U87MG human glioma cell lines, were plated at 20 cells/μl in neurosphere medium. Mouse primary brain neurospheres were isolated as previously described (Bleau et al., 2009) and plated at different concentrations (10, 5, 1 cell/μl). Human primary glioblastoma neurospheres were freshly isolated from patients suffering from GBMs, undergoing surgery at Memorial Sloan-Kettering Cancer Center. Primary GBM samples were dissociated, plated at different concentrations (1, 0.5, 0.2, 0.1 cells/μl) and grown in neurosphere medium. Neurosphere medium consisted of Neural Stem Cell (NSC) Basal Medium, NSC proliferation supplements, 10 ng/ml EGF, 20 ng/ml basic-FGF and 1 mg/ml Heparin (Stem Cell Technologies, Vancouver, Canada). Neurosphere number was established by counting the number of neurospheres per well or, for U87MG and T98G, by taking pictures of the central part of the plates and then counting the neurosphere number per field of view.
Supplementary Material
Highlights.
Human and mouse glioblastoma samples express high levels of MEF gene
Lack of MEF in mouse models impairs glioma formation and aggressiveness
MEF promotes stem cell traits of mouse primary brain cells and human glioma cells
Sox2 gene expression is directly regulated by MEF
Acknowledgments
We thank J. Finney and Q. Zhang for technical assistance. We extend thanks to all members of Dr. E. Holland’s and Dr. S. Nimer’s laboratories for their helpful comments and suggestions. We sincerely thank Prof. F. H. Gage for providing the Sox2 promoter-driven luciferase construct, Dr. E. P. Papapetrou for providing the human pLM-YS SOX2 vector and G. Sashida for providing the pBabe-Puro-lentivirus MEF vector and the pLKO.1-Puro-lentivirus vector containing mouse Mef-specific shRNA. This work was supported by a grant from National Brain Tumor Foundation, RO1-DK52208 grant (S.D.N.) and by U54CAI43798, UO1CA141502 and RO1CA100688 grants (E.C.H). E.B. has been supported by Brain Tumor Center of Memorial Sloan-Kettering Cancer Center. M.C.O. has been supported by the Rottendorf Foundation, Ennigerloh, Germany, and the Gerhard Domagk Scholarship Program, Greifswald, Germany. This work is dedicated to the memory of Dr. Mark A. Zatzkis, a dear friend of S.D.N., who died of a GBM in 2007.
Footnotes
Publisher's Disclaimer: This is a PDF file of an unedited manuscript that has been accepted for publication. As a service to our customers we are providing this early version of the manuscript. The manuscript will undergo copyediting, typesetting, and review of the resulting proof before it is published in its final citable form. Please note that during the production process errors may be discovered which could affect the content, and all legal disclaimers that apply to the journal pertain.
References
- Barrett LE, Granot Z, Coker C, Iavarone A, Hambardzumyan D, Holland EC, Nam HS, Benezra R. Self-renewal does not predict tumor growth potential in mouse models of high-grade glioma. Cancer Cell. 2012;21:11–24. doi: 10.1016/j.ccr.2011.11.025. [DOI] [PubMed] [Google Scholar]
- Bleau AM, Hambardzumyan D, Ozawa T, Fomchenko EI, Huse JT, Brennan CW, Holland EC. PTEN/PI3K/Akt pathway regulates the side population phenotype and ABCG2 activity in glioma tumor stem-like cells. Cell Stem Cell. 2009;4:226–235. doi: 10.1016/j.stem.2009.01.007. [DOI] [PMC free article] [PubMed] [Google Scholar]
- Charles NA, Holland EC, Gilbertson R, Glass R, Kettenmann H. The brain tumor microenvironment. Glia. 2011;59:1169–1180. doi: 10.1002/glia.21136. [DOI] [PubMed] [Google Scholar]
- Dai C, Celestino JC, Okada Y, Louis DN, Fuller GN, Holland EC. PDGF autocrine stimulation dedifferentiates cultured astrocytes and induces oligodendrogliomas and oligoastrocytomas from neural progenitors and astrocytes in vivo. Genes Dev. 2001;15:1913–1925. doi: 10.1101/gad.903001. [DOI] [PMC free article] [PubMed] [Google Scholar]
- Dean M, Fojo T, Bates S. Tumour stem cells and drug resistance. Nat Rev Cancer. 2005;5:275–284. doi: 10.1038/nrc1590. [DOI] [PubMed] [Google Scholar]
- Denysenko T, Gennero L, Roos MA, Melcarne A, Juenemann C, Faccani G, Morra I, Cavallo G, Reguzzi S, Pescarmona G, et al. Glioblastoma cancer stem cells: heterogeneity, microenvironment and related therapeutic strategies. Cell Biochem Funct. 2010;28:343–351. doi: 10.1002/cbf.1666. [DOI] [PubMed] [Google Scholar]
- Fukushima T, Miyazaki Y, Tsushima H, Tsutsumi C, Taguchi J, Yoshida S, Kuriyama K, Scadden D, Nimer S, Tomonaga M. The level of MEF but not ELF-1 correlates with FAB subtype of acute myeloid leukemia and is low in good prognosis cases. Leuk Res. 2003;27:387–392. doi: 10.1016/s0145-2126(02)00214-x. [DOI] [PubMed] [Google Scholar]
- Galli R, Binda E, Orfanelli U, Cipelletti B, Gritti A, De Vitis S, Fiocco R, Foroni C, Dimeco F, Vescovi A. Isolation and characterization of tumorigenic, stem-like neural precursors from human glioblastoma. Cancer Res. 2004;64:7011–7021. doi: 10.1158/0008-5472.CAN-04-1364. [DOI] [PubMed] [Google Scholar]
- Holmberg J, He X, Peredo I, Orrego A, Hesselager G, Ericsson C, Hovatta O, Oba-Shinjo SM, Marie SK, Nister M, et al. Activation of neural and pluripotent stem cell signatures correlates with increased malignancy in human glioma. PLoS One. 2011;6:e18454. doi: 10.1371/journal.pone.0018454. [DOI] [PMC free article] [PubMed] [Google Scholar]
- Ikushima H, Todo T, Ino Y, Takahashi M, Miyazawa K, Miyazono K. Autocrine TGF-beta signaling maintains tumorigenicity of glioma-initiating cells through Sry-related HMG-box factors. Cell Stem Cell. 2009;5:504–514. doi: 10.1016/j.stem.2009.08.018. [DOI] [PubMed] [Google Scholar]
- Kuwabara T, Hsieh J, Nakashima K, Taira K, Gage FH. A small modulatory dsRNA specifies the fate of adult neural stem cells. Cell. 2004;116:779–793. doi: 10.1016/s0092-8674(04)00248-x. [DOI] [PubMed] [Google Scholar]
- Liu G, Yuan X, Zeng Z, Tunici P, Ng H, Abdulkadir IR, Lu L, Irvin D, Black KL, Yu JS. Analysis of gene expression and chemoresistance of CD133+ cancer stem cells in glioblastoma. Mol Cancer. 2006;5:67. doi: 10.1186/1476-4598-5-67. [DOI] [PMC free article] [PubMed] [Google Scholar]
- Mikkers H, Allen J, Knipscheer P, Romeijn L, Hart A, Vink E, Berns A. High-throughput retroviral tagging to identify components of specific signaling pathways in cancer. Nat Genet. 2002;32:153–159. doi: 10.1038/ng950. [DOI] [PubMed] [Google Scholar]
- Nam HS, Benezra R. High levels of Id1 expression define B1 type adult neural stem cells. Cell Stem Cell. 2009;5:515–526. doi: 10.1016/j.stem.2009.08.017. [DOI] [PMC free article] [PubMed] [Google Scholar]
- Ozawa T, Brennan CW, Wang L, Squatrito M, Sasayama T, Nakada M, Huse JT, Pedraza A, Utsuki S, Yasui Y, et al. PDGFRA gene rearrangements are frequent genetic events in PDGFRA-amplified glioblastomas. Genes Dev. 2010;24:2205–2218. doi: 10.1101/gad.1972310. [DOI] [PMC free article] [PubMed] [Google Scholar]
- Pastrana E, Silva-Vargas V, Doetsch F. Eyes wide open: a critical review of sphere-formation as an assay for stem cells. Cell Stem Cell. 2011;8:486–498. doi: 10.1016/j.stem.2011.04.007. [DOI] [PMC free article] [PubMed] [Google Scholar]
- Patel M, Yang S. Advances in reprogramming somatic cells to induced pluripotent stem cells. Stem Cell Rev. 2010;6:367–380. doi: 10.1007/s12015-010-9123-8. [DOI] [PMC free article] [PubMed] [Google Scholar]
- Pevny LH, Nicolis SK. Sox2 roles in neural stem cells. Int J Biochem Cell Biol. 2010;42:421–424. doi: 10.1016/j.biocel.2009.08.018. [DOI] [PubMed] [Google Scholar]
- Pulvirenti T, Van Der Heijden M, Droms LA, Huse JT, Tabar V, Hall A. Dishevelled 2 signaling promotes self-renewal and tumorigenicity in human gliomas. Cancer Res. 2011;71:7280–7290. doi: 10.1158/0008-5472.CAN-11-1531. [DOI] [PMC free article] [PubMed] [Google Scholar]
- Sashida G, Bazzoli E, Menendez S, Liu Y, Nimer SD. The oncogenic role of the ETS transcription factors MEF and ERG. Cell Cycle. 2010;9:3457–3459. doi: 10.4161/cc.9.17.13000. [DOI] [PMC free article] [PubMed] [Google Scholar]
- Sashida G, Liu Y, Elf S, Miyata Y, Ohyashiki K, Izumi M, Menendez S, Nimer SD. ELF4/MEF activates MDM2 expression and blocks oncogene-induced p16 activation to promote transformation. Mol Cell Biol. 2009;29:3687–3699. doi: 10.1128/MCB.01551-08. [DOI] [PMC free article] [PubMed] [Google Scholar]
- Sun L, Hui AM, Su Q, Vortmeyer A, Kotliarov Y, Pastorino S, Passaniti A, Menon J, Walling J, Bailey R, et al. Neuronal and glioma-derived stem cell factor induces angiogenesis within the brain. Cancer Cell. 2006;9:287–300. doi: 10.1016/j.ccr.2006.03.003. [DOI] [PubMed] [Google Scholar]
- The Cancer Genome Network. Comprehensive genomic characterization defines human glioblastoma genes and core pathways. Nature. 2008;455:1061–1068. doi: 10.1038/nature07385. [DOI] [PMC free article] [PubMed] [Google Scholar]
- Uht RM, Amos S, Martin PM, Riggan AE, Hussaini IM. The protein kinase C-eta isoform induces proliferation in glioblastoma cell lines through an ERK/Elk-1 pathway. Oncogene. 2007;26:2885–2893. doi: 10.1038/sj.onc.1210090. [DOI] [PubMed] [Google Scholar]
- Venere M, Fine HA, Dirks PB, Rich JN. Cancer stem cells in gliomas: identifying and understanding the apex cell in cancer’s hierarchy. Glia. 2011;59:1148–1154. doi: 10.1002/glia.21185. [DOI] [PMC free article] [PubMed] [Google Scholar]
- Verhaak RG, Hoadley KA, Purdom E, Wang V, Qi Y, Wilkerson MD, Miller CR, Ding L, Golub T, Mesirov JP, et al. Integrated genomic analysis identifies clinically relevant subtypes of glioblastoma characterized by abnormalities in PDGFRA, IDH1, EGFR, and NF1. Cancer Cell. 2010;17:98–110. doi: 10.1016/j.ccr.2009.12.020. [DOI] [PMC free article] [PubMed] [Google Scholar]
- Vescovi AL, Galli R, Reynolds BA. Brain tumour stem cells. Nat Rev Cancer. 2006;6:425–436. doi: 10.1038/nrc1889. [DOI] [PubMed] [Google Scholar]
- Vierbuchen T, Ostermeier A, Pang ZP, Kokubu Y, Sudhof TC, Wernig M. Direct conversion of fibroblasts to functional neurons by defined factors. Nature. 2010;463:1035–1041. doi: 10.1038/nature08797. [DOI] [PMC free article] [PubMed] [Google Scholar]
- Wen PY, Kesari S. Malignant gliomas in adults. N Engl J Med. 2008;359:492–507. doi: 10.1056/NEJMra0708126. [DOI] [PubMed] [Google Scholar]
- Wiebe MS, Wilder PJ, Kelly D, Rizzino A. Isolation, characterization, and differential expression of the murine Sox-2 promoter. Gene. 2000;246:383–393. doi: 10.1016/s0378-1119(00)00086-x. [DOI] [PubMed] [Google Scholar]
Associated Data
This section collects any data citations, data availability statements, or supplementary materials included in this article.